Loading the model
This device cannot show the 3D model. You can read the guide steps below as text.
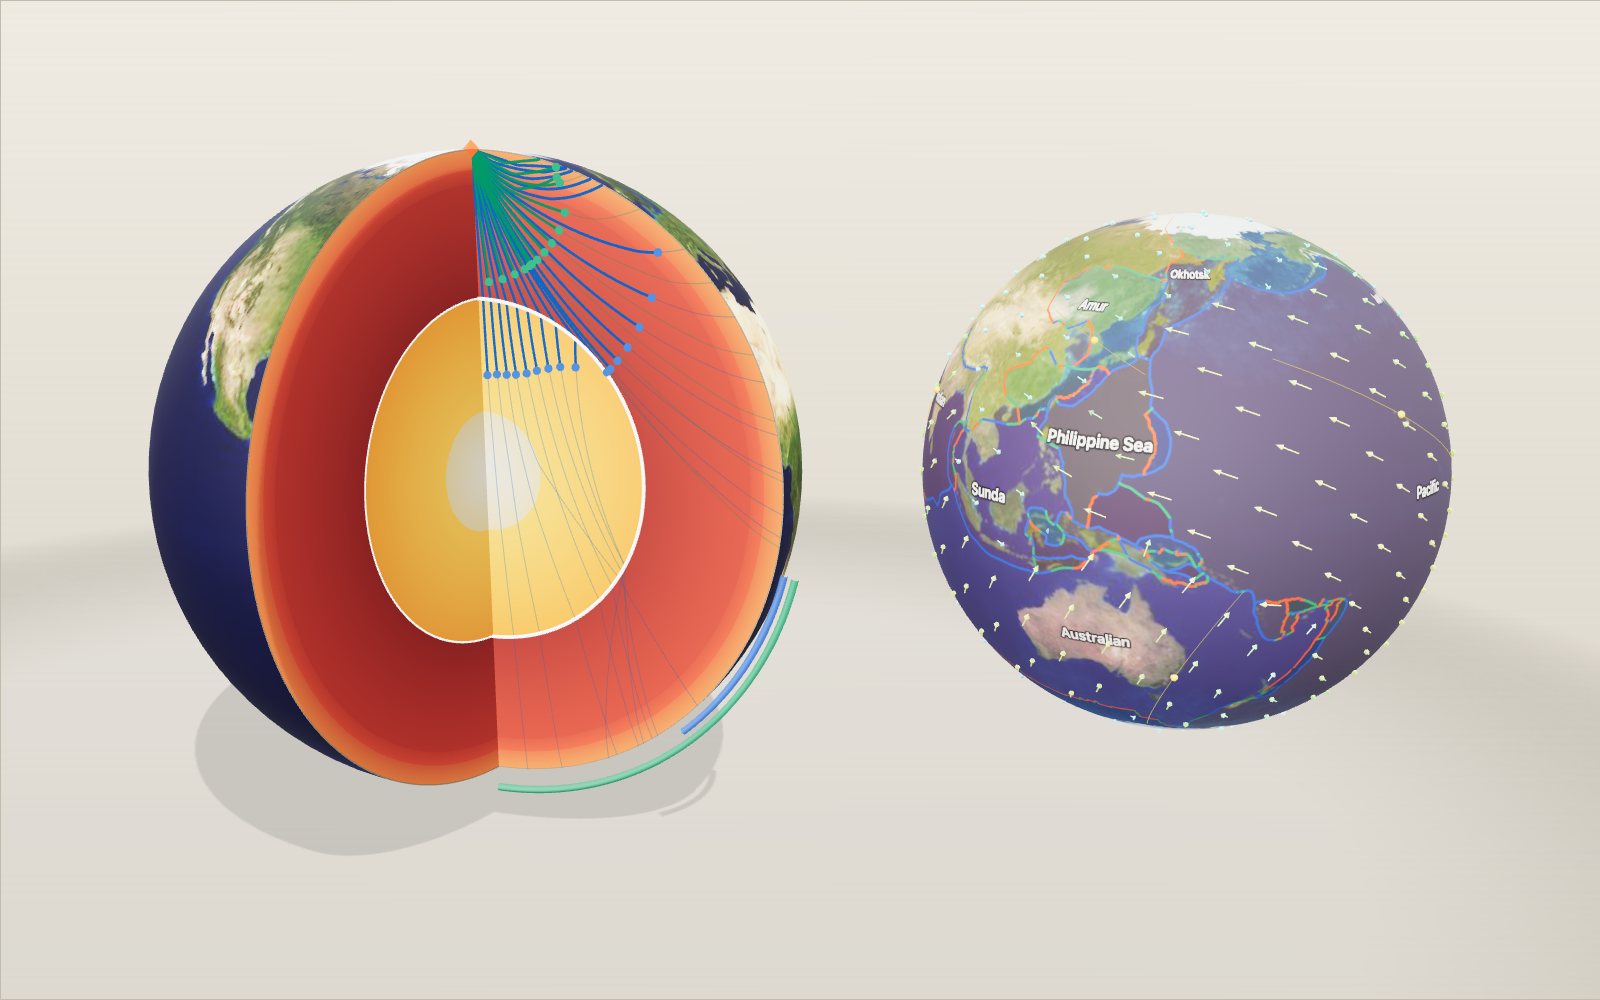
1 / 20 The Earth cut open A quarter of the planet has been removed so you can see the layers on the two flat faces. Drag to turn it, scroll or pinch to zoom. The bar at the bottom of the stage switches between nine scenes, from this cut-away to plates, the magnetic field and an earthquake lab.
Drag to turn. Scroll or pinch to zoom.
Guide Parts Controls
01 The Earth cut open A quarter of the planet has been removed so you can see the layers on the two flat faces. Drag to turn it, scroll or pinch to zoom. The bar at the bottom of the stage switches between nine scenes, from this cut-away to plates, the magnetic field and an earthquake lab.
02 The crust The surface rocks are so thin at this scale that the crust is barely a line: 24 km out of 6,371. Below it, at the Moho, P waves suddenly speed up from 6.8 to 8.1 km/s.
03 The mantle Almost 2,900 km of solid rock. At 400 and 670 km the minerals change to denser forms and the wave speed jumps. By 670 km the pressure is already 24 GPa, about 235,000 times the air pressure at sea level.
04 The liquid outer core At 2,891 km the rock ends and molten iron begins. Density nearly doubles, from 5.6 to 9.9 g/cm³, and the S wave speed drops to zero. Switch on S waves and watch them stop here.
05 The solid inner core 5,150 km down the iron freezes again. The temperature is estimated at 5,400 to 6,300 K, yet 329 GPa of pressure keeps it solid.
06 Waves that bend Speed rises with depth, so rays curve back up to the surface. The dots are wave fronts, with 1 second on screen standing for 60 seconds. A P wave reaches the far side of the Earth about 20 minutes after the quake.
07 The shadow zones Between about 104° and 140° from the quake, direct P waves do not arrive: the core bends them away. S waves are missing beyond 104° because they cannot cross the liquid core. That missing signal is how the core was found.
08 The centre At 6,371 km the pressure is 364 GPa, about 3.6 million atmospheres, and the density is 13.1 g/cm³. Gravity here is zero; it is strongest at the top of the core, 10.7 m/s².
09 Plates on the move The surface is broken into plates. This map has Peter Bird's 52, with their boundaries coloured by type. The arrows show how fast each patch of ground moves today, from the NNR-MORVEL56 model: up to about 72 mm a year on the Pacific plate. Click anywhere on the globe to read the plate and its speed.
10 Run the plate clock The yellow dots are towns riding on their plates. Moving the plate time slider keeps today's rotations running for up to 50 million years either way. New York and Lisbon drift about 1,100 km further apart. This is a concept, not a reconstruction: real plates change speed and direction.
11 A plate goes down At the Japan Trench the Pacific plate bends and sinks under north-east Japan at about 86 mm a year. The white marks ride along with it, one second for a million years. Earthquakes happen inside the cold slab far deeper than anywhere else, down to about 680 km.
12 Why volcanoes stand in a line Volcanoes rise where the top of the slab is about 105 km deep: there water squeezed from the slab lowers the melting point of the hot mantle above it. Change the dip and watch the arc move. A steep slab puts the volcanoes close to the trench; a gentle one pushes them far inland.
13 A hotspot under Hawaii Hot rock rises under the Pacific plate. Each volcano grows while it sits over the plume, then the plate carries it away and a new one starts. So the islands get older towards the north-west, from Kīlauea to Kaua'i at about 5 million years and Midway at 28.
14 Rewinding the plate Slide the plate back in time and the chain shrinks into the plume. At 47.5 million years the chain bends: before that the Pacific plate moved north, afterwards west-north-west. The rewind is built from the dated volcanoes only, with the hotspot held still.
15 Stripes on the sea floor At a ridge, new crust cools and freezes the direction of the magnetic field into its iron minerals. The field has flipped many times, so the floor carries dark and light stripes, mirrored on both sides. The width of a stripe is its time span multiplied by the spreading rate.
16 The mantle turns over Solid rock flows. Cold slabs sink, some of them all the way to the core, and hot plumes rise from two huge piles on the core under Africa and the Pacific. This scene is a concept picture: the real flow is three-dimensional and takes tens of millions of years to cross the mantle.
17 The field from the core Flowing liquid iron in the outer core makes the Earth's magnetic field. Seen from outside it looks much like a bar magnet tilted about 9° from the spin axis. The north magnetic pole wanders: the red line is its path since 1590, and around 2010 it moved nearly 58 km a year.
18 How deep have we been? The Kola hole reached 12,262 m, the KTB hole 9,101 m, and the ship Chikyu ran 7,906 m of pipe at the Japan Trench. The deepest sea floor is 10,935 m down. Switch the depth scale to the centre and all of them shrink to a hairline: Kola is 0.19 % of the radius.
19 An earthquake spreads The 2011 Tōhoku quake. The blue ring is the P wave front, the green one the S wave, the orange one the surface waves, all at speeds from PREM. Three yellow stations record them; their seismograms build up in the panel as the clock runs.
20 Locating it from three stations S waves fall further behind P the further they travel, so the S-P time gives each station its distance. Draw a circle of that size around each station: the three circles cross at the epicentre. Try the task under the controls with a quake whose place is hidden.
Crust The rocky skin we live on. PREM uses an average of 24.4 km; under oceans it is about 7 km, under mountains up to 70 km. Upper mantle Solid rock that creeps a few centimetres a year. It runs from the base of the crust to 400 km in this model. Transition zone Between 400 and 670 km the mineral olivine is squeezed into denser crystal forms, and wave speeds jump. Lower mantle The largest layer by volume, from 670 km down to the core at 2,891 km. Outer core Liquid iron and nickel, 2,260 km thick. Its flow generates the magnetic field. S waves cannot cross it. Inner core A solid iron ball 1,221 km in radius, hotter than its liquid surroundings but held solid by pressure. Earthquake The source of the waves in this exhibit, placed at the top of the cut so the rays fan out across one face. P waves Push-pull waves. They travel through solid and liquid and are the first to arrive at any seismometer. S waves Side-to-side waves. Liquids cannot carry them, so they stop at the outer core. Shadow zones Blue arc: the P-wave shadow, 104° to 140° from the quake. Green arc: no direct S waves beyond 104°. Depth probe The white ring marks the depth set on the slider. The panel at top left shows the values there. Plate map Bird's PB2002 plates on the globe. Red boundaries spread apart, blue ones converge, green ones slide past. Motion arrows Today's velocity of the ground in the no-net-rotation frame, NNR-MORVEL56. Longer and redder is faster. Tracer towns Eight towns carried by their plates as the plate clock runs. A concept: today's rotation kept fixed. Trench Where the ocean plate bends down. The ocean water is shown only on the sea side. Sinking slab The cold ocean plate going down into the mantle, 90 km thick in this drawing. Volcanic arc Placed where the top of the slab is 105 km deep, the global average under arc volcanoes. Slab earthquakes Earthquakes inside the cold slab, down to about 680 km. An illustration of a Wadati-Benioff zone. Mantle wedge Hot mantle between the slab and the plate above, where water from the slab helps rock melt. Hotspot plume Hot rock rising under Hawaii. In this model it stays still while the plate moves. Island chain Volcanoes from Kama'ehuakanaloa to Meiji. Grey ones are seamounts below the sea. The bend Daikakuji Seamount, 47.5 million years old, where the chain changes direction. Kama'ehuakanaloa A young submarine volcano 975 m below the sea, south-east of the Big Island. Your guess Turn it with the bearing slider to where you think the next island will grow. Ridge axis Where magma rises and new crust forms, the youngest rock on the sea floor. Magnetic stripes Crust that cooled in normal polarity (dark) or reversed polarity (light). Magnetometer trace What a ship towing a magnetometer across the ridge would record, smoothed. Cold slab A sinking ocean plate that can reach the bottom of the mantle. Concept picture. Hot plume Rock rising from the base of the mantle. Concept picture. Hot pile One of two large regions of slow shear waves on the core, under Africa and the Pacific. Field lines The dipole part of IGRF-14, tilted like the real field. Yellow cones show the direction. Outer core Liquid iron whose flow makes the field. The pale spirals are a concept of the flow. North magnetic pole Where a compass needle points straight down. The red line is its track since 1590. Kola hole 12,262 m, the deepest hole, finished in 1989. KTB hole The German continental deep borehole, 9,101 m. Chikyu The drilling ship and its 7,906 m drill pipe at the Japan Trench. Challenger Deep 10,935 m below sea level, the deepest sea floor. Your drill Set by the depth slider. The panel shows pressure and temperature there. Epicentre Where the waves start. Click the globe to move it. Wave fronts Blue P, green S and orange surface waves spreading over the surface. Seismometers Global Seismographic Network stations. The three in yellow record this quake. Your pin Move it with the latitude and longitude sliders, or click the globe.