FIG. 06How It Works
Layers of the Earth: depth and density, interactive model
Nobody has drilled deeper than 12.3 km, yet we know the pressure at the centre to within a few per cent, because earthquakes shine through the planet.
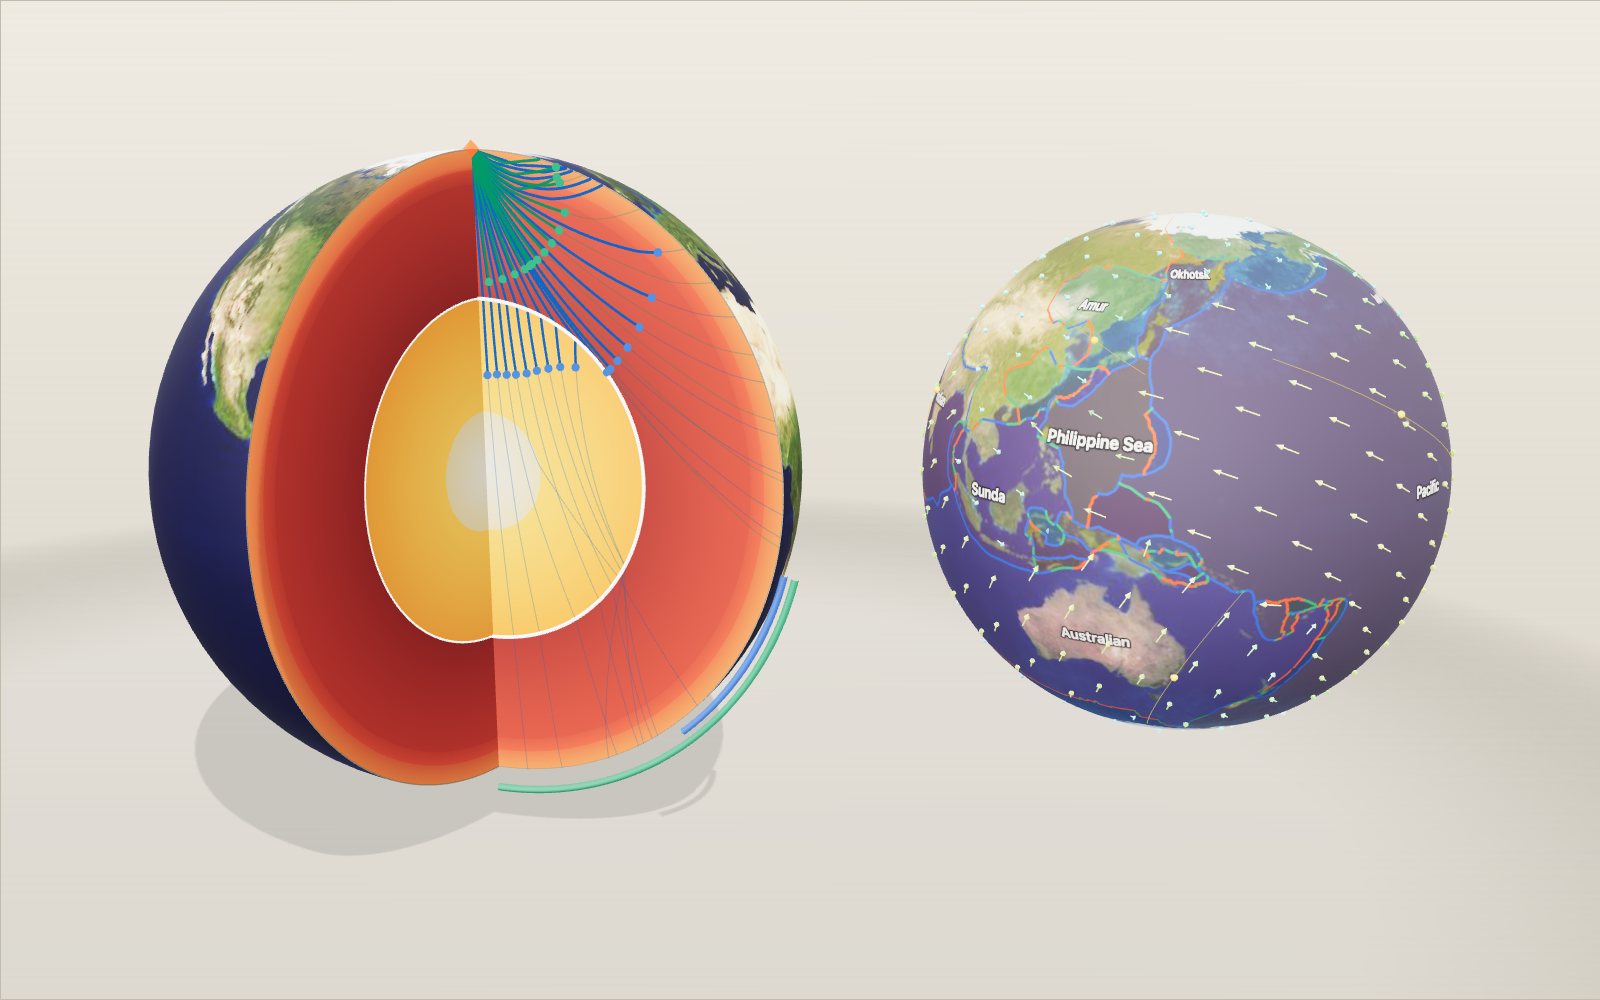
This device cannot show the 3D model. You can read the guide steps below as text.
1 / 20 The Earth cut openA quarter of the planet has been removed so you can see the layers on the two flat faces. Drag to turn it, scroll or pinch to zoom. The bar at the bottom of the stage switches between nine scenes, from this cut-away to plates, the magnetic field and an earthquake lab.
Drag to turn. Scroll or pinch to zoom.
What you are looking at
The model above is the Earth with a wedge cut out of it, drawn to scale. A radius of 6,371 km is shrunk to half a metre on screen, and the layers on the two cut faces sit at the depths given by PREM, the Preliminary Reference Earth Model published by Adam Dziewonski and Don Anderson in 1981. PREM is still the standard reference that seismologists compare their measurements against, and it gives density and wave speed at every depth as a set of simple formulas.
Move the depth slider on the Controls tab and a white ring slides from the surface towards the centre. The panel in the top left corner then reads out what PREM says about that depth: density, the speed of the two kinds of earthquake wave, and the pressure and gravity we calculated from the density. The temperature line is different. It is not part of PREM, so it shows a rounded estimate in degrees Celsius taken from published research, and the section on the core explains how uncertain it is.
Press play and an earthquake goes off at the top of the cut. The coloured lines are the paths its waves take through the planet, traced through the same model, and the dots are the wave fronts moving at the right speed. One second on screen stands for one minute of real time unless you change the wave clock.
Two more controls belong to the cut-away. Peel layers takes the Earth apart from the outside, down to the bare inner core. Graph switches the chart under the readout between density, wave speed, pressure, temperature and gravity, with the probe's depth marked.
The bar along the bottom of the stage opens eight more scenes, each built the first time you choose it. Plates shows the 52 plates of Peter Bird's PB2002 model with today's motion. Subduction cuts through a trench. Hotspot follows the Pacific plate over Hawaii. Ridge spreads a sea floor and records the magnetic field in it. Convection is a concept picture of the mantle turning over. Magnetic field shows the field the liquid core makes and how its north pole has wandered since 1590. Deep holes puts the deepest boreholes and the deepest sea on one board. Quake lab sends waves from a real earthquake to three seismometers and lets you locate it. Under the controls there are eight tasks, 73 cases from the earthquake catalogue and the history of geology, and a fact you can swap for another.
How we know without digging
The deepest hole ever drilled, the Kola Superdeep Borehole in Russia, reached about 12 kilometres. That is about 0.2 per cent of the way to the centre. Everything below comes from indirect evidence, and two pieces of it do most of the work.
The first is the mass of the Earth. Once you know how strongly the planet pulls on things and how big it is, you can work out its average density: a mass of 5.972 × 10²⁴ kg divided by a volume of 4/3·π·(6,371 km)³ gives 5.51 g/cm³. Surface rocks are only 2.6 to 2.9 g/cm³, so something much heavier must be hidden underneath. Isaac Newton had already guessed this in the 1680s.
The second is earthquakes. A large earthquake sends waves through the whole planet, and thousands of seismometers record when they arrive. The arrival times depend on how fast the waves travel at each depth, so collecting enough of them lets seismologists solve for the speed layer by layer. PREM was fitted to about 1,000 measured periods of the Earth's free oscillations (the slow ringing of the whole planet after a great quake), about 500 summary travel times, and the known mass and moment of inertia. The authors then checked it against another 1.75 million P and S arrival times from 12 years of bulletins of the International Seismological Centre.
The crust and the Moho
At this scale the crust is a line. PREM uses an average thickness of 24.4 km, made of 3 km of ocean, 12 km of upper crust and 9.4 km of lower crust. Real crust is far less tidy: about 7 km under the oceans and 30 to 70 km under the continents, thickest under young mountain ranges such as the Himalaya.
The bottom of the crust is a sharp boundary called the Moho, after the Croatian seismologist Andrija Mohorovičić, who found it while studying records of the 1909 earthquake in the Kupa (Kulpa) Valley of Croatia. He noticed that stations far from the quake recorded two sets of P waves, and that the second set had travelled partly through a faster layer below. In PREM the P-wave speed jumps from 6.8 km/s in the lower crust to 8.11 km/s just under the Moho, and density from 2.90 to 3.38 g/cm³.
The mantle: solid rock that flows
The mantle is 2,867 km of rock that is solid enough to carry S waves and still soft enough to creep a few centimetres a year over millions of years. That creep is what moves the tectonic plates above it.
Two steps in wave speed divide it. PREM puts them at 400 km and 670 km; other models use 410 and 660, and both describe the same thing. At these depths the mineral olivine, the main ingredient of the upper mantle, is squeezed into denser crystal structures. Between them lies the transition zone. Below 670 km is the lower mantle, the biggest layer of the planet by volume.
Pressure builds quickly. At the bottom of the crust it is 0.6 GPa, at 400 km 13.4 GPa and at 670 km 23.8 GPa. At the base of the mantle, 2,891 km down, it reaches 135.8 GPa. Divided by the air pressure at sea level (101,325 Pa), that is 135.8 × 10⁹ ÷ 101,325 ≈ 1.34 million times.
The core: liquid outside, solid inside
At 2,891 km the rock stops. The density jumps from 5.57 to 9.90 g/cm³, the P-wave speed falls from 13.72 to 8.06 km/s, and the S-wave speed drops to zero. A material that cannot carry a shear wave cannot resist being sheared, which is another way of saying it is a liquid. This is the outer core, mostly iron with some nickel and a few per cent of lighter elements. Its slow churning is what generates the Earth's magnetic field.
At 5,150 km the iron becomes solid again. The inner core is hotter than the liquid around it, but the melting point of iron rises with pressure, and at 329 GPa the iron there is below its melting point. As the Earth slowly cools, the inner core grows by freezing iron out of the liquid.
Temperatures are the least certain numbers on this page. Published estimates for the top of the outer core run from about 3,000 to 4,500 K. For the inner-core boundary, calculations by Dario Alfè and colleagues give 5,400 to 5,700 K, while the 2013 laboratory experiments of Simone Anzellini and colleagues found that iron melts there at 6,230 ± 500 K. The readout uses values inside those ranges and shows them in degrees Celsius, so 3,900 °C at the core-mantle boundary is 3,900 + 273 = 4,173 K, and 5,500 °C at the inner-core boundary is 5,773 K. Treat them as rounded guesses, which is why they carry the ≈ sign.
Why the waves bend
Earthquake waves behave like light passing through glass of changing thickness. When a wave enters faster rock it bends away from the vertical, and in the mantle the speed keeps rising with depth, so every ray curves and comes back up to the surface.
In a layered sphere the bending follows one rule. Along each ray the quantity
p = r · sin(i) / v
stays the same, where r is the distance from the centre, i is the angle between the ray and the vertical, and v is the wave speed. A ray turns back where r / v falls to p. The exhibit uses this rule to trace every path you see: it chooses a value of p, steps downward through PREM in steps of at most 2 km until the ray turns, and mirrors the path back up. The travel time is added up along the way, which is why the dots arrive at the right moment.
The shadow zones
Follow the P rays outward from the quake and they land further and further away, until the deepest one grazes the top of the core. In our model that ray reaches the surface 99° from the quake after 13.7 minutes. Rays that dive a little deeper enter the core, where the speed drops from 13.72 to 8.06 km/s, and the sudden slowdown bends them sharply. They come out on the far side of the Earth, at 145° or more.
Between those two groups there is a band of the surface where direct P waves are missing: the P-wave shadow zone. Textbooks usually give it as 104° to 140°. The edges are a little blurred in real records because waves also creep around the core's edge, and our simple ray model puts the edges at 99° and 145°.
S waves have no way through the liquid core at all. Beyond about 104° they are missing completely, which is the S-wave shadow zone; in the model the S ray that travels furthest lands at 104.3°. Switch on S waves in the exhibit and you can watch every one of them stop at the core.
In 1936 the Danish seismologist Inge Lehmann noticed weak P waves arriving inside the P shadow zone where there should have been none. She explained them with a smaller, faster core inside the liquid one. In the model, the rays with the smallest p values pass through the inner core and land between 128° and 180°.
Numbers you can check
| Depth | Layer | Density (g/cm³) | P wave (km/s) | S wave (km/s) | Pressure (GPa) | Gravity (m/s²) |
|---|---|---|---|---|---|---|
| 24.4 km | top of mantle | 3.38 | 8.11 | 4.49 | 0.6 | 9.85 |
| 400 km | transition zone | 3.72 | 9.13 | 4.93 | 13.4 | 9.97 |
| 670 km | lower mantle | 4.38 | 10.75 | 5.95 | 23.8 | 10.02 |
| 2,891 km | outer core | 9.90 | 8.06 | 0 | 135.8 | 10.69 |
| 5,150 km | inner core | 12.76 | 11.03 | 3.50 | 329.0 | 4.40 |
| 6,371 km | centre | 13.09 | 11.26 | 3.67 | 364.1 | 0 |
Density and wave speeds come straight from the PREM formulas. Pressure and gravity are worked out from the density alone, in steps of 1 km. First the mass inside each radius is added up shell by shell, which gives the gravity g = G·M(r) / r². Then the pressure is added up from the surface down using the weight of each shell, dP = ρ·g·dr. Two checks show that the arithmetic holds: the total mass comes out at 5.973 × 10²⁴ kg against the measured 5.972 × 10²⁴ kg, and the gravity at the surface at 9.82 m/s².
Gravity behaves in a way many people do not expect. It does not fall steadily as you go down. Because the core is so dense, gravity grows slightly in the mantle and peaks at 10.69 m/s² at the top of the core before dropping to zero at the centre.
Finding an earthquake from three stations
A seismometer far from an earthquake records two separate jolts before the big rolling surface waves arrive. The first is the P wave, the second the S wave. Both left the source at the same moment, but S waves travel at only about 55 % of the P speed in the mantle, so the gap between them grows with distance. Read that gap, the S−P time, and you know how far away the earthquake was.
The Quake lab works this out from the same PREM model as the cut-away. It uses the tau-p method from seismology textbooks: for each ray parameter p it adds up τ(p), the integral of √(η² − p²)/r from the turning point to the surface, where η = r/v. The distance a ray covers is minus the slope of τ against p, and its time is τ + p × distance. This avoids the awkward square-root spike at the turning point, and it gives first-arrival tables for any source depth. For a quake near the surface the tables give:
| Distance | P arrives | S arrives | S − P |
|---|---|---|---|
| 10° (1,112 km) | 141 s | 255 s | 114 s |
| 20° (2,224 km) | 273 s | 500 s | 226 s |
| 30° (3,336 km) | 369 s | 671 s | 301 s |
| 60° (6,671 km) | 607 s | 1,102 s | 495 s |
| 90° (10,007 km) | 779 s | 1,434 s | 655 s |
Close to the source the rule is simple: every second of S − P is about 7.5 km of distance in this model (0.132 s per km over the first degree). Many textbooks round it to 8 km. Further away the waves reach deeper, faster rock and the relation curves, which is why seismologists use tables rather than a single number.
One distance only tells you that the earthquake lies somewhere on a circle around the station. A second station gives a second circle, which crosses the first at two points. A third circle picks one of them. In the lab the three stations are real seismometers of the Global Seismographic Network, chosen so that they lie between 15° and 90° from the quake and spread around it in direction. Switch on the S-P circles and they are drawn on the globe from the S−P times alone. The first task hides the epicentre of a real earthquake and asks you to put a pin where the circles meet.
Depth changes the picture a little. A quake 600 km down sends its P wave to a station 60° away in 549 s instead of 607 s, because the wave starts closer to the fast lower mantle and skips the slow crust on the way down. Deep quakes also make weak surface waves, since the surface waves are trapped near the top of the Earth and the source is far below them. Compare the seismograms of the 2013 Sea of Okhotsk quake (598 km) with Tōhoku (29 km).
The surface waves in the lab travel at one speed, 3.8 km/s. That is a model value: real surface waves spread out, with long periods travelling faster than short ones. At 3.8 km/s they need 2,634 s, about 44 minutes, to cover 90°.
How big is a magnitude 9?
Magnitude is a logarithmic scale. One step up means about ten times the ground motion on a seismometer at the same distance and about 32 times the energy released. The energy relation used here is the one Hiroo Kanamori gave in 1977 from the work of Beno Gutenberg and Charles Richter:
log₁₀ E = 1.5 M + 4.8, with E in joules.
So a magnitude 7 releases 10^(1.5 × 2) = 1,000 times the energy of a magnitude 5, and a magnitude 9 releases 10^(1.5 × 3), about 32,000 times the energy of a magnitude 6. The Tōhoku earthquake of 2011, M 9.1, comes out at 2.8 × 10¹⁸ J. Divided by the energy of a tonne of TNT, 4.184 × 10⁹ J, that is about 674 megatonnes. The Gyeongju earthquake of 2016 (ML 5.8 on the Korea Meteorological Administration scale) released roughly 10^(1.5 × 3.3), about 90,000 times less.
Magnitude says nothing direct about how hard the ground shakes in a given town. That depends on distance, depth, the rock and soil under the town and the way the fault broke. The 1994 Bolivia quake was a magnitude 8.2 but 631 km deep, and its surface waves were small.
Plates and how fast they move
The outer 100 km or so of the Earth, the lithosphere, is cold enough to behave as a set of rigid plates. The Plates scene shows the 52 plates of Peter Bird's 2003 model, PB2002, drawn from the files he published. Its boundaries are coloured by what they do: red where plates move apart at spreading ridges and rifts, blue where they come together at trenches and collision zones, green where they slide past each other along transform faults.
The arrows come from NNR-MORVEL56, published in 2011 by Donald Argus, Richard Gordon and Charles DeMets. It gives each plate an angular velocity: a pole on the globe and a rate of turning about it. The velocity of a point is the cross product of that angular velocity with the point's position, v = ω × r. The frame is "no net rotation", which means that the plates taken together do not turn. Some examples worked out with the model's numbers:
- The Pacific plate turns 0.651° per million years about a pole at 63.58° S, 114.70° E. Points 90° from the pole move 0.651 × 111.19 = 72 mm a year, the fastest anywhere on the large plates.
- At Kīlauea the Pacific plate moves 69 mm a year towards the north-west (298°).
- Across the Mid-Atlantic Ridge at 40° N, North America and Eurasia separate at 22.9 mm a year.
- Across the East Pacific Rise at 20° S, the Pacific and Nazca plates separate at 143 mm a year.
- The Indian plate moves about 56 mm a year in this frame.
Averaged over the whole surface the lithosphere moves at 43.9 mm a year (the root-mean-square figure in the NNR-MORVEL56 paper). Click any point of the globe to read its plate, speed and heading. The fastest numbers belong to small plates near Tonga, which turn quickly about nearby poles.
The plate clock in that scene runs the present rotations backward and forward by up to 50 million years and moves eight towns with their plates. At +50 million years New York and Lisbon end up about 1,100 km further apart than today's 5,423 km, close to 22.9 mm a year for 50 million years. This is labelled a concept on purpose. Real plates change speed and direction, and new boundaries form, so a true reconstruction needs magnetic stripes and hotspot tracks for every period, not today's rotation kept fixed.
Where plates sink
At a trench one plate bends down and slides under another. The Subduction scene is a section through two of them: the Japan Trench, where the Pacific plate goes under north-east Japan (the Okhotsk plate in NNR-MORVEL56), and the Peru-Chile Trench at 36° S, where the Nazca plate goes under South America. The convergence speeds come from the same plate model: about 86 mm a year straight across the Japan Trench, and a relative motion of 74 mm a year between Nazca and South America near Concepción.
The sinking plate, the slab, stays colder than the mantle around it for millions of years, so it can break in earthquakes far deeper than anywhere else. In the USGS catalogue the deepest large earthquakes are in slabs: 598 km under the Sea of Okhotsk in 2013 (M 8.3) and 631 km under Bolivia in 1994 (M 8.2). The drawing marks these deep quakes as dots inside the slab down to about 680 km.
Why do volcanoes stand in a line parallel to the trench? Water bound in the minerals of the slab is squeezed out as it goes deeper, and water lowers the melting point of the hot mantle above. Emily Syracuse and Geoffrey Abers measured the depth of the slab under 839 arc volcanoes in 2006. Under the volcanic front the top of the slab is 105 km deep on average, with a median of 100 km; half of all values lie between 85 and 119 km, and averages over 500 km stretches of arc range from 72 km in the central Aleutians to 173 km in northern Vanuatu. The scene places its volcano where the slab top reaches 105 km. Change the deep dip and the arc moves: at 30° it sits 236 km from the trench, near the middle of the 180 to 275 km that half of the world's arcs show.
Hawaii and the hotspot
In 1963 J. Tuzo Wilson suggested that the Hawaiian Islands formed one after another over a fixed source of magma deep below the moving Pacific plate. The dates bear him out. The oldest rocks of Kaua'i are about 5.0 to 5.5 million years old, those of West Maui finished their main growth about 1.3 million years ago, and Kīlauea is erupting now. Midway, 2,444 km from Kīlauea, sits on volcanoes about 28 million years old.
The Hotspot scene uses these dates to rewind the plate. It keeps the plume still and slides the plate so that the volcano of the chosen age sits over it, filling in between dated volcanoes along the chain. Distances and ages give average rates:
| Volcano | Age | Distance from Kīlauea | Average rate |
|---|---|---|---|
| West Maui | 1.3 million years | 212 km | 163 km per million years |
| Wai'anae (O'ahu) | 3.1 million years | 377 km | 122 km per million years |
| Kaua'i | 5.1 million years | 527 km | 103 km per million years |
| Midway | 28 million years | 2,444 km | 87 km per million years |
A kilometre per million years is the same as a millimetre a year, so these are 87 to 163 mm a year, faster than the 69 mm a year that NNR-MORVEL56 gives the Pacific plate at Kīlauea today. Two things account for most of the difference. The ages are for the end of each volcano's main growth, which is not a sharp moment, and the hotspot itself may drift, so a hotspot frame and the no-net-rotation frame are not the same.
Further north-west the chain bends sharply at Daikakuji Seamount, dated 47.5 million years by John O'Connor and colleagues in 2013, and turns north as the Emperor Seamounts. The Pacific plate changed its direction of motion at that time. Detroit Seamount near the north end is 76 to 82 million years old.
The next volcano is already growing. Kama'ehuakanaloa, called Lō'ihi until 2021, lies 975 m below the sea south-east of the Big Island. The USGS estimates that at 5 m of growth per 1,000 years it would need as much as 200,000 years to reach the surface. The third task asks you to point an arrow at the side where it lies.
Stripes on the sea floor
Iron minerals in hot rock line up with the magnetic field around them, and when the rock cools that direction is locked in. In 1906 Bernard Brunhes found lavas in France magnetised in the opposite direction to the present field, and in 1929 Motonori Matuyama found that young lavas in Japan and Korea pointed one way and older ones the other. The field had reversed.
At a mid-ocean ridge new crust forms all the time and moves away to both sides. So the sea floor becomes a tape recorder: bands of crust magnetised one way, then the other, mirrored on the two sides of the ridge. Ships towing magnetometers found these stripes in the 1950s, and in 1963 Fred Vine and Drummond Matthews explained them with sea-floor spreading and reversals.
The Ridge scene draws the stripes from the polarity timescale of Steven Cande and Dennis Kent (1995). The present normal period, the Brunhes chron, started 0.78 million years ago; the short Jaramillo normal interval lasted from 0.99 to 1.07 million years ago; the Olduvai from 1.77 to 1.95. In the last 5 million years the field reversed 20 times. A stripe's width is its time span multiplied by the half-spreading rate. At 50 mm a year (25 km per million years on each side) the Brunhes stripe reaches 19.5 km from the axis; on the East Pacific Rise, at about 143 mm a year, it reaches about 56 km. The sixth task asks for the rate that puts its edge at 60 km.
The sea floor also gets deeper as it ages, because the plate cools and contracts. Barry Parsons and John Sclater fitted depth = 2,500 + 350 √t metres, t in millions of years, to the North Pacific and North Atlantic in 1977. The scene uses that curve, drawn 15 times deeper so that you can see it.
The mantle turning over
The mantle is solid, yet over millions of years it flows. Cold slabs sink into it at trenches, and some of them can be traced by seismic imaging down to the core. Hot material rises in plumes, and two huge regions where shear waves are slow sit on the core under Africa and under the Pacific. Edward Garnero and Allen McNamara reviewed what is known about these regions in 2008.
The Convection scene is only a concept picture. Its dots follow a smooth flow of three cells so that you can see rock go up in one place and down in another. Real flow is three-dimensional and depends on temperature, composition and the plates themselves. Its time scale is the useful number: at 5 cm a year, a typical plate speed, crossing the 2,867 km of mantle takes about 57 million years.
The magnetic field from the core
Liquid iron flowing in the outer core carries electric currents, and the currents make the Earth's magnetic field. Seen from outside the field looks much like that of a bar magnet. The International Geomagnetic Reference Field, IGRF, describes it with a series of coefficients that the International Association of Geomagnetism and Aeronomy updates every five years. The Magnetic field scene draws the dipole part, the first three coefficients g₁⁰, g₁¹ and h₁¹, of IGRF-14. For 2025 they are −29,350.0, −1,410.3 and 4,545.5 nT. From them:
- the dipole axis is tilted 9.2° from the spin axis, and the geomagnetic north pole is at 80.8° N, 72.8° W;
- the dipole field at the equator is √(g₁⁰² + g₁¹² + h₁¹²) = 29.7 µT, and twice that at the poles;
- in 1900 the same number was 32.2 µT, so the dipole is 7.6 % weaker today.
Click a point on the globe and the scene works out the dipole field there: B = B₀ √(1 + 3 cos² θ), where θ is the angle from the dipole axis, and the dip of a compass needle, tan I = 2 cot θ. The real field differs from the dipole in places, because of the higher-order terms that this scene leaves out.
The red line is the path of the north magnetic pole, the point where a compass needle points straight down, from NOAA's National Centers for Environmental Information. From 1590 to 1900 it comes from the gufm1 field model built from ships' logs, after that from IGRF. In those 435 years the pole wandered about 4,500 km and ended up 2,000 km from where it started. In 1700 it moved about 6 km a year in Arctic Canada; between 2000 and 2011 it moved 55 to 58 km a year towards Siberia; in 2024 it moved 37 km.
The time slider in this scene is shared with the Ridge scene. Move it back past 0.78 million years and the field lines flip: the yellow cones show the direction of the field, and during the reversed Matuyama chron it pointed the other way.
How deep have we drilled?
The Deep holes scene puts the deepest places people have reached on one board, at three scales:
- The Kola Superdeep Borehole in north-western Russia reached 12,262 m in 1989 and is still the deepest hole. The rock at the bottom was 212 °C and flowed into the hole.
- The KTB borehole in Germany reached 9,101 m in 1994, at 265 to 270 °C.
- In 2024 the drilling ship Chikyu ran 7,906 m of drill pipe from the sea surface at the Japan Trench, the deepest scientific ocean drilling.
- The Challenger Deep in the Mariana Trench is the deepest sea floor, 10,935 m (± 6 m) below sea level, measured from pressure on submersible dives in 2020.
- The ocean is 3,682 m deep on average.
- The summit of Mauna Kea is 4,205 m above sea level.
Set the yellow drill to 12 km and the panel reads 0.19 % of the Earth's radius. Switch the scale to the centre and every hole on the board fits inside the top line. Pressure at that depth in PREM is about 0.27 GPa, against 364 GPa at the centre.
What the models leave out
PREM is a one-dimensional model: the same at every point on a sphere of a given radius. The real Earth has continents and oceans, cold slabs of sinking ocean floor and hot plumes, so wave speeds differ by a few per cent from place to place. PREM also includes a slight directional dependence in the upper mantle; we use the averaged, direction-free version. The ray paths in the cut-away ignore waves that reflect off boundaries or travel along them, and the earthquake sits just below the ocean layer so the slow water at the very top does not distort the picture.
The other scenes simplify in their own ways, and the panel says so where it matters:
- The travel-time tables of the Quake lab come from rays through PREM. Just below the Moho, PREM's speed falls slightly with depth, so rays from a shallow source leave a gap of a few degrees where real records show a head wave running along the Moho. The lab bridges gaps of up to 10° with a straight line in time; the core shadow, wider than that, stays empty. Surface waves travel at a single model speed.
- The plate clock keeps today's rotations fixed. It shows how fast plates move, not where the continents really were.
- The subduction section joins a shallow dip and a deep dip with a smooth curve and gives the slab a thickness of 90 km. The trench depth, the shape of the overriding plate and the gap in deep earthquakes in the Chile view are drawn to explain, not measured.
- The Hawaiian rewind holds the hotspot still and moves the plate along the dated volcanoes only.
- The magnetic stripes are perfect blocks; real anomalies are smeared by the way the crust cools and by the width of the zone where new crust forms.
- The convection scene is a picture of an idea, with no time scale.
- The field lines are the dipole part of IGRF only.
A short history
In 1798 Henry Cavendish measured the pull between lead spheres with a torsion balance and found the Earth 5.48 times as dense as water, far denser than surface rock. In 1906 the Irish geologist Richard Dixon Oldham showed that P waves arriving on the far side of the Earth were delayed, and argued that the planet has a central core. In the same year Bernard Brunhes reported lavas magnetised the wrong way round. In 1909 Andrija Mohorovičić found the base of the crust. In 1912 Alfred Wegener argued that the continents had drifted apart. Beno Gutenberg then placed the top of the core at about 2,900 km, close to the modern value of 2,891 km. In 1926 Harold Jeffreys showed from tides and S waves that the core is liquid, and in 1929 Motonori Matuyama dated a reversal of the field. Lehmann's inner core followed in 1936.
The pieces came together in the 1960s. Harry Hess proposed sea-floor spreading in 1962; Vine and Matthews read the magnetic stripes in 1963; Wilson explained Hawaii with a hotspot the same year. In 1981 Dziewonski and Anderson combined decades of seismic data, together with the free oscillations recorded after the great earthquakes of the 1960s, into PREM. Bird's plate boundaries followed in 2003 and NNR-MORVEL56 in 2011.
Questions
How do we know the outer core is liquid?
S waves are shear waves: they move the ground from side to side. Liquids cannot resist shear, so they cannot carry these waves. S waves never arrive on the far side of the core, and the outer core shows an S-wave speed of zero in every model fitted to earthquake data.
Why is the inner core solid if it is hotter?
The temperature at which iron melts rises with pressure. At the inner-core boundary the pressure is 329 GPa, high enough that the melting point is above the actual temperature. Further out the pressure is lower, the melting point is lower, and the iron is liquid.
Is the mantle made of magma?
No. The mantle is solid rock that can flow very slowly, like glacier ice. Magma forms only in small pockets where the rock melts partly, mostly within the top 200 km, for example under mid-ocean ridges and volcanic arcs.
What is the pressure at the centre of the Earth?
About 364 GPa in PREM. Divided by the air pressure at sea level, 364 × 10⁹ ÷ 101,325 ≈ 3.59 million times. The exhibit gets this number by adding up the weight of every 1 km shell from the surface down.
Would you be weightless at the centre?
Yes. The mass around you pulls equally in every direction, so the forces cancel. Gravity is strongest not at the surface but at the top of the core, at 10.69 m/s², because the dense core sits so close.
Why do the layers have exact depths like 2,891 km?
They are the depths where earthquake wave speeds change suddenly. Those changes show up as reflections and bends in the travel times recorded around the world, so the boundaries can be located to within a few kilometres. Inside each layer the properties change smoothly.
How long does a P wave take to reach the far side?
In this model the P wave that runs almost straight through the centre reaches the opposite side of the Earth after about 20.2 minutes. No S wave makes the same trip, because every one of them stops at the liquid outer core.
How do seismologists find where an earthquake was?
Each station's S−P time gives its distance from the quake, from tables like the one above. A circle of that radius around each of three stations crosses the others at one point, the epicentre. In practice hundreds of stations and a computer fit the time and place together, but the idea is the same.
Why are deep earthquakes possible if rock flows at depth?
Below a few tens of kilometres ordinary rock is too hot and too squeezed to break. Earthquakes deeper than about 70 km happen inside cold sinking slabs, which stay cold for millions of years. The deepest large ones in the USGS catalogue are 598 km under the Sea of Okhotsk and 631 km under Bolivia.
How fast do plates move?
In NNR-MORVEL56 the whole lithosphere averages 43.9 mm a year. North America and Eurasia separate by 22.9 mm a year across the Atlantic at 40° N; the Pacific and Nazca plates by 143 mm a year across the East Pacific Rise at 20° S.
Why is Hawaii in the middle of a plate?
Hawaii sits over a hotspot: hot material rising from deep in the mantle melts and feeds volcanoes through the Pacific plate. As the plate moves, each volcano is carried away and a new one starts, so the islands get older towards the north-west.
How often does the magnetic field reverse?
There is no fixed rhythm. In the timescale of Cande and Kent (1995) the field reversed 20 times in the last 5 million years. The present normal period began 780,000 years ago.
Is the north magnetic pole still moving?
Yes. NOAA's track shows it moving 55 to 58 km a year between 2000 and 2011 and 37 km in 2024, from Arctic Canada towards Siberia.
Could we drill to the mantle?
Not yet on land: the Kola hole stopped at 12,262 m when the rock became too hot and soft. Under the oceans the crust is only about 7 km thick, which is why ocean drilling projects aim there.
Terms
PREM: Preliminary Reference Earth Model (1981), a standard table of density and seismic wave speed against depth.
P wave: a compressional wave. It passes through solids and liquids and arrives first.
S wave: a shear wave. It passes only through solids and arrives second.
Moho: the boundary between crust and mantle, where P waves speed up to about 8 km/s.
Transition zone: the part of the mantle between about 400 and 670 km where minerals change to denser forms.
Core-mantle boundary: the rock-to-liquid-iron boundary at 2,891 km.
Shadow zone: a band on the surface where certain waves from a given earthquake do not arrive directly.
Ray parameter: the quantity r·sin(i)/v, which stays the same along a seismic ray in a layered sphere.
GPa: gigapascal, one billion pascals. Air pressure at sea level is 0.000101 GPa.
Epicentre: the point on the surface above the place where an earthquake starts.
S−P time: the delay between the P and S arrivals at a station; it grows with distance.
Magnitude: a logarithmic measure of earthquake size; one step is about 32 times the energy.
Lithosphere: the rigid outer shell, crust and uppermost mantle, broken into plates.
Subduction: one plate sinking under another at a trench.
Slab: the part of a plate that has sunk into the mantle.
Hotspot: a long-lived source of magma beneath a plate, such as the one under Hawaii.
Polarity chron: a period when the magnetic field kept one direction, such as the Brunhes (normal) and Matuyama (reversed).
IGRF: International Geomagnetic Reference Field, the standard model of the main magnetic field.
NNR-MORVEL56: a set of angular velocities for 56 plates in a frame with no net rotation of the lithosphere.
Sources
- IRIS Data Services, Earth Model Collaboration: PREM (model files and reference to Dziewonski and Anderson, 1981). https://ds.iris.edu/ds/products/emc-prem/ (checked 2026-10-15)
- U.S. Geological Survey, This Dynamic Earth: Inside the Earth (crust thickness, the Moho named after Andrija Mohorovičić, the Soviet hole on the Kola Peninsula drilled to about 12 km). https://pubs.usgs.gov/gip/interior/ (checked 2026-10-15)
- NASA Goddard Space Flight Center, Earth Fact Sheet (mass, mean radius, mean density). https://nssdc.gsfc.nasa.gov/planetary/factsheet/earthfact.html (checked 2026-10-15)
- IRIS (Incorporated Research Institutions for Seismology), Seismic Shadow Zone: Basic Introduction (no direct P waves between 104° and 140°, no S waves beyond 104°). https://www.iris.edu/hq/inclass/animation/seismic_shadow_zone_basic_introduction (checked 2026-10-17)
- Dziewonski, A. M. and Anderson, D. L., Preliminary reference Earth model, Physics of the Earth and Planetary Interiors 25 (1981), 297-356 (PDF hosted by the Harvard-Smithsonian Center for Astrophysics). https://www.cfa.harvard.edu/~lzeng/papers/PREM.pdf (checked 2026-10-15)
- D. Alfè, M. J. Gillan and G. D. Price, Temperature and composition of the Earth's core, Contemporary Physics 48 (2007), 63-80 (inner-core boundary probably 5,400 to 5,700 K; the publisher page blocks scripted requests). https://doi.org/10.1080/00107510701529653 (checked 2026-10-17)
- S. Anzellini and others, Melting of iron at Earth's inner core boundary based on fast X-ray diffraction, Science 340 (2013), 464-466, PubMed abstract (6,230 ± 500 K). https://pubmed.ncbi.nlm.nih.gov/23620049/ (checked 2026-10-17)
- F. Deschamps and others, Estimating core-mantle boundary temperature from seismic shear velocity and attenuation, Frontiers in Earth Science 10 (2022) (current estimates from about 3,000 K to 4,500 K). https://www.frontiersin.org/journals/earth-science/articles/10.3389/feart.2022.1031507/full (checked 2026-10-17)
- NASA Visible Earth, Blue Marble collection (public-domain image used, reduced to 1024 × 512, for the surface of the model). https://visibleearth.nasa.gov/collection/1484/blue-marble (checked 2026-10-15)
- Duncan Carr Agnew, History of Seismology, International Handbook of Earthquake and Engineering Seismology, 2002, University of California San Diego (Oldham's core 1906, Gutenberg's core radius close to the modern value, Jeffreys 1926 fluid core, Lehmann 1936 inner core, Mohorovičić and the 1909 Kulpa Valley earthquake). https://igppweb.ucsd.edu/~agnew/Pubs/agnew.a66.pdf (checked 2026-10-17)
- American Physical Society, September 1936: Seismologist Inge Lehmann Concludes That Earth Has an Inner Core. https://www.aps.org/apsnews/2023/08/seismologist-lehmann-earth-inner-core (checked 2026-10-17)
- U.S. Geological Survey, ANSS Comprehensive Earthquake Catalog (ComCat) (epicentres, depths and magnitudes of the 32 non-Korean earthquakes in the case list; each case links its event page). https://earthquake.usgs.gov/fdsnws/event/1/ (checked 2026-10-18)
- Korea Meteorological Administration, 9.12 지진 and 포항지진 (Gyeongju 2016: 35.7610° N, 129.1878° E, ML 5.8, focus about 15 km; Pohang 2017: 36.11° N, 129.37° E, ML 5.4, about 7 km). https://www.weather.go.kr/w/earthquake/archive/major-eqk/912.do (checked 2026-10-18)
- EarthScope Consortium (formerly IRIS), FDSN station web service (coordinates of the 40 Global Seismographic Network stations, networks IU and II). https://service.earthscope.org/fdsnws/station/1/ (checked 2026-10-18)
- H. Kanamori, The energy release in great earthquakes, Journal of Geophysical Research 82 (1977), 2981-2987 (log E = 1.5 M + 4.8 in joules). https://doi.org/10.1029/JB082i020p02981 (checked 2026-10-18)
- U.S. Geological Survey, Earthquake Magnitude, Energy Release, and Shaking Intensity (one magnitude step: about 10 times the amplitude and 32 times the energy). https://www.usgs.gov/programs/earthquake-hazards/earthquake-magnitude-energy-release-and-shaking-intensity (checked 2026-10-18)
- P. Bird, An updated digital model of plate boundaries, Geochemistry, Geophysics, Geosystems 4 (2003), 1027 (52 plates; boundary files PB2002_plates and PB2002_steps). https://doi.org/10.1029/2001GC000252 (checked 2026-10-18)
- D. F. Argus, R. G. Gordon and C. DeMets, Geologically current motion of 56 plates relative to the no-net-rotation reference frame, Geochemistry, Geophysics, Geosystems 12 (2011), Q11001 (Table 1 angular velocities; RMS 43.9 mm a year). https://doi.org/10.1029/2011GC003751 (checked 2026-10-18)
- E. M. Syracuse and G. A. Abers, Global compilation of variations in slab depth beneath arc volcanoes and implications, Geochemistry, Geophysics, Geosystems 7 (2006), Q05017 (839 volcanoes; mean 105 km, median 100 km). https://doi.org/10.1029/2005GC001045 (checked 2026-10-18)
- U.S. Geological Survey, This Dynamic Earth: Hotspots (Kaua'i about 5.5 million years old, ancient Hawaiian observations). https://pubs.usgs.gov/gip/dynamic/hotspots.html (checked 2026-10-18)
- USGS Hawaiian Volcano Observatory, Volcano Watch: Island of Hawaii sits at the end of a long, old chain of 125 volcanoes (Kaua'i 5.0 to 5.5, Midway about 28 million years). https://www.usgs.gov/news/volcano-watch-island-hawaii-sits-end-a-long-old-chain-125-volcanoes (checked 2026-10-18)
- D. A. Clague and D. R. Sherrod, Growth and degradation of Hawaiian volcanoes, USGS Professional Paper 1801, chapter 3 (2014) (Table 1 summit positions and heights; West Maui, West Moloka'i and Wai'anae ages). https://pubs.usgs.gov/pp/1801/downloads/pp1801_Chap3_Clague.pdf (checked 2026-10-18)
- J. M. O'Connor and others, Constraints on past plate and mantle motion from new ages for the Hawaiian-Emperor Seamount Chain, Geochemistry, Geophysics, Geosystems 14 (2013), 4564-4584 (bend 47.5 million years, Detroit 76 to 82). https://doi.org/10.1002/ggge.20267 (checked 2026-10-18)
- U.S. Geological Survey, Kama'ehuakanaloa (975 m below the sea; up to 200,000 years to reach the surface at 5 m per 1,000 years). https://www.usgs.gov/volcanoes/kama%E2%80%98ehuakanaloa (checked 2026-10-18)
- J. T. Wilson, A possible origin of the Hawaiian Islands, Canadian Journal of Physics 41 (1963), 863-870. https://doi.org/10.1139/p63-094 (checked 2026-10-18)
- S. C. Cande and D. V. Kent, Revised calibration of the geomagnetic polarity timescale for the Late Cretaceous and Cenozoic, Journal of Geophysical Research 100 (1995), 6093-6095 (table of normal intervals as published by the WHOI Deep Tow group). https://website.whoi.edu/deeptow/research/jurassic-magnetism/jurassic-magnetism-1992-survey/the-geomagnetic-polarity-time-scale-gpts/table-of-ages-for-cande-and-kent-gpts/ (checked 2026-10-18)
- F. J. Vine and D. H. Matthews, Magnetic anomalies over oceanic ridges, Nature 199 (1963), 947-949. https://doi.org/10.1038/199947a0 (checked 2026-10-18)
- B. Parsons and J. G. Sclater, An analysis of the variation of ocean floor bathymetry and heat flow with age, Journal of Geophysical Research 82 (1977), 803-827 (depth = 2,500 + 350 √t m). https://doi.org/10.1029/JB082i005p00803 (checked 2026-10-18)
- U.S. Geological Survey, This Dynamic Earth: Developing the theory (Hess and sea-floor spreading, magnetic stripes). https://pubs.usgs.gov/gip/dynamic/developing.html (checked 2026-10-18)
- E. J. Garnero and A. K. McNamara, Structure and dynamics of Earth's lower mantle, Science 320 (2008), 626-628 (the two large regions of slow shear waves under Africa and the Pacific). https://doi.org/10.1126/science.1148028 (checked 2026-10-18)
- IAGA, International Geomagnetic Reference Field, 14th generation, coefficient file at NOAA NCEI (g₁⁰, g₁¹, h₁¹ for 1900 to 2025). https://www.ngdc.noaa.gov/IAGA/vmod/coeffs/igrf14coeffs.txt (checked 2026-10-18)
- NOAA National Centers for Environmental Information, Wandering of the Geomagnetic Poles (north dip pole positions 1590 to 2025). https://www.ncei.noaa.gov/products/wandering-geomagnetic-poles (checked 2026-10-18)
- B. Brunhes, Recherches sur la direction d'aimantation des roches volcaniques, Journal de Physique Théorique et Appliquée 5 (1906), 705-724. https://doi.org/10.1051/jphystap:019060050070500 (checked 2026-10-18)
- M. Matuyama, On the direction of magnetisation of basalt in Japan, Tyosen and Manchuria, Proceedings of the Imperial Academy 5 (1929), 203-205. https://doi.org/10.2183/pjab1912.5.203 (checked 2026-10-18)
- H. Cavendish, Experiments to determine the density of the Earth, Philosophical Transactions of the Royal Society 88 (1798), 469-526. https://doi.org/10.1098/rstl.1798.0022 (checked 2026-10-18)
- A. Wegener, Die Entstehung der Kontinente, Geologische Rundschau 3 (1912), 276-292. https://doi.org/10.1007/BF02202896 (checked 2026-10-18)
- Ultradeep drilling beyond 10 km revealing new insights into Earth systems and resources, Communications Earth & Environment (2026) (Kola 12,262 m and 212 °C; KTB 9,101 m and 265 to 270 °C). https://www.nature.com/articles/s43247-026-03246-z (checked 2026-10-18)
- JAMSTEC, Deepest scientific ocean drilling Guinness World Records certification, press release 2025-09-24 (Chikyu, 7,906 m of drill pipe, IODP Expedition 405). https://www.jamstec.go.jp/e/about/press_release/20250924 (checked 2026-10-18)
- S. F. Greenaway and others, Revised depth of the Challenger Deep from submersible transects, Deep-Sea Research I 178 (2021), 103644, NOAA repository (10,935 m ± 6 m). https://repository.library.noaa.gov/view/noaa/33477 (checked 2026-10-18)
- NOAA National Ocean Service, How deep is the ocean? (mean depth 3,682 m). https://oceanservice.noaa.gov/facts/oceandepth.html (checked 2026-10-18)
- Calculations on this page: PREM isotropic polynomials; mass, gravity and pressure integrated in 1 km shells; seismic rays traced with the ray parameter p = r·sin(i)/v; travel-time tables by the tau-p method; plate velocities v = ω × r from NNR-MORVEL56; great-circle distances on a sphere of radius 6,371 km; dipole numbers from the IGRF-14 coefficients.
More exhibits
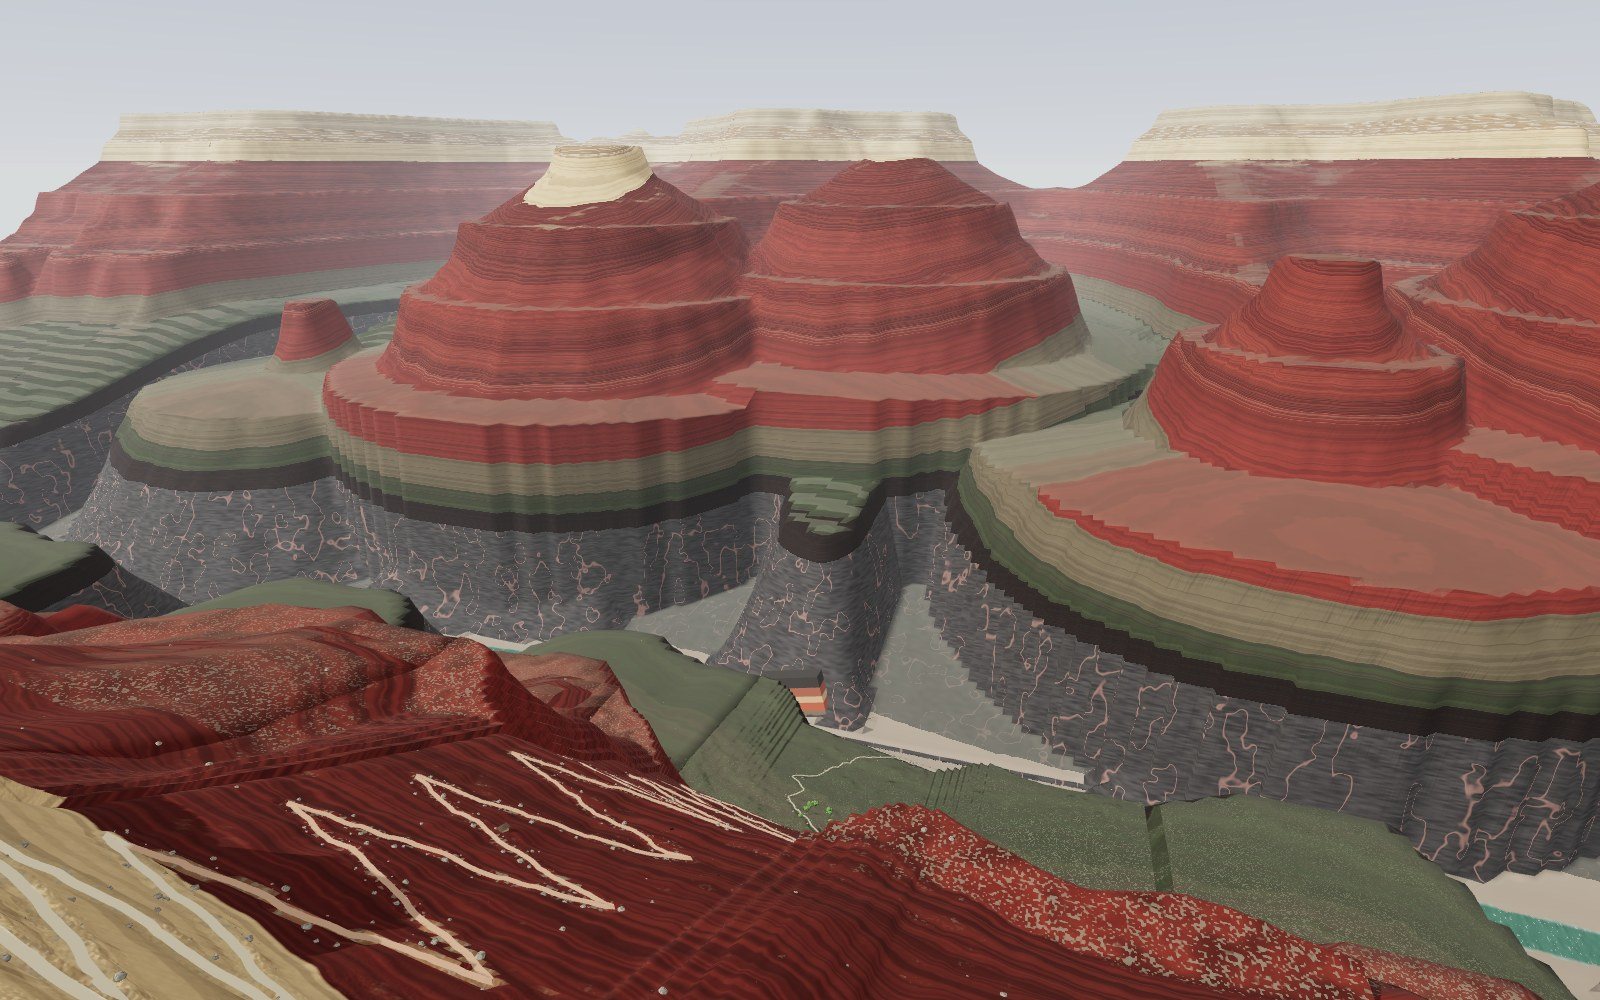
Walk down the Grand Canyon rock layers
Walk 1,360 m down the Bright Angel Trail through 13 rock layers, from a 270-million-year-old sea floor on the rim to 1.75-billion-year-old schist by the river.
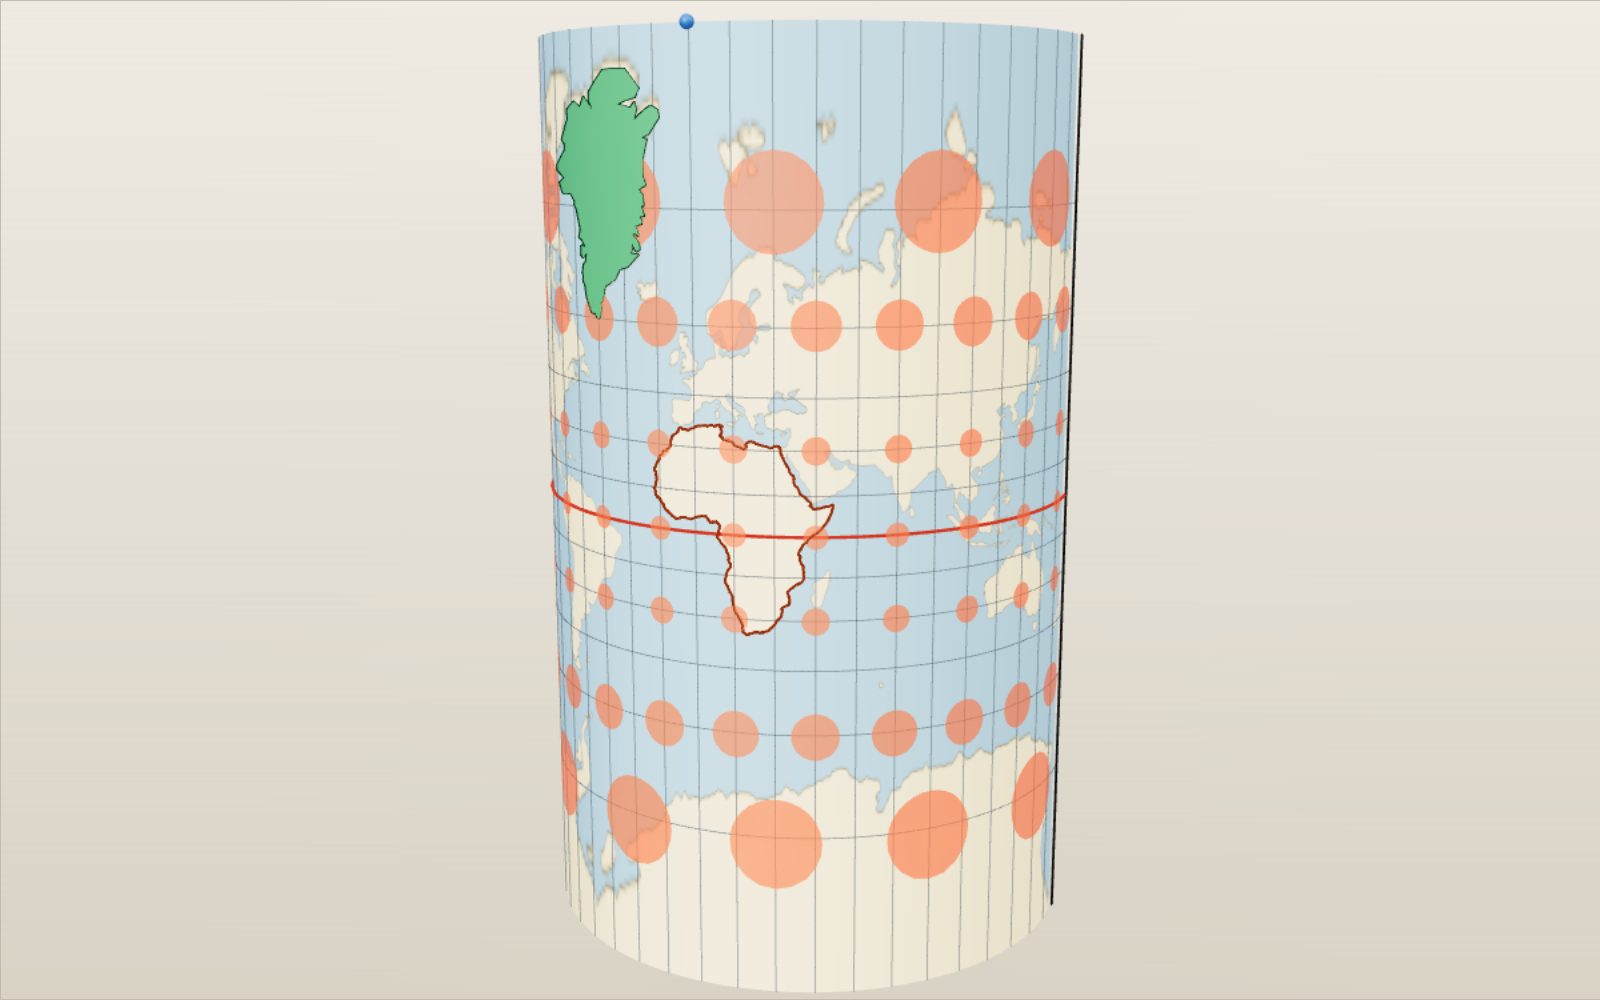
Map projections: why Greenland looks as big as Africa
On a Mercator map Greenland looks bigger than Africa, which is in fact about 14 times larger.
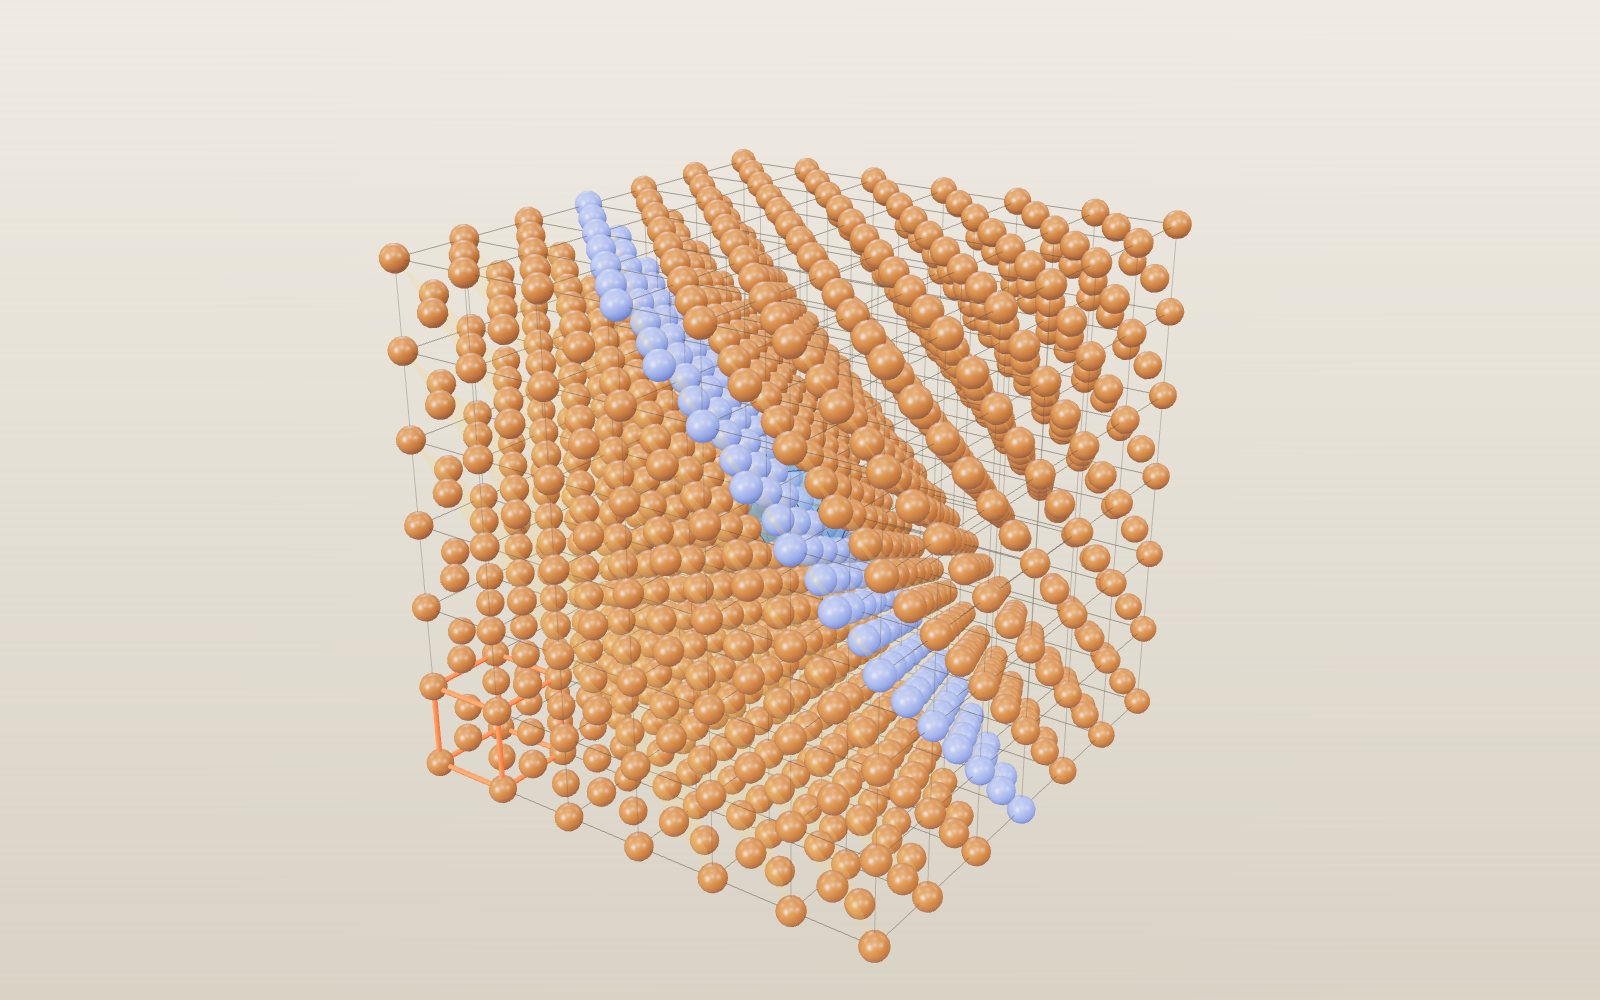
Why salt forms cubes: crystal structure and unit cells
A grain of table salt is a stack of cubes 0.564 nm on a side, with sodium and chlorine alternating along every edge.
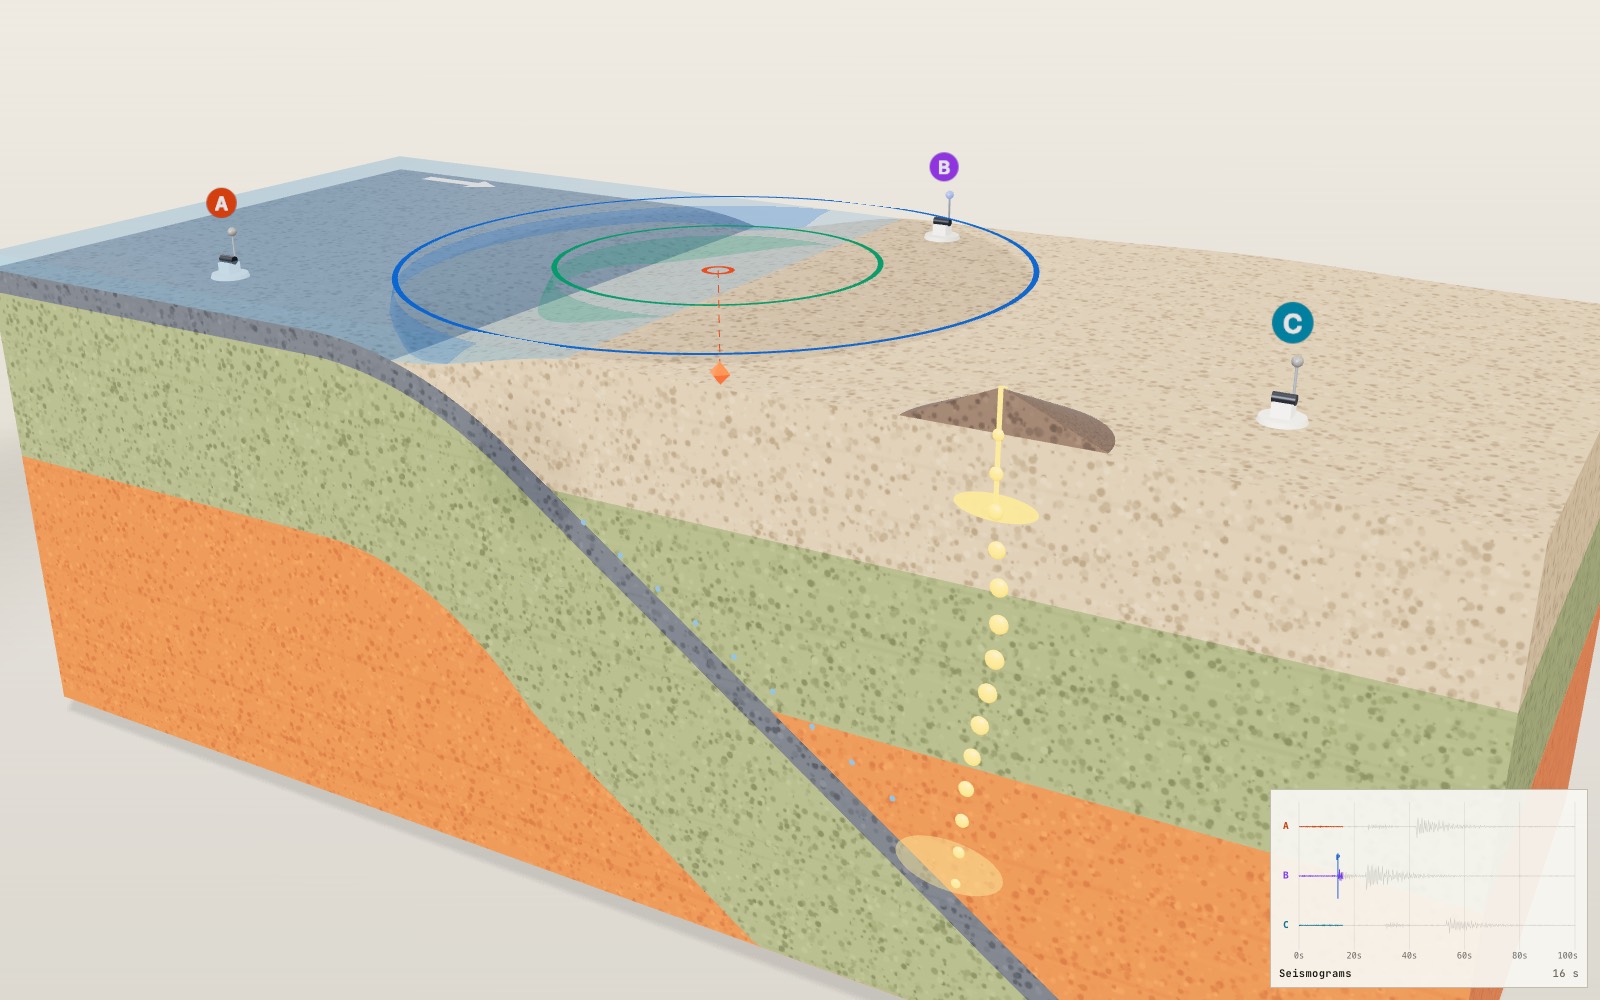
Where volcanoes and earthquakes happen
For each second between the P wave and the S wave, the earthquake is roughly 8 km farther from the seismometer.
How lightning and thunder work
A lightning channel heats the air to about five times the temperature of the Sun’s surface, and its thunder needs about 3 seconds to cover each kilometre to you.
Walk through Machu Picchu
Most of the work that holds Machu Picchu on its ridge, 60 per cent by one estimate, lies under the ground in foundations and drains nobody sees.