FIG. 37How It Works
Where volcanoes and earthquakes happen
For each second between the P wave and the S wave, the earthquake is roughly 8 km farther from the seismometer.
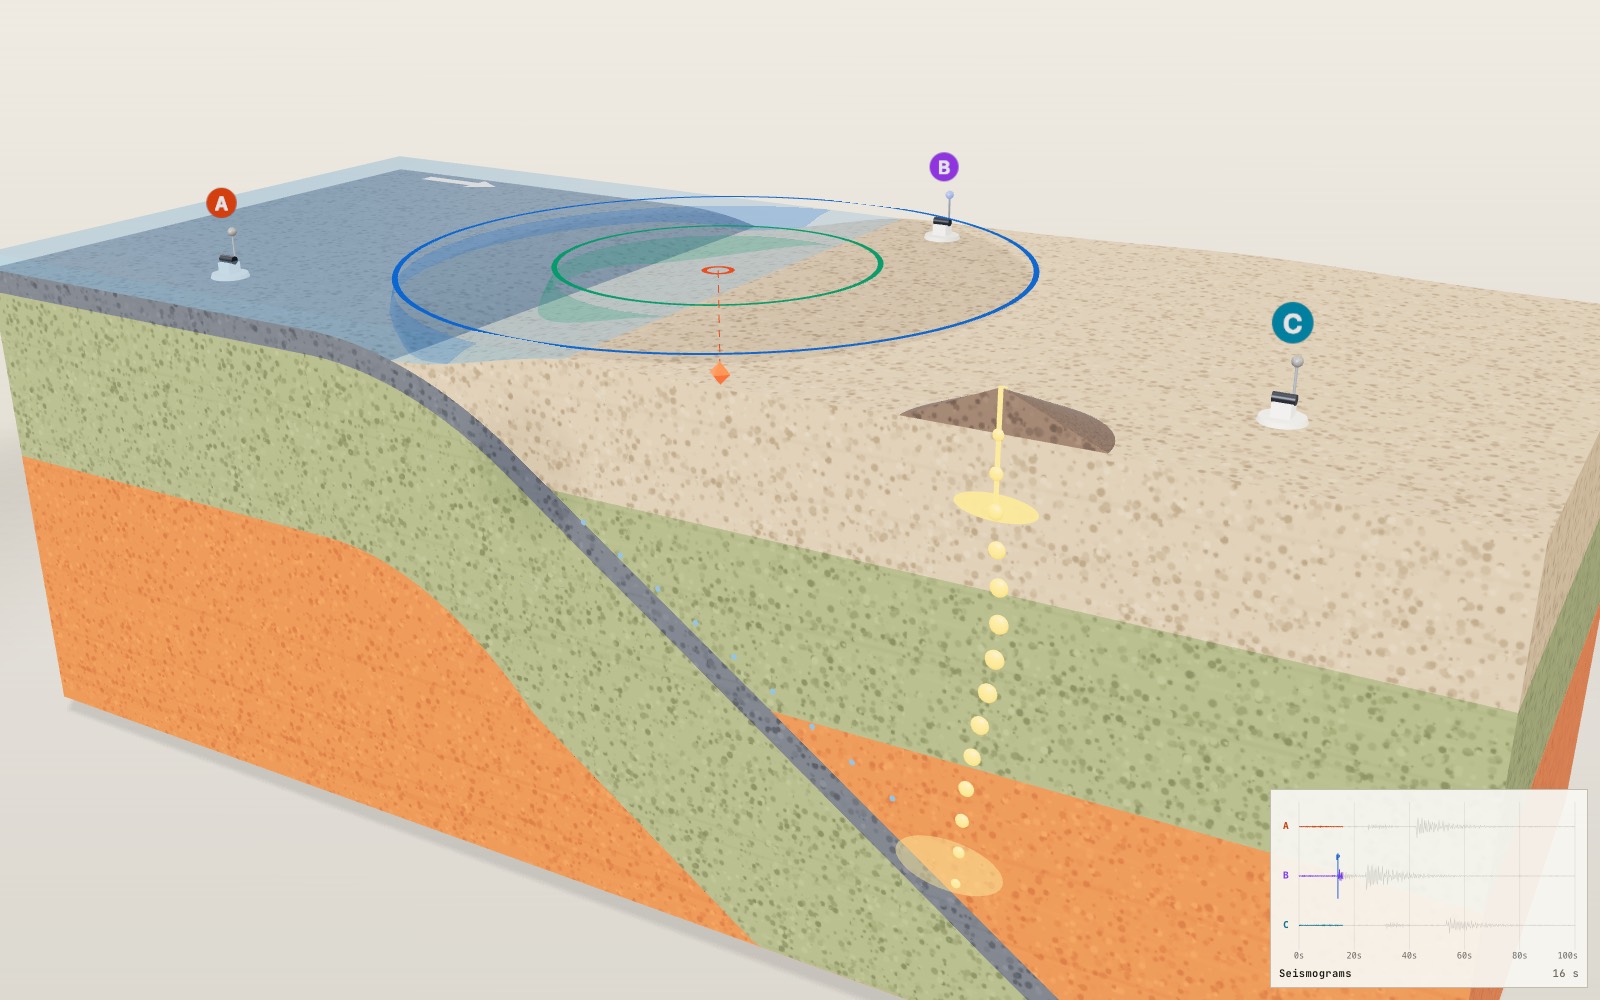
This device cannot show the 3D model. You can read the guide steps below as text.
1 / 8 A slice through the platesThe block is 440 km wide and 150 km deep, drawn at true scale, so the ocean is a thin film of water. The Boundary slider on the Controls tab switches between the three kinds of plate boundary and moves the quake to a typical spot on each. This one is a mid-ocean ridge, where two plates move apart.
Drag to turn. Scroll or pinch to zoom.
What the block shows
Why do volcanoes line up along some coasts while other places shake but never erupt? Most of the answer is in the edges of the plates, the slabs of rock that make up the outer shell of the Earth. The model above cuts a block out of that shell and lets you switch between the three kinds of edge.
The block is 440 km from west to east, 180 km from north to south and 150 km deep. It is drawn at true scale, with one unit on screen standing for 200 km in every direction, so the ocean is only a thin film of water on top and the crust is a narrow band. The volcano, fence posts, stations and slip on the transform fault are enlarged for visibility.
Press play and the model runs a short cycle. The plates move, an earthquake goes off at the red marker, and its waves spread out to three seismic stations on the surface. The panel at the top left gives the magnitude, the energy and the time since the quake. The seismograms at the bottom right record what each station feels. Once every station has felt the S wave, coloured circles appear on the surface and show where the quake must have been.
Why plates pull apart at a ridge
Set the Boundary slider to Divergent and you get a mid-ocean ridge. Two plates move away from each other, and hot mantle rock rises from below to fill the gap. Rock that rises loses pressure faster than it loses heat, and some of it melts. The melt collects in a thin lens a few kilometres under the sea floor, erupts as lava on the ridge and cools into new oceanic crust about 7 km thick.
The new plate is hot and thin at the ridge. As it moves away it cools and grows thicker, which is why the green layer in the model widens towards both ends. Cooling also makes the rock denser, so the sea floor sinks: the model has a 2.5 km background ridge depth plus a 1 km axial valley, so the centre is 3.5 km deep; the edges of the block are 5 km deep.
Spreading is slow. The U.S. Geological Survey gives the Mid-Atlantic Ridge an average of about 2.5 cm a year, or 25 km in a million years. The East Pacific Rise near Easter Island spreads at more than 15 cm a year. Earthquakes at ridges are shallow, because the rock only a few kilometres down is already too hot to break.
Where one plate dives under another
Move the slider to Convergent. Now an ocean plate on the left meets a continent on the right. Old ocean plate is cold and dense, while continental crust is thick and light, so the ocean plate bends down at a trench and sinks into the mantle. This is a subduction zone. In the model the slab bends smoothly over 70 km and then goes down at a steady 35°.
The plates do not slide past each other smoothly. The top of the sinking plate sticks to the plate above, strain builds up, and the contact breaks in earthquakes. Some of the largest earthquakes ever recorded happened on subduction zones. Deeper down the slab keeps producing earthquakes inside itself, so seismologists can trace its shape by plotting where the quakes occur. That sloping band of earthquakes is called the Wadati-Benioff zone and can reach about 670 km deep. The USGS classes earthquakes from the surface to 70 km as shallow, 70 to 300 km as intermediate, and deeper ones as deep.
How a sinking plate makes a volcano
A subducting plate does not melt simply because it gets hotter. What it brings down is water. Sea water soaks into the ocean crust and reacts with its minerals, locking the water inside crystals such as serpentine. As the slab goes deeper, those minerals break down and release the water. It rises into the hot mantle wedge above the slab, and water lowers the temperature at which rock starts to melt. Geologists call this flux melting.
The magma is lighter than the rock around it, so it rises through the mantle wedge and the crust, pools in a magma chamber and erupts at the surface. The volcanoes form a line, a volcanic arc, parallel to the trench. Textbooks put the arc above the point where the slab is roughly 120 km deep, although a global study found depths from about 65 to 130 km, varying from one arc to another. The model uses 120 km. With a 35° dip the slab gets that deep about 170 km from the trench, and that is where the half volcano stands. The Andes and the Cascades formed this way.
Why a transform fault sticks and then slips
The third setting is Transform. Here the plates slide sideways past each other along a vertical fault. Crust is neither made nor destroyed, so there are no volcanoes, but there are plenty of earthquakes. The San Andreas fault in California is the famous example. The USGS describes it as about 1,300 km long, with the Pacific Plate grinding past the North American Plate at an average of about 5 cm a year.
Far from the fault the plates move all the time. Close to the fault, friction holds the two sides together. So the rock in between bends, like the fences in the model. You can watch them curve as the cycle runs. When the stored strain becomes larger than the friction can hold, the fault slips all at once, the bent rock springs back, and each fence ends up as two straight pieces offset across the fault. The energy released in that snap is the earthquake.
This idea is called elastic rebound. Harry Fielding Reid proposed it after the 1906 San Francisco earthquake, after studying how the ground along the San Andreas fault had moved in the 50 years before the shock. GPS measurements made since then largely support it. In the model the slip is exaggerated many thousands of times. A large earthquake moves a fault by metres, which would be far thinner than a pixel at this scale.
P waves and S waves
When the fault breaks, two kinds of wave travel out through the rock. The P wave squeezes and stretches the rock along its direction of travel, like a push down a line of people. The S wave shakes the rock from side to side. P waves are faster and always arrive first, which is where the letters come from: primary and secondary.
The model uses one speed for each wave everywhere: 6.0 km/s for P and 3.5 km/s for S. These are typical values for the upper crust. Switch on See inside and you can watch the two wave fronts grow as spheres under the ground. The coloured rings on the surface mark where each sphere has reached the ground.
Finding the distance from the S-P time
A station knows when each wave arrived, but not when the earthquake happened. It can still work out how far away the quake is, because the gap between the two arrivals grows with distance. If the distance to the hypocentre is d, then
- P arrival: t_P = d / v_P
- S arrival: t_S = d / v_S
- S-P time: t_S - t_P = d (1/v_S - 1/v_P)
Turn the last line around and you get d = (S-P time) × v_P·v_S / (v_P - v_S). With the speeds used here, 6.0 × 3.5 / (6.0 - 3.5) = 21 / 2.5 = 8.4 km/s. So each second of S-P time means 8.4 km of distance. School textbooks and field geologists round this to 8 km/s. Our stations use the rounded value on purpose, so you can see what it costs: the distances come out 5 per cent short.
The factor depends on the rock. If the S wave is 1/√3 of the P speed, a common assumption, the factor is 8.2 km/s for a P speed of 6.0 km/s. Real seismology goes further. It uses travel-time tables built from layered Earth models rather than one speed, because waves speed up with depth and some of them take faster paths through the mantle.
The distance found this way is the distance to the hypocentre, the point underground where the rupture started. For a shallow quake it is close to the distance to the epicentre, the point on the surface directly above.
Three circles find the epicentre
One station gives a distance but no direction. The quake could be anywhere on a circle around it. Two stations narrow it to two points. Three stations settle it.
The model draws the circles the way they are drawn on paper: the radius is the distance to the hypocentre. Because the quake is underground, the circles overlap rather than meeting at one point. For each pair of circles, draw the straight line through their two crossing points, their common chord. The three common chords meet at a single point, and that point is the epicentre. This works exactly when the distances are right, because each squared radius exceeds the squared horizontal distance by the same amount, depth². The radii themselves do not share a constant excess. Once you know the epicentre, the depth follows from Pythagoras: depth² = d² - r², where r is the station's distance from the epicentre.
With the 8 km/s rule the circles are a little too small, so the black cross lands a few kilometres away from the red ring, and the depth may not come out at all. The readout shows both the error and the depth estimate as you move the quake.
Magnitude and intensity are different numbers
The magnitude slider changes one number for the whole earthquake. Magnitude describes how much energy the rupture released, and it is the same wherever you measure it. The scale is logarithmic: one step up in magnitude means about 31.6 times more energy, and two steps mean 1,000 times. Gutenberg and Richter estimated radiated energy as log₁₀ E ≈ 4.8 + 1.5 M, with E in joules. For M 5.8 that gives 10^13.5, about 3.2 × 10¹³ J.
Intensity is different. It describes how strongly the ground shook at one place, judged from what people felt and what was damaged. The same earthquake gives a high intensity near the epicentre and a low one far away, and soft ground can shake more than rock nearby. Korea reports intensity on the Modified Mercalli scale, written in Roman numerals from I to XII. In the model you can see the idea in the seismograms: the station closest to the quake records the largest swing. The swing is only a rough relative size. It falls with distance and grows with magnitude, but it is not a real intensity calculation.
The 2016 Gyeongju and 2017 Pohang earthquakes
Korea sits inside the Eurasian Plate, far from any plate boundary, but stress from the surrounding plates still reaches its faults. According to the Korea Meteorological Administration (KMA), the 12 September 2016 Gyeongju earthquake struck at 20:32:54 KST, 8.7 km south-southwest of Gyeongju, at a depth of around 15 km. Its magnitude was 5.8, the largest since the KMA began earthquake reporting in 1978. A magnitude 5.1 foreshock came at 19:44:32 the same evening. The maximum intensity was VI. The KMA thinks the cause was horizontal slip on a fault in the Yangsan fault zone, the same strike-slip motion as the transform setting in this model.
The Pohang earthquake of 15 November 2017 struck at 14:29:31 KST, 8 km north of Buk-gu, Pohang, at a depth of about 7 km. Its magnitude was 5.4, the second largest since 1978, and its maximum intensity was also VI. The two quakes differ by 0.4 in magnitude, which means 10^(1.5 × 0.4) ≈ 4 times more energy for Gyeongju, yet both reached the same top intensity. Intensity depends on depth, distance and ground, not only on the energy released.
Numbers you can check
Take the transform setting with the quake 20 km west of the centre at a depth of 12 km. Station B is at 20 km east and 70 km north, so the distance to the hypocentre is √(40² + 70² + 12²) = 81.5 km.
| Station A | Station B | Station C | |
|---|---|---|---|
| Distance to hypocentre | 143.7 km | 81.5 km | 187.2 km |
| P arrival (d / 6.0) | 23.95 s | 13.59 s | 31.20 s |
| S arrival (d / 3.5) | 41.05 s | 23.29 s | 53.49 s |
| S-P time | 17.10 s | 9.70 s | 22.29 s |
| × 8 km/s | 136.8 km | 77.6 km | 178.3 km |
| × 8.4 km/s | 143.7 km | 81.5 km | 187.2 km |
With the 8.4 km/s distances the common chords meet exactly at the true epicentre, and the depth comes out as 12 km. With the 8 km/s distances they meet 8.5 km away, and the circles are too small to give a depth.
Other checks: a station 100 km away sees the P wave after 16.7 s and the S wave after 28.6 s, an S-P time of 11.9 s. Times 8 gives 95 km. The energy ratio for one magnitude step is 10^1.5 = 31.6, and an increase of 0.2 nearly doubles the energy (10^0.3 = 2.0).
What the model leaves out
- Wave speeds are the same everywhere. Real waves speed up with depth and bend, so real locations use travel-time tables.
- The circles are flat and the stations sit at sea level. Real location programs fit arrival times from dozens of stations at once.
- The three boundaries are separate. On the real Earth, transform faults usually link pieces of ridge, and plates meet at many angles.
- The volcano, the fences and the fault slip are drawn larger than life. Everything else is at true scale.
- Melting is shown as a path on the front face. Real magma moves through cracks and porous rock over thousands of years.
From fault area to moment magnitude
The magnitude control does not change the size of the drawn fault. To connect its number to a physical rupture, seismologists use seismic moment, M₀ = μ A D. Here μ is the shear modulus, a measure of rock rigidity in pascals; A is the area of fault that slipped in square metres; and D is average slip in metres. The resulting unit is N m. Although that has the same dimensions as a joule, seismic moment is not the energy radiated as seismic waves. Much of the work during rupture goes into frictional heating and breaking rock.
For an assumed example, take μ = 30 billion Pa, a fault patch 10 km long and 8 km wide, and average slip of 0.5 m. First convert the area: 10,000 × 8,000 = 80,000,000 m². Then M₀ = 30 × 10⁹ × 80 × 10⁶ × 0.5 = 1.2 × 10¹⁸ N m. USGS gives the moment-magnitude relation as Mw = (2/3)[log₁₀(M₀) − 9.1] when moment is in N m. Substitution gives Mw ≈ (2/3)(18.079 − 9.1) ≈ 5.99, or about 6.0. The constant would be 16.1 if moment were expressed in dyne cm, so copying the equation without its units would give a very wrong answer.
Doubling just the slip doubles the moment but raises Mw by only (2/3) log₁₀ 2 ≈ 0.20. Doubling both fault length and width multiplies area by 4 and adds about 0.40. Increasing all three dimensions of this rupture example by a factor of 2 multiplies moment by 8 and adds about 0.60. A magnitude step of 1 requires a moment ratio of 10^1.5 ≈ 31.6. That ratio also appears in the approximate radiated-energy relation used by the display, but it does not make moment and energy interchangeable measurements.
The Gyeongju and Pohang numbers quoted above are KMA catalogue magnitudes; they should not be silently relabelled Mw. Different magnitude methods measure different portions of the signal. A magnitude is intended to describe the source rather than the observer's position, but estimates can differ between agencies and can be revised as more data arrive. Nor does a tenfold amplitude rule guarantee ten times the shaking of every building. Instrument response, wave period and local ground all matter.
What a VEI number measures
A volcano does not have an earthquake magnitude for its eruption. The Volcanic Explosivity Index (VEI), introduced by Chris Newhall and Steve Self in 1982, compares explosive eruptions using erupted fragment volume together with plume observations and other evidence. The fragments, collectively called tephra, include ash and larger pieces. This is a volume of loose erupted material, not simply the volume of a solid underground magma chamber.
Useful lower volume thresholds are 0.1 km³ for VEI 4, 1 km³ for VEI 5 and 10 km³ for VEI 6. One cubic kilometre is 1 billion m³. If that volume were spread uniformly over 1,000 km², it would make a layer 1 m thick. That is an arithmetic illustration, not a predicted ash map: wind sorts particles, deposits thin with distance, and valleys do not collect ash evenly. From VEI 2 upward, successive volume categories generally differ by a factor of 10, not the roughly 32-fold energy ratio of an earthquake magnitude step. The lowest categories have different spacing.
USGS uses the 1980 Mount St. Helens eruption as a VEI 5 example and the 1991 Pinatubo eruption as VEI 6. These are not exact volume readings encoded by a single integer. Eruption duration matters too: Parícutin ejected about 1.3 km³ of ash and fragments over 9 years but is assigned VEI 4, because that prolonged activity was not one violently explosive event. Plume height alone is also insufficient because water content and atmospheric conditions affect its rise.
VEI is not a local danger score. A low-VEI lava flow can destroy a settlement in its path. A larger explosive eruption can send ash far beyond the cone, while hot mixtures of gas and fragments threaten nearby slopes. The half volcano in this exhibit explains the route from slab water to magma; it has no VEI control, ash-dispersal calculation or evacuation map. Its cone size cannot be read as a forecast of the next eruption.
Tohoku and Pinatubo at different scales
On 11 March 2011, the Tohoku earthquake ruptured a subduction boundary off northeastern Japan. JMA's event summary reports magnitude 9.0, a depth of 24 km and a reverse-fault mechanism. It records a maximum JMA intensity of 7. That 7 belongs to Japan's intensity scale, not the twelve-level Modified Mercalli scale used in the Korean discussion. Matching the digits of two intensity scales is not a valid comparison.
The convergent view helps explain the setting: a plate interface can remain locked while surrounding rock deforms, then slip in a large rupture. But the red point is only the initiation point. A real great earthquake spreads along a fault surface; its source is not a mathematical point that releases everything instantly. Seafloor displacement can also generate a tsunami, which travels as a water wave rather than as the green S-wave sphere. This exhibit has no tsunami calculation. A wavefront reaching a station on the block does not indicate a tsunami arrival at a coast.
Pinatubo shows a different way that a local event can have distant effects. The climactic eruption occurred on 15 June 1991 in the Philippines. USGS reports nearly 20 million tons of sulfur dioxide injected into the stratosphere and temporary global cooling of about 0.5°C. The gas forms sulfate aerosol droplets that scatter sunlight; the long-lived climate effect is not simply ash making the sky dark. Parker and colleagues found surface cooling of up to 0.5°C for some months in mid-1992, with effects less evident by 1994. That timing matters: it was a temporary perturbation, not a permanent reduction of the planet's temperature.
These examples also separate measurements from consequences. Tohoku's magnitude describes its earthquake source, while the tsunami depends on seafloor motion and water depth. Pinatubo's VEI describes an explosive eruption, while its cooling depends strongly on the sulfur reaching the stratosphere. Neither a magnitude nor a VEI value alone specifies casualties, building damage or climate response. The model's controls isolate mechanisms; a real event combines them with geography and vulnerable communities.
How an alert can beat the shaking
Earthquake early warning detects a rupture that has already begun. It does not predict the date of a future earthquake. KMA describes using the faster P wave to warn before the more damaging shaking arrives. USGS ShakeAlert similarly combines sensor data to estimate the source and expected shaking, then passes information to alert-delivery partners. Communication signals travel much faster than seismic waves, but recording enough data and delivering a message still consume time.
Use the model's speeds for an assumed timing budget. A detecting station 20 km from the hypocentre receives P after 20/6 ≈ 3.3 s. Suppose processing and message delivery then take another 4 s. An alert reaches the user about 7.3 s after origin time. A user 100 km from the hypocentre receives the model S wave after 100/3.5 ≈ 28.6 s, leaving about 21.3 s between the alert and S arrival. The assumed 4 s is not a promise about KMA, ShakeAlert or a phone network.
For a user only 15 km from that same source, S arrives after about 4.3 s, before the example alert is ready. This is the near-source warning limitation: an operating system can still give no advance notice to people nearest the rupture. Larger sources also take time to grow, so an initial magnitude estimate may not represent the final rupture. JMA reports issuing its Tohoku warning 8.6 s after the first P-wave detection at the nearest station. That is a detection-to-issue interval, not a guarantee that every resident had 8.6 s of warning.
The distance circles in this exhibit wait for S arrivals because they demonstrate the S-P location method. A real warning system cannot wait for the damaging wave to reach every threatened location before deciding to alert. The classroom circle construction and rapid operational warning solve related but different problems. Follow current local emergency guidance when an alert arrives; this display is not an emergency information service.
Experiments with the controls
For a distance experiment, select Transform with Boundary, set Epicentre east-west to −20 km and Focal depth to 12 km, and enable Distance circles. After play has carried the S waves to the stations, compare station B with the calculation above: its S-P gap is about 9.7 s. Multiplying by 8 gives 77.6 km, while multiplying by 8.4 gives the straight-line distance of about 81.5 km. The black cross is an estimate based on the rounded factor, not a second earthquake. The interface has no switch for an exact 8.4 solution; that comparison is a calculation on this page.
For an energy experiment, keep the epicentre and depth fixed and raise Magnitude from 5 to 6. The energy readout changes from about 2.0 × 10¹² J to 6.3 × 10¹³ J, a factor of about 31.6. The P and S arrival times do not change because the code keeps wave speed independent of magnitude. If a seismogram reaches its drawing limit, its visible height cannot be used to recover the energy ratio. The records are schematic traces, not calibrated accelerometers.
For a depth experiment, leave the horizontal position fixed and increase Focal depth. See inside reveals the expanding spheres below the surface. Both arrivals become later because the station is farther from the hypocentre, and the S-P gap increases too. Depth does not move the epicentre east or west, although the rounded-factor location estimate can shift. A missing depth estimate means that the fitted squared depth became negative with the approximate distances; it does not mean that the real earthquake happened above the ground.
Finally, change Boundary from Transform to Convergent. The control also moves the quake to a typical position for the selected boundary, so this is not a controlled comparison with unchanged coordinates. Read the new depth before comparing arrival times. These exercises distinguish a deliberate model assumption from a measurement error and keep the visible controls separate from features the exhibit does not simulate.
Questions
Why do most volcanoes form near subduction zones?
The sinking plate carries water into the mantle. The water lowers the melting point of the hot rock above the slab, so magma forms there and rises to build a line of volcanoes parallel to the trench.
Are there volcanoes at transform faults?
Usually not. At a transform fault the plates slide past each other without opening a gap or sinking, so there is nothing to make rock rise or melt. They do have many shallow earthquakes.
Why is the S-P time multiplied by 8?
The factor is v_P·v_S / (v_P - v_S). For a P speed of 6.0 km/s and an S speed of 3.5 km/s it is 8.4 km/s. The value 8 is a rounded rule of thumb that is easy to use in your head.
What is the difference between hypocentre and epicentre?
The hypocentre is the point underground where the rupture starts. The epicentre is the point on the surface directly above it. For the 2017 Pohang earthquake the KMA gave a hypocentre depth of about 7 km.
How much stronger is a magnitude 6 earthquake than a magnitude 5?
In energy, about 31.6 times. For an amplitude-based local magnitude with the appropriate distance and instrument corrections, one step corresponds to about 10 times the measured amplitude. This is not a universal ratio for all wave periods or for the schematic traces here.
Why can the same earthquake have different intensities?
Intensity measures shaking at one place. It drops with distance from the hypocentre and depends on the ground: soft sediment can shake much more than solid rock nearby.
Why does Korea have earthquakes if it is not on a plate boundary?
Stress from the surrounding plate boundaries is passed through the plate interior and builds up on old faults. The KMA attributes the 2016 Gyeongju earthquake to horizontal slip on a fault in the Yangsan fault zone.
Can early warning predict tomorrow's earthquake?
No. It detects an earthquake already in progress and attempts to send information faster than damaging waves travel. People near the source may receive no advance notice.
Is seismic moment the same as radiated energy?
No. M₀ = μ A D describes the physical size of faulting. Its N m unit has the dimensions of energy, but it is not a count of the joules emitted as seismic waves.
Does VEI 6 mean ten times the local danger of VEI 5?
No. The volume category is roughly ten times larger, but local danger depends on the eruption process, terrain and exposure. VEI is not a damage or evacuation-distance scale.
Does a missing estimated depth mean there was no earthquake?
No. With the rounded 8 km/s rule, the fitted squared depth can become negative. That indicates incompatible approximate distances, not a source above ground or an absent earthquake.
Terms
- Plate: a rigid slab of crust and upper mantle that moves as one piece.
- Divergent boundary: where two plates move apart, as at a mid-ocean ridge.
- Convergent boundary: where two plates move towards each other and one usually sinks.
- Transform boundary: where two plates slide past each other sideways.
- Subduction: the sinking of one plate under another into the mantle.
- Flux melting: melting caused by adding water, which lowers the melting point of rock.
- Elastic rebound: the sudden springing back of rock that has bent while a fault was locked.
- S-P time: the time between the arrival of the P wave and the S wave at one station.
- Common chord: the straight line through the two crossing points of two circles.
- Magnitude: one number for the energy of an earthquake.
- Intensity: how strongly the ground shook at one place.
Sources
Korea Meteorological Administration, 9.12 Earthquake (origin time, location, depth, magnitude and maximum intensity of the 2016 Gyeongju earthquakes). https://www.weather.go.kr/w/earthquake/archive/major-eqk/912.do (checked 2026-10-16)
Korea Meteorological Administration, Pohang Earthquake (origin time, location, depth, magnitude and maximum intensity of the 2017 Pohang earthquake). https://www.weather.go.kr/w/earthquake/archive/major-eqk/pohang.do (checked 2026-10-16)
U.S. Geological Survey, This Dynamic Earth: Understanding plate motions (spreading rates, subduction, the San Andreas fault). https://pubs.usgs.gov/gip/dynamic/understanding.html (checked 2026-10-16)
U.S. Geological Survey, Earthquakes: How earthquakes happen (focal depth classes). https://pubs.usgs.gov/gip/earthq1/how.html (checked 2026-10-16)
U.S. Geological Survey, Reid's Elastic Rebound Theory (1906 San Francisco earthquake). https://earthquake.usgs.gov/earthquakes/events/1906calif/18april/reid.php (checked 2026-10-17)
England, Engdahl and Thatcher, Systematic variation in the depths of slabs beneath arc volcanoes, Geophysical Journal International 156, 377 (2004) (depths from 65 to 130 km; earlier estimates about 110 to 125 km). https://academic.oup.com/gji/article/156/2/377/2046454 (checked 2026-10-17)
Columbia University, Subduction Zones (dewatering of the slab, flux melting of the mantle wedge, volcanic arcs, Benioff zones). https://www.columbia.edu/~vjd1/subd_zone_basic.htm (checked 2026-10-17)
U.S. Geological Survey, Magnitude Types (moment-magnitude formula with unit-dependent constants; energy relation in ergs and joules). https://www.usgs.gov/programs/earthquake-hazards/magnitude-types (checked 2026-10-17)
U.S. Geological Survey, Earthquake Magnitude, Energy Release, and Shaking Intensity (each whole number about 32 times more energy). https://www.usgs.gov/programs/earthquake-hazards/earthquake-magnitude-energy-release-and-shaking-intensity (checked 2026-10-17)
U.S. Geological Survey, The Modified Mercalli Intensity Scale. https://www.usgs.gov/programs/earthquake-hazards/modified-mercalli-intensity-scale (checked 2026-10-17)
Korea Meteorological Administration, Phenomena by intensity level (I to XII, based on the Modified Mercalli scale). https://www.weather.go.kr/w/earthquake-volcano/phenomenon.do (checked 2026-10-17)
U.S. Geological Survey, Earthquakes: Measuring earthquakes (P and S waves). https://pubs.usgs.gov/gip/earthq1/measure.html (checked 2026-10-17)
Calculations on this page: straight-line travel times with P 6.0 km/s and S 3.5 km/s; epicentre from the radical centre of three circles; energy from log₁₀ E = 4.8 + 1.5 M.
USGS, Volcanic Explosivity Index (VEI categories, Mount St. Helens, Pinatubo and Parícutin). https://www.usgs.gov/observatories/yvo/news/volcanic-explosivity-index-a-tool-comparing-sizes-explosive-volcanic (checked 2026-10-22)
USGS, Earthquake Early Warning Overview (detection, communication and warning limits). https://www.usgs.gov/programs/earthquake-hazards/science/earthquake-early-warning-overview (checked 2026-10-22)
JMA, Information on the 2011 Great East Japan Earthquake (9.0, 24 km, intensity 7, 8.6 s). https://www.jma.go.jp/jma/en/2011_Earthquake/Information_on_2011_Earthquake.html (checked 2026-10-22)
USGS Fact Sheet 113-97, The Cataclysmic 1991 Eruption of Mount Pinatubo (sulfur dioxide and temporary cooling). https://pubs.usgs.gov/fs/1997/fs113-97/ (checked 2026-10-22)
KMA, Earthquake Early Warning (P-wave detection principle). https://www.kma.go.kr/kma/biz/earthquake_volcano_04.jsp (checked 2026-10-22)
Parker et al. (1996), The impact of Mount Pinatubo on world-wide temperatures, NASA GISS abstract (cooling timing). https://www.giss.nasa.gov/pubs/abs/pa09400x.html (checked 2026-10-22)
More exhibits
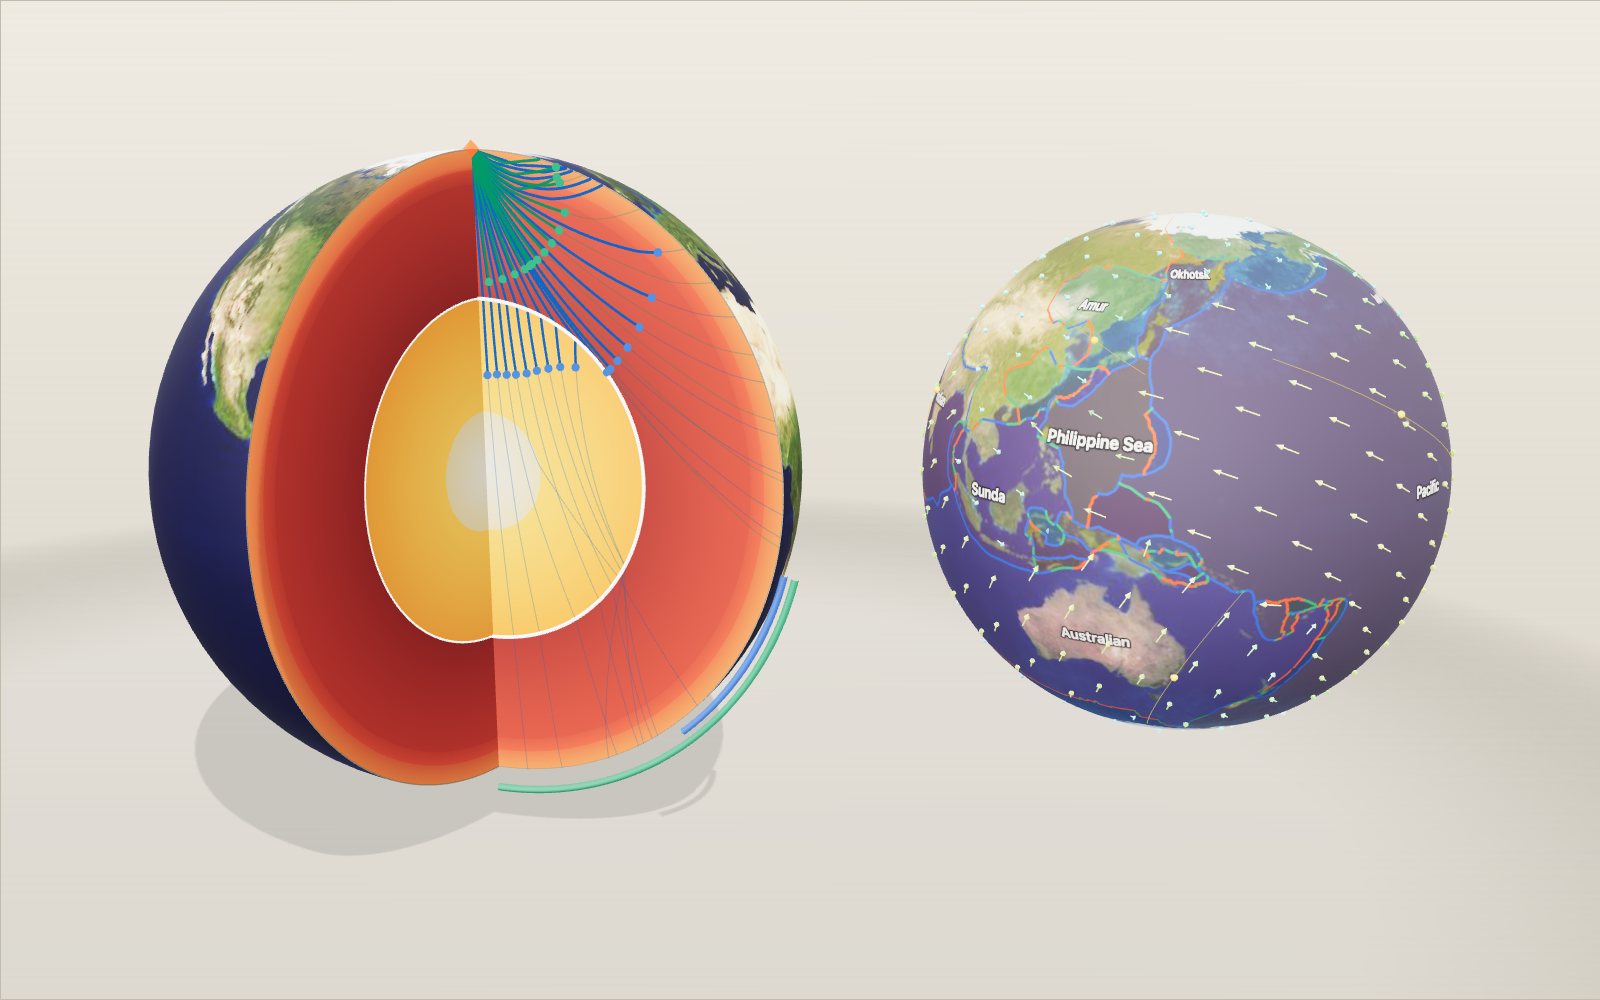
Layers of the Earth: depth and density, interactive model
Nobody has drilled deeper than 12.3 km, yet we know the pressure at the centre to within a few per cent, because earthquakes shine through the planet.
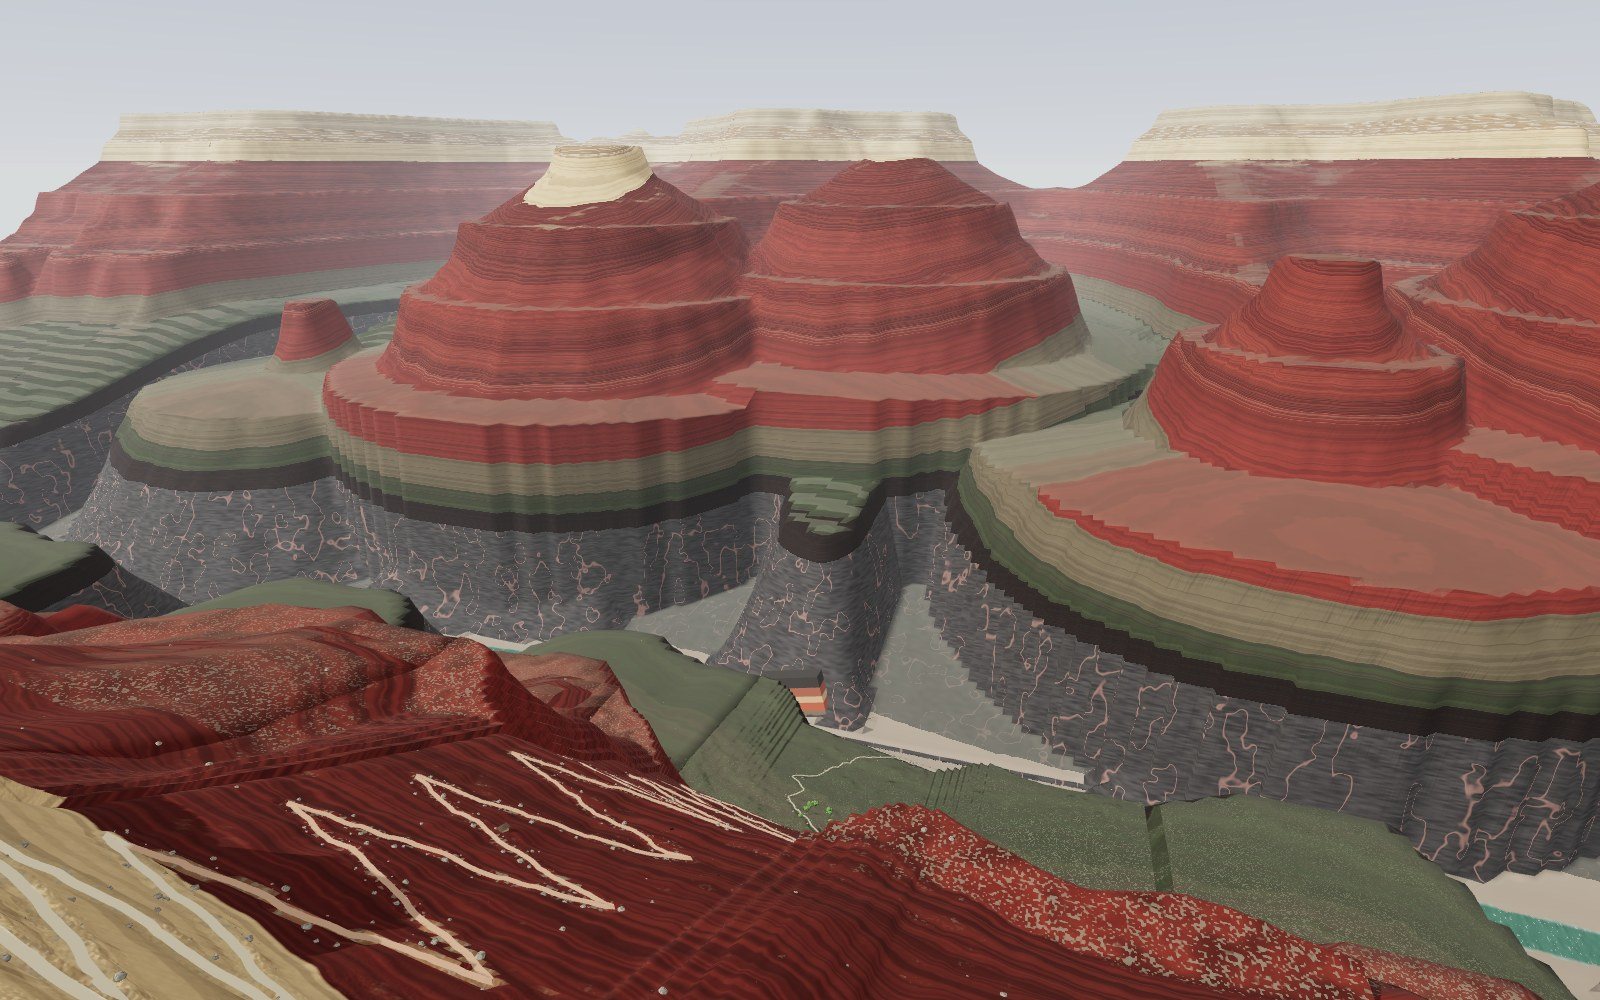
Walk down the Grand Canyon rock layers
Walk 1,360 m down the Bright Angel Trail through 13 rock layers, from a 270-million-year-old sea floor on the rim to 1.75-billion-year-old schist by the river.
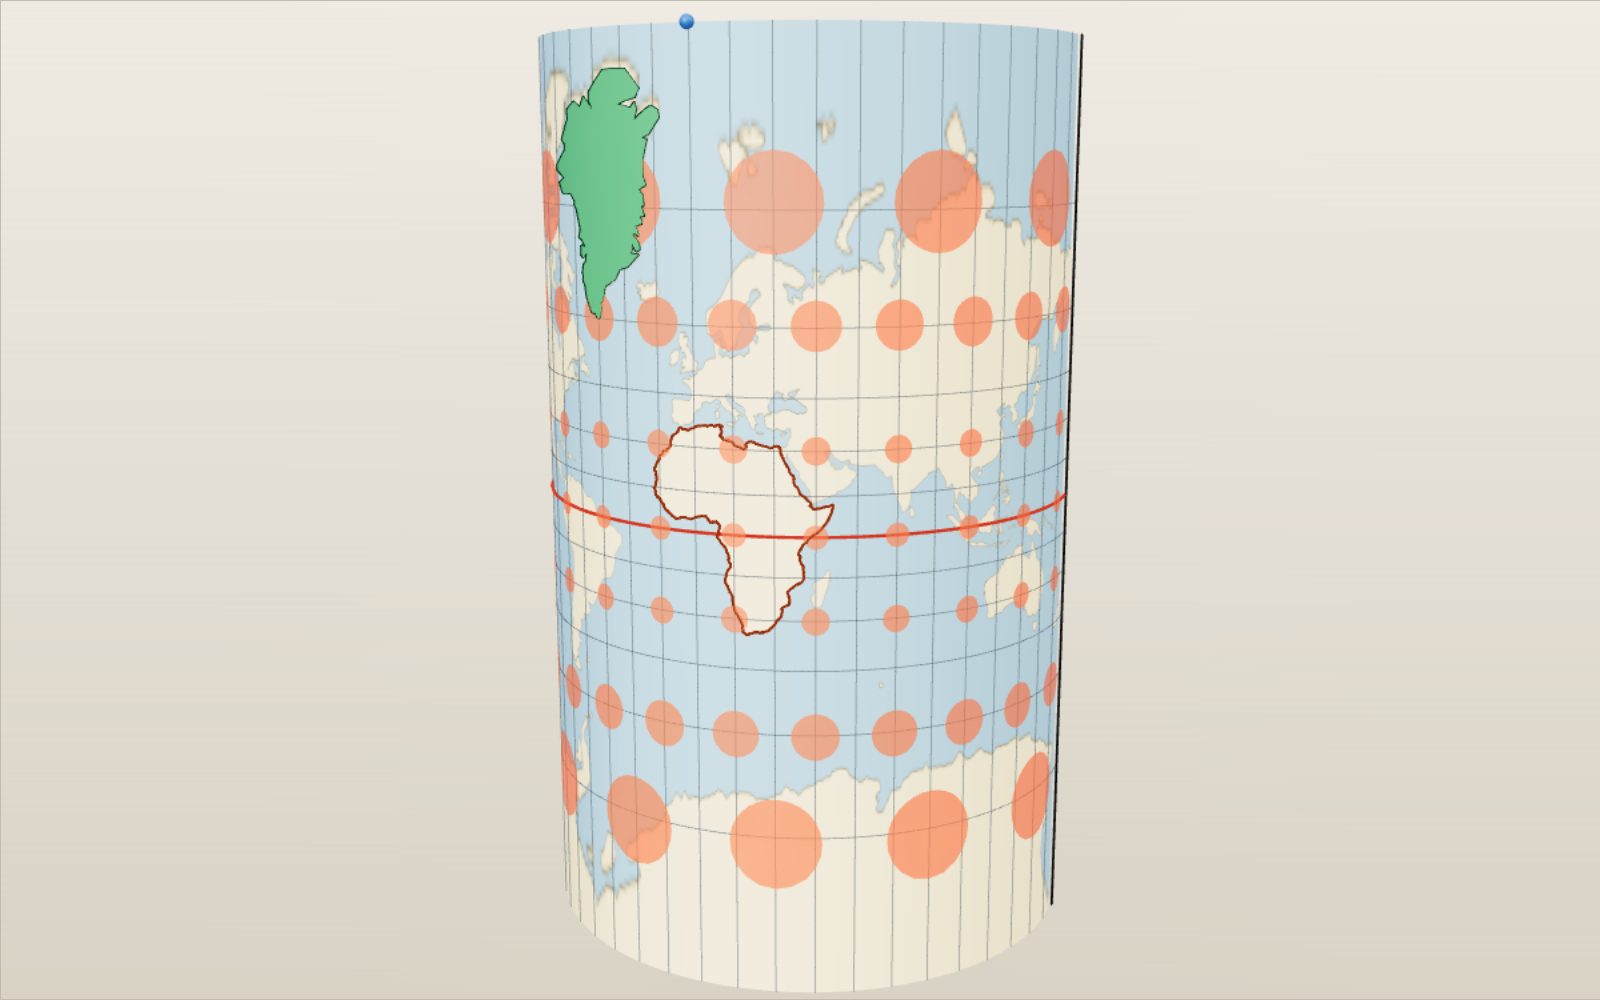
Map projections: why Greenland looks as big as Africa
On a Mercator map Greenland looks bigger than Africa, which is in fact about 14 times larger.
Why salt forms cubes: crystal structure and unit cells
A grain of table salt is a stack of cubes 0.564 nm on a side, with sodium and chlorine alternating along every edge.
How lightning and thunder work
A lightning channel heats the air to about five times the temperature of the Sun’s surface, and its thunder needs about 3 seconds to cover each kilometre to you.
Walk through Machu Picchu
Most of the work that holds Machu Picchu on its ridge, 60 per cent by one estimate, lies under the ground in foundations and drains nobody sees.