Loading the model
This device cannot show the 3D model. You can read the guide steps below as text.
1 / 8 A slice through the plates The block is 440 km wide and 150 km deep, drawn at true scale, so the ocean is a thin film of water. The Boundary slider on the Controls tab switches between the three kinds of plate boundary and moves the quake to a typical spot on each. This one is a mid-ocean ridge, where two plates move apart.
Drag to turn. Scroll or pinch to zoom.
Guide Parts Controls
01 A slice through the plates The block is 440 km wide and 150 km deep, drawn at true scale, so the ocean is a thin film of water. The Boundary slider on the Controls tab switches between the three kinds of plate boundary and moves the quake to a typical spot on each. This one is a mid-ocean ridge, where two plates move apart.
02 Magma at the ridge As the plates separate, hot mantle rock rises to fill the gap. The drop in pressure lets part of it melt, and the melt gathers in a thin lens a few kilometres under the sea floor. Earthquakes here are shallow and mostly small.
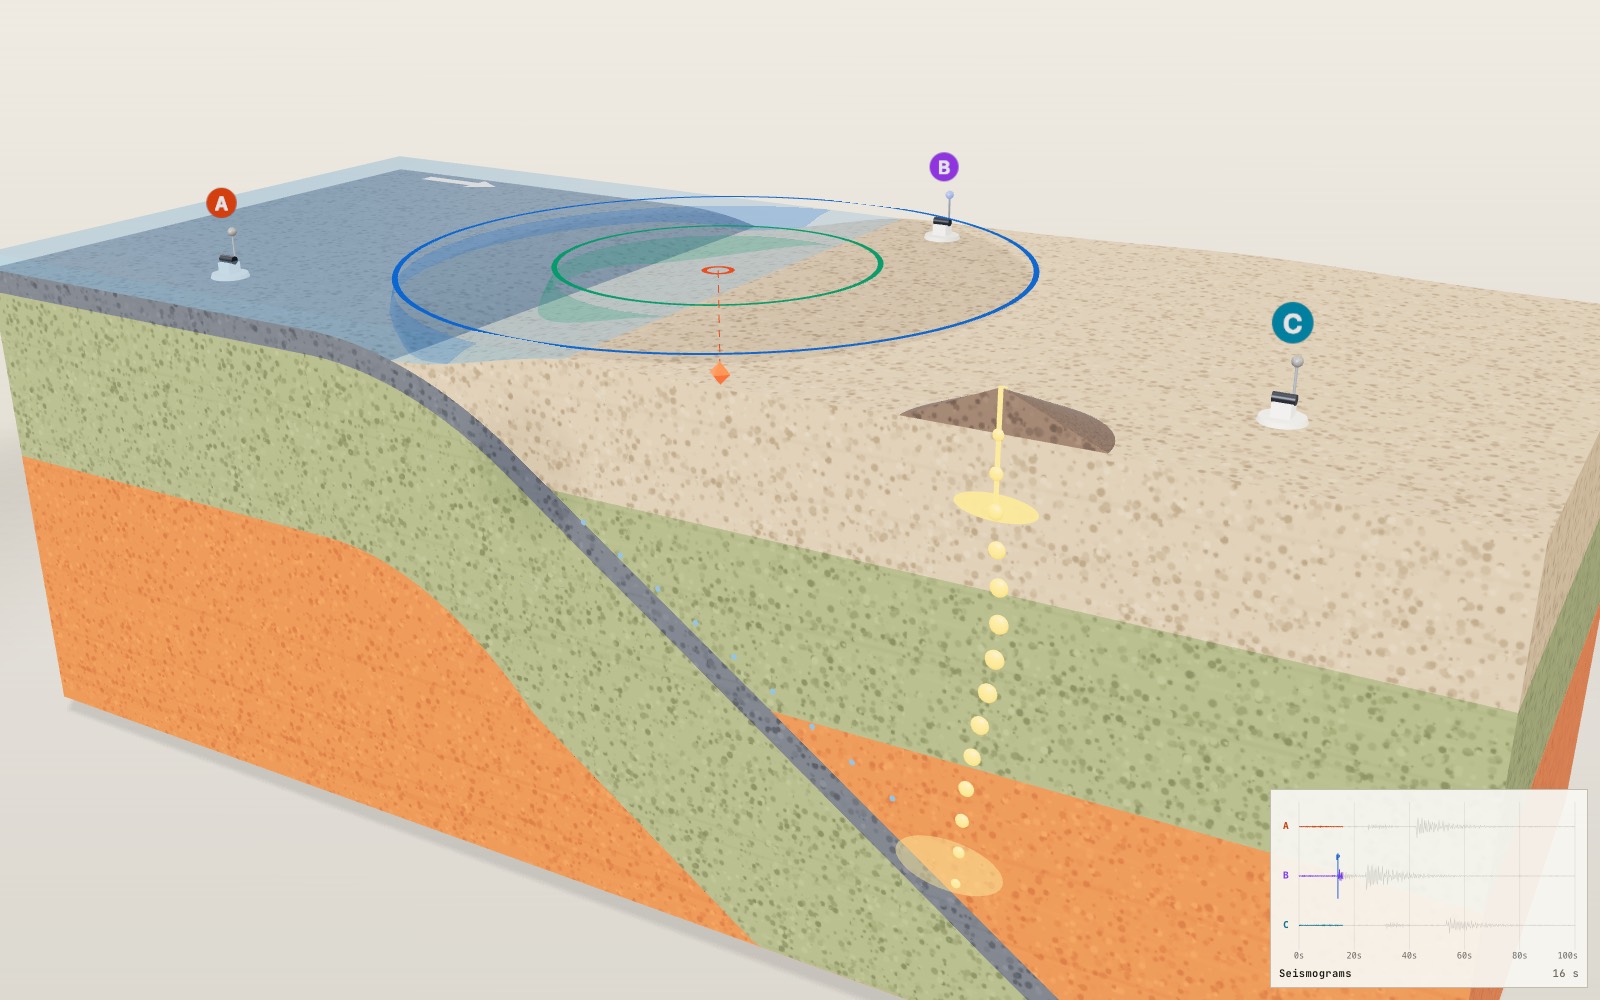
03 One plate dives under another Old ocean plate is cold and dense. Where it meets a continent it bends down at a trench and sinks into the mantle, at 35° in this model. Earthquakes follow the sinking slab from near the surface to well below the crust.
04 Water melts the mantle The slab carries water locked in its minerals. At depth the minerals break down, and the water rises into the hot mantle above and lowers its melting point. The magma climbs to a volcano that sits above the point where the slab is about 120 km deep.
05 Stuck, then slipping At a transform fault the plates slide sideways past each other. The fault is locked near the surface, so the fences bend while the plates keep moving. When the stored strain beats friction, the fault slips at once and each fence snaps into two straight pieces. The offset is hugely exaggerated.
06 P waves and S waves The rupture sends out two kinds of wave. The blue P wave travels at 6.0 km/s in this model and the green S wave at 3.5 km/s. Rings on the surface show where each wave has reached the ground, and the seismograms at bottom right record the same arrivals.
07 The S-P time at each station Each station lamp turns blue when the P wave arrives and green when the S wave arrives. The gap between them, the S-P time, grows with distance by about 8 km for each second. Move the epicentre or the depth on the Controls tab and the gaps change straight away.
08 Three circles find the epicentre Each station draws a circle with a radius of its S-P time times 8 km/s. The lines through the crossing points of each pair meet at one spot, the estimated epicentre (black cross). The red ring is the real one. The small gap comes from rounding 8.4 down to 8.
Oceanic crust Dark basalt about 7 km thick, made at ridges. In the convergent view it is the top of the sinking slab. Continental crust Lighter, granite-like rock, 35 km thick in this model. It is too buoyant to sink, so the ocean plate goes under it. Lithospheric mantle The rigid mantle rock under the crust. Crust and this layer together make up a plate. Asthenosphere Hot mantle that is solid but soft enough to flow slowly. The plates ride on top of it. Magma Molten rock, drawn on the front face. Under a ridge the mantle melts because the pressure drops; above a sinking slab it melts because water lowers the melting point. Volcano A volcano on the continent, cut in half so the conduit shows. It stands about 170 km from the trench, above the point where the slab is 120 km deep. Transform fault The vertical fault where two plates slide past each other. The red band is the locked part, about 20 km deep. The fences show the bending and the snap. Hypocentre Where the rupture starts underground. The red ring on the surface directly above it is the epicentre. P and S waves Blue: the P wave, 6.0 km/s, push and pull. Green: the S wave, 3.5 km/s, side to side. Switch on See inside to watch the spheres grow underground. Seismic stations Stations A, B and C. Each lamp turns blue when the P wave arrives and green when the S wave arrives. Their records are at the bottom right. Distance circles Radius = S-P time × 8 km/s. The black lines are the common chords of each pair of circles; where they meet is the estimated epicentre.