Loading the model
This device cannot show the 3D model. You can read the guide steps below as text.
1 / 20 On the globe every circle is the same The red circles are all 500 km in radius, from the equator to 75° N. Nothing is stretched yet. Drag to turn. Scroll or pinch to zoom.
Drag to turn. Scroll or pinch to zoom.
Guide Parts Controls
01 On the globe every circle is the same The red circles are all 500 km in radius, from the equator to 75° N. Nothing is stretched yet. Drag to turn. Scroll or pinch to zoom.
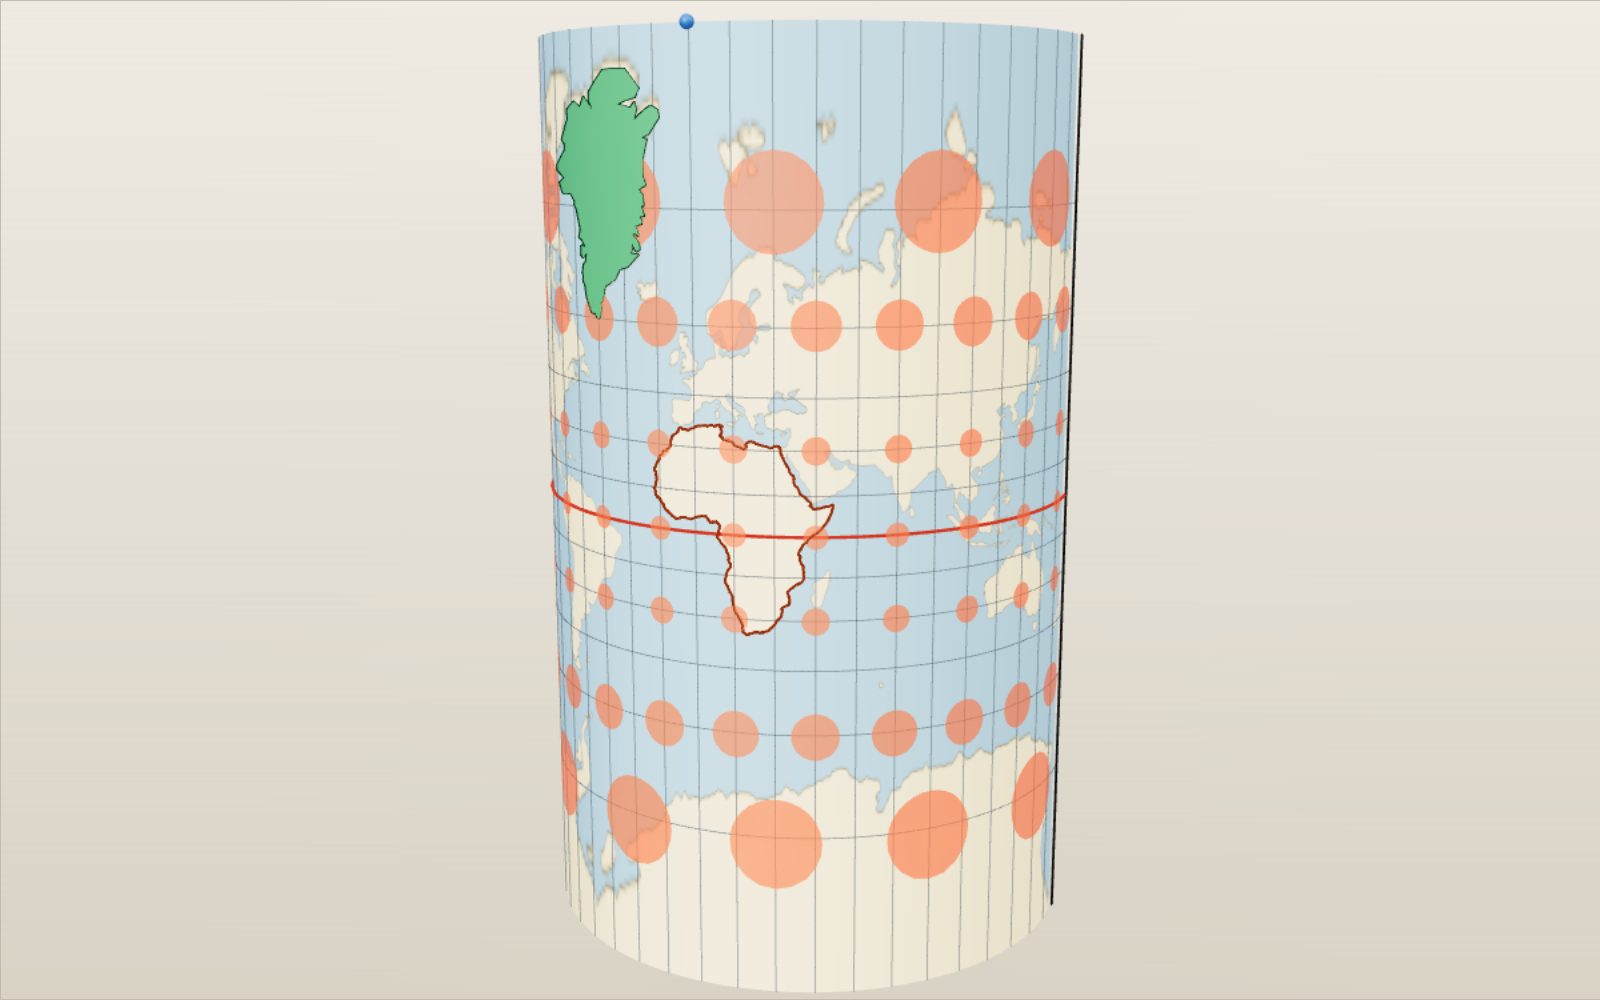
02 Wrapping a cylinder round the globe Mercator wraps paper round the equator. Each point slides along a blue path to the paper. The 60° parallel lands 1.32 Earth radii above the equator, the 75° parallel 2.03 radii.
03 Cut and laid flat Cut along the 180° meridian and unroll. Every Tissot circle is still round, because Mercator keeps angles. But the circle at 60° is 2 times wider, and at 75° 3.86 times. That is sec φ.
04 Greenland moves to the equator At home Greenland covers about 36 million km² of map, more than Africa’s 32.8 million. Slid down to the equator it shrinks to near its real 2.17 million km². The land itself never changed.
05 Web Mercator, the map on your phone The same formula cut at 85.05°, where the map is exactly as tall as it is wide. Square tiles at every zoom level are why web maps chose it.
06 A cylinder on its side Turn the cylinder so it touches a meridian and you get the transverse Mercator. Scale is true along that meridian, which is why UTM and Korea’s national grid use it.
07 Plate carrée Parallels are evenly spaced, 15° apart everywhere, so the grid is made of squares and the map is twice as wide as tall. Circles stretch only east to west: 2 times at 60°.
08 Gall–Peters keeps area Parallels are placed at sin φ and the map is stretched so that shapes are true at 45°. Every red circle now covers the same area, and Greenland comes out at its true 2.17 million km².
09 Mollweide An equal-area map inside an ellipse twice as wide as tall. Meridians curve inwards, so the shapes near the edges lean. Scale is exact along 40°44′ N and S, shown in red.
10 Equal Earth and the heat map Colour shows the area scale: white is true, red bigger, blue smaller. On Equal Earth the whole map stays white, because it is equal-area.
11 Robinson, a compromise The Robinson keeps neither areas nor angles. The heat map turns pink towards the poles, where land is shown up to about twice its size, but the shapes stay familiar.
12 Goode cuts the oceans Cut the map in the oceans and give each continent its own central meridian, and the land keeps both true area and decent shapes. The cost is a map you cannot sail across.
13 A lamp at the centre of the globe The gnomonic map is a real shadow: light from the centre of the Earth throws each point onto a sheet touching the North Pole. Less than a hemisphere fits.
14 Great circles come out straight Every plane through the centre of the globe meets the sheet in a straight line, so every great circle is straight. Seoul to New York is a straight line here, 11,053 km.
15 A lamp at the opposite pole Move the light to the South Pole and the shadow is the stereographic map. It keeps angles and turns every circle into a circle, but sizes grow towards the edge.
16 Distances from the pole On the azimuthal equidistant map distances from the centre are true: Seoul at 37.57° N sits 5,830 km from the pole. The UN emblem uses this projection.
17 The view from a satellite From geostationary height, 35,786 km above Seoul, you see a little less than a hemisphere. This is the vertical perspective projection; change the height to fly closer or out to the Moon.
18 A cone over the middle latitudes Lambert’s conformal conic sets a cone over the globe and opens it into a fan. Scale is true along 33° and 45°, and aviation charts use exactly those parallels.
19 Unfold an icosahedron Fuller’s idea: put the globe on a 20-sided solid and unfold the faces so the land stays in one piece. No direction is up and no single continent sits in the middle.
20 Now compare for yourself The heat map, both routes and the country tool all work on every projection. Try the six tasks under the controls, or press a case to set up a famous map.
Earth’s surface A grid of 144 by 72 cells (72 by 36 on slow devices). Each corner is moved by the formula of the projection and the coastline picture stretches with it. Columns are doubled where the Goode map is cut. Paper What the globe is wrapped in: a cylinder round the equator, a cylinder on its side for the transverse Mercator, a cone for the conic maps, a flat sheet touching the centre point for the azimuthal maps. Paths to the paper Where points of the globe land on the paper. For the gnomonic, stereographic and satellite maps they are real light rays from the lamp; for the others they only show where each point goes. Light source Gnomonic: at the centre of the globe. Stereographic: at the point opposite the centre. Satellite view: above the centre at the height on the slider. Grid lines Meridians and parallels every 15°. On the globe they cross at right angles everywhere; conformal maps keep that, most others do not. Lines of true scale Where 1 cm on the map stands for the same distance as on the globe: the equator on Mercator, 45° on Gall–Peters, 40°44′ on Mollweide, the two standard parallels on the conic maps, the centre of the azimuthal maps. Tissot circles Circles 500 km in radius placed every 30° of longitude (every 60° at 75°). On the globe they are all equal; on a map their size shows the area scale and their shape the bending of angles. Country you move Drag it or use the two country sliders. It keeps its true size on the globe while it moves, so any change you see on the map comes from the projection. The dashed line marks its home. Africa Mainland coast from Natural Earth. Its land area is 29.6 million km², 13.7 times Greenland’s 2.17 million km² (UN Demographic Yearbook). Cut line Where the paper is cut before it is laid flat: the 180° meridian on most maps, the far edge of the azimuthal maps. The Goode and icosahedron maps have more cuts, all at sea where possible. North Pole A single point on the globe. Mercator pushes it to infinity, plate carrée stretches it into a line, the Mollweide and the azimuthal maps keep it a point. Great circle The shortest way between the two cities over the sphere. On the gnomonic map it is a straight line. Rhumb line The course that keeps one compass heading. On Mercator it is a straight line, and it is longer than the great circle unless both cities sit on the equator or on one meridian. Cities The two ends of the route. The first city also centres the orthographic and satellite views, and the azimuthal maps when that switch is on.