FIG. 118Senses
Satellites orbiting Earth right now
On 20 October 2026 the public catalogue listed 16,768 working satellites, and two in every three belonged to one company's internet network.
This device cannot show the 3D model. You can read the guide steps below as text.
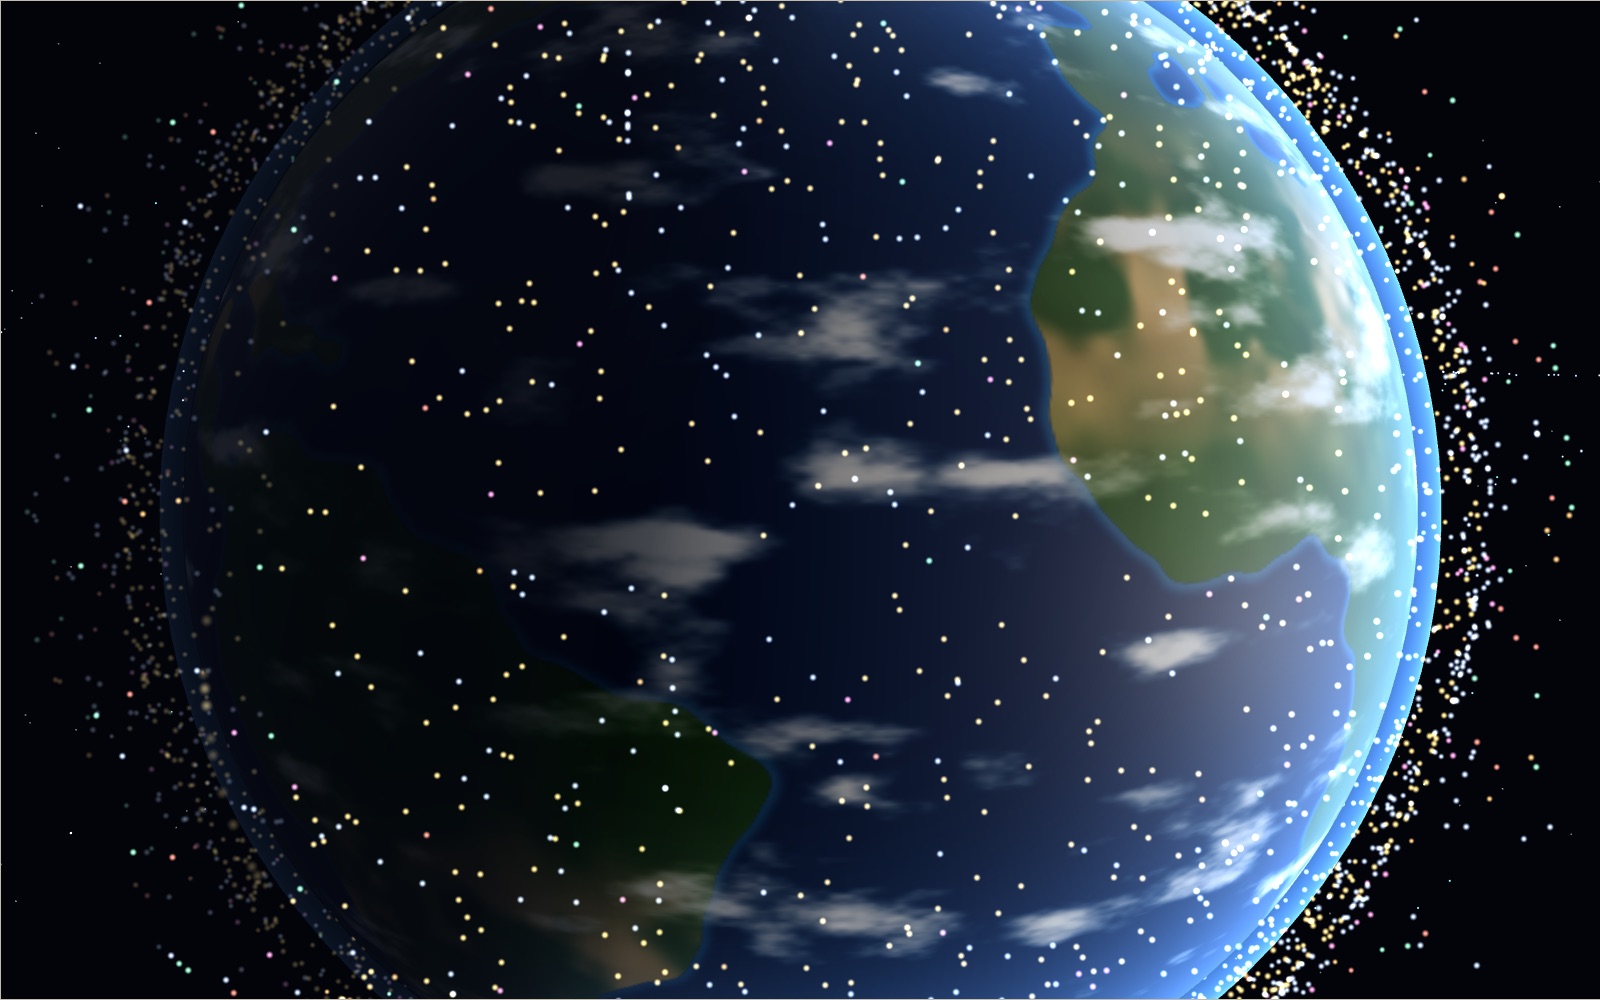
1 / 14 A train of satellitesThe short line of bright dots is the newest Starlink launch in the snapshot, released together days earlier. Around it, every working satellite of the public catalogue moves on its own orbit. Tap any dot to see what it is.
Drag to turn. Scroll or pinch to zoom.
What you are looking at
Look up on a clear evening an hour after sunset and wait a few minutes. Sooner or later a faint star will start to move, slide across the sky without blinking, and fade out halfway across. That was a satellite. How many of them are up there, and why do some show and others not?
This exhibit draws every working satellite in a public orbit catalogue, each one on its own orbit, around a lit Earth. On 20 October 2026, at 06:32 UTC, the catalogue's list of active satellites held 16,768 objects. The stage moves them with the clock, so you can watch the International Space Station go round in a little over an hour and a half, see a line of freshly launched Starlink satellites travel together, and turn the camera with Earth until the geostationary satellites stop dead in a ring over the equator.
Six scenes sit along the top of the stage. Now shows the whole crowd. My sky puts you on the ground at a place you choose and shows which satellites are above your horizon at that moment and which of them you could see with your eyes. Height has one test satellite whose orbit you can raise from 160 km to beyond the Moon, so you can feel how height sets the lap time. Orbits colours the same satellites by type of orbit. Debris shows the fragments left by four break-ups and an estimate of the pieces too small for radar. Since 1957 replays every payload ever catalogued, year by year, from Sputnik 1 to now.
Under the stage you will find eleven challenges, a satellite book with 46 entries, 20 hidden finds, cards that correct common mistakes, a table of numbers with the source of each, and a list of what is over your town right now.
The first ten seconds
The exhibit opens close to Earth's edge. The bright dots are satellites in sunlight; the dimmer ones have passed into Earth's shadow. Near the middle of the frame a short line of dots, drawn a little larger, travels together. That is the newest Starlink launch in the snapshot: 27 satellites released from one rocket on 13 October 2026, a week before the data were taken. After a few seconds the camera pulls back and the line disappears into a cloud of thousands.
The clock starts at ×120, so one second on screen is two minutes of orbit. At real speed a satellite 500 km up crosses the screen far too slowly for the eye at this distance, even though it is moving at more than 7 km/s. The speed buttons along the bottom switch between real time, ×120 and ×1000, and the Time speed control goes up to about four thousand times.
Where the positions come from
Nobody can see all those satellites at once. What exists instead is a catalogue. The United States Space Force tracks objects in orbit with radars and telescopes and publishes their orbits as element sets, six numbers that describe an orbit plus a few that describe how it changes. CelesTrak, a site run by T. S. Kelso since 1985, republishes these sets for the public in several formats and sorts them into groups: active satellites, space stations, GPS, debris from particular events and so on.
This exhibit downloaded the active group, four debris groups and a handful of single objects from CelesTrak once, on 20 October 2026 at 06:32 UTC, and stored them with the page. The page itself never calls anyone. That is why the stamp in the corner of the stage shows a date: positions are computed in your browser from that snapshot. Within a day or two they are good to a few kilometres for most satellites. After a week or two, single satellites drift away from where the snapshot puts them, because their real orbits are pushed around by things the element set cannot foresee: thrusters, changes in the upper atmosphere, small forces from the Sun and Moon. If the snapshot is more than three days old when you open the page, the stage shows the snapshot day at the same clock time and says so.
The catalogue also has a second file, SATCAT, with one line for every object ever catalogued: name, owner, launch date, decay date if it has come down, and its last known perigee, apogee and inclination. On the snapshot day it had 71,088 lines, and 35,047 of them were still in Earth orbit. The Since 1957 scene and most of the counts below the stage come from that file.
What an element set says
An element set is a compact description of an ellipse in space plus a moment in time. Six numbers fix the orbit. The mean motion says how many laps the satellite makes per day; for the ISS on the snapshot day it was 15.489 laps. The eccentricity says how stretched the ellipse is, from 0 for a circle towards 1 for a very long ellipse. The inclination is the tilt of the orbit against the equator: 51.6° for the ISS, about 98° for satellites that cross near both poles. The right ascension of the ascending node says where, among the stars, the orbit crosses the equator going north. The argument of perigee says where on the orbit the low point lies. The mean anomaly says where the satellite was along the orbit at the epoch, the moment the set describes.
Two more numbers matter for low satellites. The drag term, called B*, describes how hard the thin upper air brakes the satellite. The epoch is the time stamp. The ISS set in this snapshot had its epoch at 18:10:54 UTC on 19 October, about twelve hours before the download.
SGP4: from six numbers to a position
To get a position at any time you need a propagator: a set of formulas that carries the orbit forward from the epoch. The element sets in the catalogue are made for one in particular, called SGP4. It was published in 1980 as Spacetrack Report No. 3 by Felix Hoots and Ronald Roehrich, and in 2006 David Vallado, Paul Crawford, Richard Hujsak and T. S. Kelso put out a corrected, documented version together with test cases that any implementation should reproduce.
SGP4 is not a full simulation of the forces on a satellite. It is an analytic model: closed formulas for the main effects of Earth's flattening, the drag of the atmosphere and, for orbits longer than 225 minutes, the pull of the Sun and the Moon. Because the element sets are fitted with the same model, using SGP4 to read them gives the best positions they can give. Using a different propagator with these numbers gives worse results, even if that propagator is more detailed.
The numbers printed on this exhibit, the ISS position in the corner, the details card you get when you tap a dot and the list of satellites over your town, all come from SGP4. The code is satellite.js 7.1.0, an open-source JavaScript version under the MIT licence. The code was run against the published test cases of Vallado and colleagues, among them catalogue number 5, the satellite Vanguard 1, and the results agree to a hundred-thousandth of a kilometre.
As a second check, the ISS position at the snapshot moment was compared with an independent public tracker that uses its own element set and its own code. The two positions, 6.53° S and 90.81° W at about 420 km, were 0.91 km apart.
How the stage draws ten thousand satellites
Running SGP4 for ten thousand objects 60 times a second would take a large share of a phone's time. The stage does something cheaper for the dots. Each dot carries its orbit to the graphics chip: size and shape of the ellipse, tilt, node, perigee and the place on the orbit at a reference time. A small program on the chip solves Kepler's equation for every dot on every frame. To keep the orbits from going stale, the dots also carry the slow turning that Earth's equatorial bulge gives every orbit: the node creeps west for most orbits, by about 4.9° a day for the ISS, and the perigee turns within the orbital plane.
This is a simplification, and measuring it shows how much it costs. For the ISS, the dot is 11.4 km from the SGP4 position at the snapshot moment, 18.0 km a day later and 50.7 km after three days. Across a sample of 318 objects the median gap after one day is 13.7 km. On a planet 12,742 km wide that is less than a pixel at most zoom levels. When precision matters, as in the overhead list, the exhibit switches back to SGP4.
How many satellites are there?
The answer depends on what you count and whose count you use, and the sources disagree by more than a factor of two.
The CelesTrak active list in this snapshot holds 16,768 objects. That list is meant to contain satellites that are still working, judged from their behaviour and from public information. SATCAT, the full catalogue on the same day, had 20,157 payloads in Earth orbit, working or not, plus 2,295 rocket bodies, 12,540 catalogued fragments and 55 objects of unknown type.
The European Space Agency's Space Debris Office keeps its own statistics. On 31 July 2026 it reported about 18,850 satellites still in space out of about 27,490 ever placed in orbit, about 15,900 of them still functioning, and about 47,140 objects regularly tracked by surveillance networks.
The Union of Concerned Scientists ran a well known database of operating satellites for many years. Its last update, with data to 1 May 2023, listed 7,560. The organisation has since paused updates, so that number belongs to its date and should not be compared with today's.
None of these counts is wrong. They differ in date, in what counts as working, and in whether an object counts before it has been fully catalogued. The numbers table under the stage shows each with its source.
Two in every three: Starlink
Of the 16,768 active satellites, 11,150 belong to Starlink, the internet network of SpaceX. That is two in every three. The next largest groups are far smaller: OneWeb with 651, Amazon's Kuiper with 391, and two Chinese networks, Qianfan with 257 and Guowang with 234.
On the stage the Starlink button shows only those satellites. Most of them fly in shells between about 460 and 480 km up, in planes tilted 43°, 53°, 70° and around 97° to the equator, so they cover most of the inhabited world. The planes are visible as curved bands of gold dots, especially at high speed, when each plane becomes a line.
To keep the page light, the stage draws one Starlink satellite in three and one OneWeb satellite in two, chosen by catalogue number so that no shell is favoured. The three newest Starlink launches are drawn in full. The counts on the stage are always the full ones; only the dots are thinned. 9,063 working satellites are drawn in all, standing for the 16,768.
Why the newest Starlinks look like a train
A Falcon 9 releases a stack of Starlink satellites at once, low, around 280 to 350 km. Right after release they drift apart only slowly, all in the same plane, one behind another. Seen from the ground in a dark sky they look like a string of beads crossing the sky, a sight that has led to reports of strange lights after many launches. Astronomer Jonathan McDowell described the pattern in a 2020 study of the Starlink population: the satellites stay in a line for days, then use their thrusters to rise to their working height, which takes weeks, and the line breaks up as each one moves on its own schedule.
In this snapshot the newest group, launched on 13 October, was still at about 290 to 310 km, spread into two clumps. The opening shot of the exhibit centres on the larger clump. Two older groups, from 20 and 28 September, were higher, at about 360 and 345 km, and already spread round their orbits.
The International Space Station
The ISS is the largest structure in orbit, about 109 m from end to end. People have lived on it without a break since November 2000. In the snapshot it circled between 415 and 424 km up on an orbit tilted 51.6°, one lap every 92.97 minutes, at 7.66 km/s.
The tilt sets where it can be seen. An orbit tilted 51.6° reaches 51.6° north and south of the equator and no farther. From Seoul, at 37.6° N, the ISS can pass straight overhead. From places north of about 52°, such as northern Scotland or Alaska, it never passes overhead and appears lower in the southern sky, as NASA notes in its Spot the Station guide.
The ISS also dodges debris. If a tracked object is predicted to come within a few kilometres and the chance of a collision is more than 1 in 10,000, the station normally fires its thrusters. NASA's debris office counted 41 such manoeuvres from 1999 in its FAQ; on 30 April 2025, for example, a Progress cargo ship fired for 3 minutes 33 seconds to keep the station away from a fragment of a Chinese rocket launched in 2005.
Several other objects ride with the station. Ships docked to it, such as Crew Dragon, Soyuz and Progress, have their own catalogue entries and move with it. In the Now scene they overlap with the ISS dot.
Tiangong and the other crewed ships
China's space station Tiangong has been crewed since 2021. In the snapshot it flew between 384 and 386 km, a little lower than the ISS, on an orbit tilted 41.5°, so it never reaches the latitudes of northern Europe. Its lap took 92.25 minutes. A Shenzhou crew ship and a Tianzhou cargo ship were docked to it.
The crewed filter on the stage shows only stations and their ships. It is a small set, 15 objects, and a good way to see how close together the two stations fly in height and how different their tilts are.
Height sets the lap time
Why does the ISS go round in an hour and a half while a weather satellite over the equator takes a full day? In 1619 Johannes Kepler found that the square of a planet's period grows with the cube of its distance from the Sun. Isaac Newton later showed why, and the same rule holds for anything orbiting Earth:
T = 2π √(a³ / GM)
Here a is the semi-major axis of the orbit, Earth's radius plus the height for a circle, and GM is Earth's gravitational parameter, 398,600.4418 km³/s², the value of the IERS Conventions. Try it for the ISS. With a height of 420 km and an equatorial radius of 6,378.137 km, a = 6,798.137 km. Then a³ = 3.1417 × 10¹¹ km³, a³/GM = 788,190 s², the square root is 887.8 s, and 2π times that is 5,578 s, or 92.97 minutes. The catalogue's own mean motion for the ISS gives the same: 1,440 minutes divided by 15.489 laps is 92.97 minutes.
The Height scene lets you move a test satellite from 160 km up to beyond the Moon. Its lap time is printed in the corner and on its label, together with its speed, its laps per day and the longest share of each lap it can spend in Earth's shadow. Some heights to try:
- 420 km: 92.97 minutes, 15.4 laps a day.
- 20,200 km: about 12 hours, two laps a day. This is where the GPS satellites fly.
- 35,786 km: 23 hours 56 minutes 4 seconds, one lap per turn of Earth.
- 377,900 km, the Moon's mean distance minus Earth's radius: 27.45 days.
The last number is a little off on purpose. The Moon's real period against the stars is 27.32 days. The formula above treats the Moon as weightless, but the Moon has 1.23% of Earth's mass, and both bodies pull. Put the sum of the two masses into GM and the formula gives 27.29 days, close to the measured value.
Why higher is slower
It feels natural that a satellite farther out should go faster, as if it needed more speed to stay up there. The reverse is true. For a circular orbit the speed is √(GM/r): the farther out, the slower. The ISS moves at 7.66 km/s, a GPS satellite at 3.87 km/s, a geostationary satellite at 3.07 km/s, and the Moon at about 1 km/s.
Higher orbits are slower and also longer, so the lap time grows faster than the distance. Doubling the distance from Earth's centre makes the lap 2.8 times longer, because 2³ = 8 and √8 = 2.8.
Falling round the Earth
Satellites do not float because gravity has run out. At the ISS's height gravity is still about 88% of its strength at the ground: Earth's mean radius is 6,371 km, so the ratio is (6,371 / 6,791)², which is 0.88. The station is falling all the time. It also moves sideways at 7.66 km/s, and at that speed the ground curves away beneath it as fast as it falls. The crew feel weightless because they and the station fall together.
This is the idea Newton drew as a cannon on a mountain. Fire a ball faster and faster and it lands farther and farther away, until, at the right speed, the ground falls away under it as fast as it drops and it never lands. That speed depends on height, which brings us back to the formula above.
Low orbit and the busiest layer
15,955 of the 16,768 active satellites, 95%, fly in low Earth orbit, which the exhibit takes as laps shorter than 128 minutes, roughly below 2,000 km. Low orbit is cheap to reach, close enough for small cameras and quick radio links, and clean in one way: the thin air there pulls dead satellites down within years.
The chart in the Height scene counts working satellites in steps of 100 km. One step stands out by far: 10,590 satellites, nearly two thirds of all working satellites, fly between 400 and 500 km. Most of them are Starlink. The next busiest bands are 500 to 600 km, with 1,681, and 1,100 to 1,200 km, with 544, where OneWeb flies.
The ESA Space Environment Report of 2025 pointed out the same shift: a growing share of constellation satellites flies below 500 km, where drag clears failed satellites faster. In the 550 km region, the report says, debris objects posing a threat are now of the same order of magnitude as active satellites.
Orbits that keep to the Sun's schedule
Many Earth-observing satellites fly at about 98°, tilted slightly backwards over the poles. Landsat 9 in the snapshot, for example, circled at 702 km with an inclination of 98.22°. The tilt is chosen with care. Earth's bulge turns every orbit's plane slowly; for an orbit tilted a little past 90° the turn goes eastward. At the right tilt it is 0.9856° a day, one full turn a year, which keeps the orbit in step with the Sun. Such a satellite crosses each latitude at the same local solar time every day, so its pictures always have similar light and shadows.
The exhibit's orbit code can compute that tilt from the same bulge term it uses to move the dots. For an orbit 700 km up it gives 98.19°, within a few hundredths of a degree of Landsat 9's value.
Medium orbits: the navigation satellites
Between low orbit and the geostationary belt lies a wide region with few satellites: only 186 of the active ones. Most of them are navigation satellites. GPS.gov describes the American system as satellites about 20,200 km up that circle Earth twice a day, arranged in six planes, with 31 operational satellites as of July 2023 (the snapshot's active list held 40 objects named NAVSTAR, including spares). Russia's GLONASS flies a little lower, at about 19,100 km in the snapshot, Europe's Galileo a little higher, and China's BeiDou mixes medium, geostationary and tilted 24-hour orbits.
One detail on the stage is easy to miss. In the Orbits scene, the green dots of these systems form a sparse shell far beyond the dense blue haze of low orbit. A phone that wants four satellites in view at once needs a constellation spread this way: high enough to see much of the globe, and enough planes that some satellites are always up.
The geostationary belt
At 35,786 km above the equator a lap takes exactly as long as one turn of Earth against the stars: 23 hours 56 minutes 4 seconds. ESA explains it this way: a satellite there, flying west to east over the equator, keeps pace with Earth's spin and appears to stand still above one spot. Dishes on the ground can point at it once and never move.
In the Orbits scene the 575 geostationary satellites of the active list form a thin ring. Press Turn with Earth and the camera starts to rotate with the planet. The ring freezes while everything else races by. The satellites are not resting: each moves at about 3.07 km/s, on a circle 265,000 km round.
You can find Korea's weather satellite in that ring. GEO-KOMPSAT-2A, also called Chollian 2A, sat at 128.27° E and 0.00° latitude in the snapshot. This position is within 0.15° of its 128.2° E slot.
Long ellipses
A geostationary satellite sits so low on the horizon for places far to the north that buildings and hills block it. The Soviet engineers who built the Molniya communications satellites in the 1960s chose a different orbit: a long ellipse tilted 63.4°, with a lap of half a day. NASA's catalogue of orbits gives an eccentricity of 0.722 for it. The satellite rushes through its low point over the southern hemisphere and spends about two thirds of each lap high over the north, where it moves slowly, almost like a high-latitude geostationary satellite.
The tilt of 63.4° is not chosen at random. For most tilts Earth's bulge slowly turns the ellipse within its plane, so the high point would wander south. At 63.4°, and only there, that turning stops. Kidder and Vonder Haar, writing about Molniya orbits for weather observation in 1990, give the period as 717.74 minutes and the apogee as about 39,750 km.
The snapshot's Meridian 7, a Russian communications satellite, follows such an orbit: 717.83 minutes per lap, tilted 63.45°, between 2,635 and 37,722 km. In the Orbits scene it is drawn with a pink line, and in the Turn with Earth view you can watch it hang over the north.
The far ones
A few satellites go much farther. NASA's planet-hunting telescope TESS swings between about 119,000 and 364,000 km, almost to the Moon's distance. Its orbit was designed to take half as long as the Moon's month, 13.7 days, so that the Moon's pull keeps it stable rather than shaking it loose; Ricker and colleagues describe the design in 2015. In the snapshot its lap had grown to 14.2 days.
The Chandra X-ray Observatory, launched in 1999, goes out to about 136,000 km, about a third of the way to the Moon, and comes back to 12,600 km every 2.6 days. ESA's XMM-Newton, also from 1999, has a lap of just under two days. NASA's four MMS spacecraft fly in formation out to 171,000 km to study how Earth's magnetic field connects and breaks.
To see them, open Orbits and zoom far out. The pink lines of their ellipses dwarf the geostationary ring.
Your sky
The My sky scene puts a smooth faceless figure on the ground at the place you choose and draws the sky as a dome over it. For each satellite the stage works out where it would be seen: its azimuth, the compass direction measured from north through east, and its elevation, the angle above the horizon.
The arithmetic has three steps. The place on Earth becomes a point in space, using the WGS 84 shape of the planet. Earth is turned to the right sidereal time for the clock, so the place sits where it really is among the satellites. Then the line from you to the satellite is split into east, north and up, and two angles fall out.
The dome is not to scale. A satellite 420 km above you and one 35,786 km away are drawn on the same dome; only the direction is real. The list under the stage gives the distance.
You can pick a city, type a latitude and longitude, or let the browser give your position. None of it leaves the page: the choice is stored in your browser only.
When you can see a satellite
Satellites have no lights bright enough to see from the ground. We see them by reflected sunlight, like the Moon. So two things must be true at once. Your sky must be dark, which the exhibit takes as the Sun more than 6° below your horizon. And the satellite must still be in sunlight, outside Earth's shadow.
Right after sunset that combination is common. The ground is in shadow, but a satellite a few hundred kilometres up still sees the Sun over the horizon. As the night goes on, Earth's shadow rises through the sky, and around midnight most low satellites are inside it. NASA's Spot the Station guide puts it simply: all sightings of the ISS fall within a few hours before or after sunrise or sunset.
Press After sunset in the My sky scene and the clock jumps to the evening twilight at your place. The lit dots now shine against a dark sky; the readout counts them. Not all of them would really be visible: brightness also depends on size, on the angle of the sunlight and on how far away the satellite is, and most small satellites are too faint for the naked eye. The list marks the ones that meet the geometric conditions, more than 10° up, closer than 2,000 km, in sunlight and in a dark sky, and leaves the brightness question open. Navigation and geostationary satellites can be in sunlight all night, but at tens of thousands of kilometres they are far too faint for the eye.
Earth's shadow, lap by lap
Turn on Earth's shadow in the Now scene and every satellite in the shadow goes dim. The exhibit models the shadow as a cylinder as wide as Earth, pointing away from the Sun, which is accurate to a few seconds at the moments of entry and exit for low orbits.
How long does a low satellite spend in the dark? When the Sun lies in the plane of a circular orbit at radius r, the dark arc spans an angle of 2 × arcsin(R/r). For the ISS, with r = 6,798 km, that is 2 × arcsin(0.938) = 139.5°, or 38.8% of each lap: 36 minutes out of 92.97. When the Sun is far out of the orbit plane the dark share shrinks, and in some seasons the ISS stays in sunlight for days. Higher orbits spend less time in the shadow; a geostationary satellite passes through it only around the equinoxes, for at most about 70 minutes a day, which follows from the same formula with r = 42,164 km.
What is tracked
Debris is anything in orbit that no longer serves a purpose: dead satellites, spent rocket stages, and fragments from explosions and collisions. The public catalogue on the snapshot day listed 12,540 catalogued fragments and 2,295 rocket bodies in Earth orbit. ESA counts about 47,140 objects regularly tracked by surveillance networks and estimates that more than 660 break-ups, explosions, collisions or other fragmentation events have happened since 1957.
Speed is what makes debris dangerous. NASA's debris office gives speeds of 7 to 8 km/s in low orbit and an average impact speed of about 10 km/s between two objects, and up to 15 km/s. At such speeds a fragment of a centimetre or so can disable a satellite.
The Debris scene shows the fragments of four events, all from the catalogue's debris groups, coloured by event, with the working satellites faded behind them.
Fengyun-1C, 2007
On 11 January 2007 a Chinese missile struck the old weather satellite Fengyun-1C, which circled at 845 by 865 km on a near-polar orbit tilted 98.6°. NASA's Orbital Debris Quarterly News called it the worst single contamination of low orbit in 50 years. The cloud reached from 200 km to more than 4,000 km, and most of the debris was thrown into orbits that last decades or centuries. NASA estimated that pieces of 1 cm or more might number as many as 35,000.
The public catalogue lists 3,534 catalogued fragments from Fengyun-1C, and 2,314 of them were still in orbit on the snapshot day, almost 20 years later. The red dots in the Debris scene are the 1,978 of them that had current element sets.
Iridium 33 and Cosmos 2251, 2009
In February 2009 two whole satellites collided for the first time by accident: Iridium 33, a working communications satellite, and Cosmos 2251, a dead Russian one. NASA's debris office reported that the fragments clustered near 800 km, where many communication and Earth-observation satellites fly, but the clouds reached from 200 to 1,700 km. Cosmos 2251 produced about twice as many fragments as Iridium 33, close to the ratio of their masses.
The catalogue lists 1,716 fragments from Cosmos 2251 and 656 from Iridium 33. Of those, 610 and 115 were still in orbit in the snapshot.
Cosmos 1408, 2021
On 15 November 2021 Russia destroyed its own dead satellite Cosmos 1408 with a missile. The satellite flew at about 480 km, so the fragments started out close to the height of the ISS, and the station had to keep clear of the cloud. NASA's debris office described the event in its March 2022 newsletter.
The catalogue lists 1,806 fragments. On the snapshot day 4 were left. At 480 km the upper atmosphere is thick enough to bring most fragments down within a few years. The purple dots in the Debris scene are nearly all gone: low orbits clean themselves.
The pieces nobody can track
Radar and telescopes catch objects down to about 10 cm in low orbit. Smaller pieces are counted by statistical models built from impact marks on returned hardware, special radar campaigns and break-up simulations. ESA's MASTER-8 model, with its February 2026 reference population, estimates about 68,450 objects larger than 10 cm, about 1.5 million between 1 and 10 cm, and about 230 million between 1 mm and 1 cm.
The Pieces too small to track button in the Debris scene adds a grey cloud to the stage. It is a model, and the exhibit marks it as one. Each grey dot stands for 100 of the 1.5 million. Their orbits are copied from tracked objects in low orbit, with random orientation and position, so the cloud has the same height profile as the tracked population. Where the pieces really are, nobody knows.
How long debris stays up
Height decides. NASA's debris office says debris below 600 km normally falls back to Earth within several years. At 800 km decay often takes centuries, and above 1,000 km a thousand years or more. The geostationary belt has no air at all; dead satellites there stay for good unless they are moved, which is why operators lift them a few hundred kilometres higher into a graveyard orbit at the end of their life.
Rules have tightened. The US Federal Communications Commission adopted a rule in 2022 that satellites it licenses in low orbit must leave orbit within five years of the end of their mission, instead of the 25 years used before. ESA's 2026 report notes the result: with around ten objects launched each day and more than three intact objects re-entering daily, more satellites now come down on purpose at the end of their lives.
The Kessler syndrome
In 1978 Donald Kessler and Burton Cour-Palais of NASA asked what would happen as the number of satellites grew. Their answer was that collisions would eventually produce fragments faster than drag could remove them, and those fragments would cause more collisions. A belt of debris would grow around Earth on its own.
ESA's 2025 report says there is scientific consensus that this point has been passed in some regions: even with no further launches, fragmentation would add debris faster than it re-enters. The report concludes that active removal of debris is required to stop the growth. Opinions differ on how quickly the cascade would make orbits unusable; the models depend on how many objects future launches add and how well operators follow the rules.
Since 1957
On 4 October 1957 the Soviet Union launched Sputnik 1, a polished ball 58 cm across that weighed 83.6 kg and went round in about 98 minutes. It came down three months later. At the end of 1957 two payloads were in orbit; Sputnik 2 had joined in November.
The Since 1957 scene shows 27,561 payloads, every one in the public catalogue that ever orbited Earth and whose perigee and apogee are known. The year slider shows those up at the end of each year. Because the catalogue gives an orbit's size, shape and tilt but not where the satellite was, the orientation and the place on the orbit are random. The shape of the cloud is real; single dots are not.
The chart beside it gives the exact counts of payloads in orbit:
- 1970: 457
- 1990: 1,943
- 2000: 3,215
- 2010: 3,882
- 2019: 5,526
- 2020: 6,645
- 2023: 12,464
- 2025: 17,552
- 20 October 2026: 20,303
For 60 years the number grew by roughly a hundred a year. Then it jumped. In 2019, 453 payloads were launched; in 2020, 1,235; in 2025, 4,492, most of them Starlink. From the end of 2019 to the snapshot day the count of payloads in orbit grew 3.7 times.
The oldest satellite still up is not Sputnik. It is Vanguard 1, launched on 17 March 1958, which NASA calls the oldest artificial object orbiting Earth. It was also the first satellite powered by sunlight. In the snapshot it circled between 651 and 3,819 km, high enough at its low point that the air barely touches it.
Your birthday
Enter your birthday in the lab and the exhibit looks up how many payloads were in orbit on the first day of that month, using the same catalogue. It also says how many were launched in the year you were born and how many times more there are now. Someone born in January 1990 started life with about 1,800 satellites overhead. Someone born in January 2020 started with fewer than 6,000. Today there are more than 20,000.
Astronomers and bright satellites
More satellites mean more streaks across long telescope exposures. Hainaut and Williams of the European Southern Observatory estimated in 2020 how often large constellations would cross the images of ESO's telescopes and found the effect strongest near twilight, when low satellites are lit and the sky is dark: the same condition the My sky scene shows. Tyson and colleagues modelled the problem for the Rubin Observatory, whose wide camera images the whole southern sky every few nights, and found that dimmer satellites and careful scheduling reduce the damage but do not remove it. A 2020 workshop run by NOIRLab and the American Astronomical Society, SATCON1, collected recommendations for operators and observatories.
Space weather
The Sun can bring satellites down. On 3 February 2022 SpaceX launched 49 Starlink satellites to a low starting orbit, with a perigee near 210 km. A moderate geomagnetic storm on 3 and 4 February heated and swelled the upper atmosphere, raising the drag. 38 of the 49 could not climb to their working height and re-entered within days. Dang and colleagues traced the event from a solar flare and coronal mass ejection to the atmosphere, and Fang and colleagues at NOAA's Space Weather Prediction Center estimated the density increase along the satellites' paths.
The lesson shows on the stage: the lowest satellites, like the newest Starlink train, are the ones most at the mercy of the air.
Korea in orbit
The public catalogue lists 96 payloads owned by South Korea, and 85 of them were still in orbit on the snapshot day, working or not. The first was KITSAT-1, Uribyol 1, launched on 10 August 1992. The Korean button in the Now scene highlights those in the active list. Among them are the geostationary weather satellite GEO-KOMPSAT-2A, its ocean and air-quality twin GEO-KOMPSAT-2B, the Koreasat broadcasting satellites, the KOMPSAT Earth-imaging satellites and the small NEONSAT satellites.
How the model differs from reality
Some things on the stage are simplified, and it is fair to say which.
- The dots move with Kepler's laws and the bulge term, not full SGP4. The gap is measured above: about 14 km after a day for half the satellites.
- Starlink is thinned to one dot in three and OneWeb to one in two. The newest three Starlink launches and all other satellites are complete.
- The snapshot is a single moment. Satellites that manoeuvred after it are where the snapshot says, not where they are.
- Earth's shadow is a cylinder. The real shadow has a soft edge, the penumbra, and the atmosphere bends sunlight into it, so entry and exit are gradual.
- Visible means a geometric condition. Brightness depends on size, shape, reflectivity and angle, which the catalogue does not give.
- The grey debris cloud is an estimate from ESA's model, placed on copied orbits.
- In Since 1957, positions along each orbit are random.
- Satellites are drawn as dots a few pixels wide. At the scale of the stage the ISS, 109 m across, would be less than a thousandth of a pixel.
- Earth's map is drawn from a coarse public land outline, smoothed, with made-up clouds.
The guided tour and the lab
The guided tour in the panel has 14 steps, from the Starlink train through the ISS, the shadow, your sky, Kepler's law at three heights, the orbit types and the frozen belt, to the debris clouds and the replay from 1957. Each step sets the stage, and you can stop and look around at any point.
The lab under the stage has a place and birthday panel, the list of satellites over your place computed with SGP4, the eleven challenges, the numbers table, the satellite book with 46 entries in eight groups, the hidden finds and the cards that correct common mistakes. Stars, finds and book entries are kept in your browser.
Questions
How many satellites are in orbit right now?
On 20 October 2026 the CelesTrak list of active satellites held 16,768. The full public catalogue had 20,157 payloads in Earth orbit, working or not. ESA counted about 15,900 functioning satellites in July 2026. Counts differ by source, by date and by what counts as working.
How fast does the ISS go?
About 7.66 km/s, or about 27,600 km/h. It goes round once every 92.97 minutes, so its crew see about 16 sunrises a day.
Why can I see the ISS only in the evening or early morning?
You need a dark sky and a satellite in sunlight. That happens for a few hours after sunset and before sunrise. Around midnight the ISS and other low satellites are usually in Earth's shadow.
How high is the geostationary belt?
35,786 km above the equator. A lap there takes 23 hours 56 minutes 4 seconds, one turn of Earth against the stars, so the satellites seem to stand still.
Why do satellites not fall down?
They do fall, all the time. They also move sideways so fast that the ground curves away beneath them as fast as they drop. At the ISS's height gravity is still about 88% of its strength on the ground.
Are higher satellites faster?
No. Higher satellites are slower: 7.66 km/s at 420 km, 3.87 km/s at 20,200 km, 3.07 km/s at 35,786 km.
What is a Starlink train?
A line of Starlink satellites shortly after launch. They are released together and fly one behind another for a few days before raising their orbits and spreading out.
Why is Starlink drawn with fewer dots?
To keep the page light, one Starlink satellite in three is drawn. The counts printed on the stage are the full numbers.
How accurate are the positions?
The numbers printed come from SGP4 and are good to a few kilometres within a day or two of the snapshot. The dots use a simpler method that differs from SGP4 by a median of about 14 km after a day. Weeks after the snapshot, single satellites can be far from where the stage shows them.
Does the page track satellites live?
No. It uses a dated snapshot downloaded once. The page makes no calls to outside services, and the stamp on the stage shows the snapshot date.
What is space debris?
Objects in orbit that no longer serve a purpose: dead satellites, rocket stages and fragments. The public catalogue listed 12,540 catalogued fragments in orbit on the snapshot day, and ESA estimates about 1.5 million pieces between 1 and 10 cm.
Which event left the most debris?
The destruction of Fengyun-1C on 11 January 2007. The catalogue lists 3,534 fragments, and 2,314 were still in orbit in October 2026.
How long does debris stay in orbit?
It depends on height. Below 600 km it normally falls within several years; at 800 km decay often takes centuries; above 1,000 km it can circle for a thousand years or more.
What is the Kessler syndrome?
A runaway in which collisions create fragments faster than they re-enter, and those fragments cause more collisions. Kessler and Cour-Palais described it in 1978. ESA reports a scientific consensus that some orbits have already passed that point.
Which satellite is the oldest still in orbit?
Vanguard 1, launched on 17 March 1958. Sputnik 1 burned up in January 1958.
How many satellites does Korea have?
The public catalogue lists 96 South Korean payloads launched since KITSAT-1 in 1992, and 85 of them were still in orbit in October 2026, working or not.
Terms
- Element set: six numbers describing an orbit at a moment, plus drag and time; the form in which the catalogue publishes orbits.
- SGP4: the analytic propagator the element sets are made for.
- Perigee and apogee: the lowest and highest points of an orbit.
- Inclination: the tilt of an orbit against the equator.
- Low Earth orbit: here, laps shorter than 128 minutes, roughly below 2,000 km.
- Geostationary orbit: a circular orbit over the equator at 35,786 km, one lap per sidereal day.
- Sidereal day: one turn of Earth against the stars, 23 hours 56 minutes 4 seconds.
- Megaconstellation: a network of hundreds or thousands of satellites working together.
- Catalogued fragment: a piece of debris tracked well enough to get a catalogue number.
- Kessler syndrome: a cascade of collisions that keeps the debris population growing on its own.
Sources
- CelesTrak (T. S. Kelso). GP element sets, active satellites and debris groups, downloaded 20 October 2026 06:32 UTC. https://celestrak.org/NORAD/elements/
- CelesTrak. SATCAT format documentation and catalogue. https://celestrak.org/satcat/satcat-format.php
- Kelso, T. S. A New Way to Obtain GP Data. CelesTrak. https://celestrak.org/NORAD/documentation/gp-data-formats.php
- Hoots, F. R. and Roehrich, R. L. (1980). Spacetrack Report No. 3: Models for Propagation of NORAD Element Sets. https://celestrak.org/NORAD/documentation/spacetrk.pdf
- Vallado, D. A., Crawford, P., Hujsak, R. and Kelso, T. S. (2006). Revisiting Spacetrack Report #3. AIAA 2006-6753. https://celestrak.org/publications/AIAA/2006-6753/
- satellite.js 7.1.0, MIT licence. https://github.com/shashwatak/satellite-js
- IERS Conventions (2010). IERS Technical Note 36. https://iers-conventions.obspm.fr/
- ESA Space Debris Office. Space Environment Statistics, last update 31 July 2026. https://sdup.esoc.esa.int/discosweb/statistics
- ESA. ESA Space Environment Report 2026. https://www.esa.int/Space_Safety/Space_Debris/ESA_Space_Environment_Report_2026
- ESA. ESA Space Environment Report 2025. https://www.esa.int/Space_Safety/Space_Debris/ESA_Space_Environment_Report_2025
- Union of Concerned Scientists. UCS Satellite Database, data to 1 May 2023. https://www.ucs.org/resources/satellite-database
- NASA Orbital Debris Program Office. Frequently Asked Questions. https://orbitaldebris.jsc.nasa.gov/faq/
- NASA Orbital Debris Quarterly News 11(2), April 2007: Chinese anti-satellite test creates most severe orbital debris cloud in history. https://orbitaldebris.jsc.nasa.gov/quarterly-news/pdfs/odqnv11i2.pdf
- NASA Orbital Debris Quarterly News 13(3), July 2009: Iridium 33 and Cosmos 2251. https://orbitaldebris.jsc.nasa.gov/Quarterly-News/pdfs/ODQNv13i3.pdf
- NASA Orbital Debris Quarterly News 26(1), March 2022: The intentional destruction of Cosmos 1408. https://orbitaldebris.jsc.nasa.gov/quarterly-news/pdfs/odqnv26i1.pdf
- NASA (2025). Station maneuvers to avoid orbital debris, 30 April 2025. https://www.nasa.gov/blogs/spacestation/2025/04/30/station-maneuvers-to-avoid-orbital-debris/
- Kessler, D. J. and Cour-Palais, B. G. (1978). Collision frequency of artificial satellites: the creation of a debris belt. Journal of Geophysical Research 83(A6): 2637. https://doi.org/10.1029/JA083iA06p02637
- NASA. Space station facts and figures. https://www.nasa.gov/international-space-station/space-station-facts-and-figures/
- NASA. Spot the Station frequently asked questions. https://www.nasa.gov/missions/station/spot-the-station-frequently-asked-questions/
- NASA. Spot the Station. https://spotthestation.nasa.gov/
- NASA. Vanguard satellite, 1958. https://www.nasa.gov/image-article/vanguard-satellite-1958/
- NASA History. Sputnik and the origins of the Space Age. https://www.nasa.gov/history/sputnik/
- NASA NSSDCA. Sputnik 1. https://nssdc.gsfc.nasa.gov/nmc/spacecraft/display.action?id=1957-001B
- NASA NSSDCA. LAGEOS 1. https://nssdc.gsfc.nasa.gov/nmc/spacecraft/display.action?id=1976-039A
- GPS.gov. Space segment. https://www.gps.gov/space-segment
- ESA. Types of orbits. https://www.esa.int/Enabling_Support/Space_Transportation/Types_of_orbits
- NASA Earth Observatory. Catalog of Earth satellite orbits. https://science.nasa.gov/earth/earth-observatory/catalog-of-earth-satellite-orbits
- Kidder, S. Q. and Vonder Haar, T. H. (1990). On the use of satellites in Molniya orbits for meteorological observation of middle and high latitudes (notes and correspondence, June 1990; CIRA copy). https://cat.cira.colostate.edu/kidder/Molniya.pdf
- ESA. Envisat. https://www.esa.int/Applications/Observing_the_Earth/Envisat
- NASA. Hubble Space Telescope overview. https://science.nasa.gov/mission/hubble/overview/
- Ricker, G. R. et al. (2015). The Transiting Exoplanet Survey Satellite. Journal of Astronomical Telescopes, Instruments, and Systems 1: 014003. https://doi.org/10.1117/1.JATIS.1.1.014003
- McDowell, J. C. (2020). The low Earth orbit satellite population and impacts of the SpaceX Starlink constellation. ApJL 892: L36. https://doi.org/10.3847/2041-8213/ab8016
- Tyson, J. A. et al. (2020). Mitigation of LEO satellite brightness and trail effects on the Rubin Observatory LSST. AJ 160: 226. https://doi.org/10.3847/1538-3881/abba3e
- Hainaut, O. R. and Williams, A. P. (2020). Impact of satellite constellations on astronomical observations with ESO telescopes in the visible and infrared domains. A&A 636: A121. https://doi.org/10.1051/0004-6361/202037501
- Walker, C. et al. (2020). Impact of satellite constellations on optical astronomy and recommendations toward mitigations (SATCON1). NSF NOIRLab and AAS. https://aas.org/sites/default/files/2020-08/SATCON1-Report.pdf
- Dang, T. et al. (2022). Unveiling the space weather during the Starlink satellites destruction event on 4 February 2022. Space Weather 20. https://doi.org/10.1029/2022SW003152
- Fang, T.-W. et al. (2022). Space weather environment during the SpaceX Starlink satellite loss in February 2022. Space Weather 20(11). https://doi.org/10.1029/2022SW003193
- FCC (2022). Space Innovation; Mitigation of Orbital Debris in the New Space Age, Second Report and Order, FCC 22-74. https://docs.fcc.gov/public/attachments/FCC-22-74A1.pdf
More exhibits
Your weight and jump height on other planets and moons
A 50 cm jump on Earth becomes a 3 m leap on the Moon, 18 m on Ceres and a one-way trip off asteroid Bennu.
Walk the Apollo landing sites
Standing on the Moon with your eyes 1.6 m up, the horizon is only about 2.4 km away. All six Apollo landing sites are here, from Tranquility Base to Taurus-Littrow.
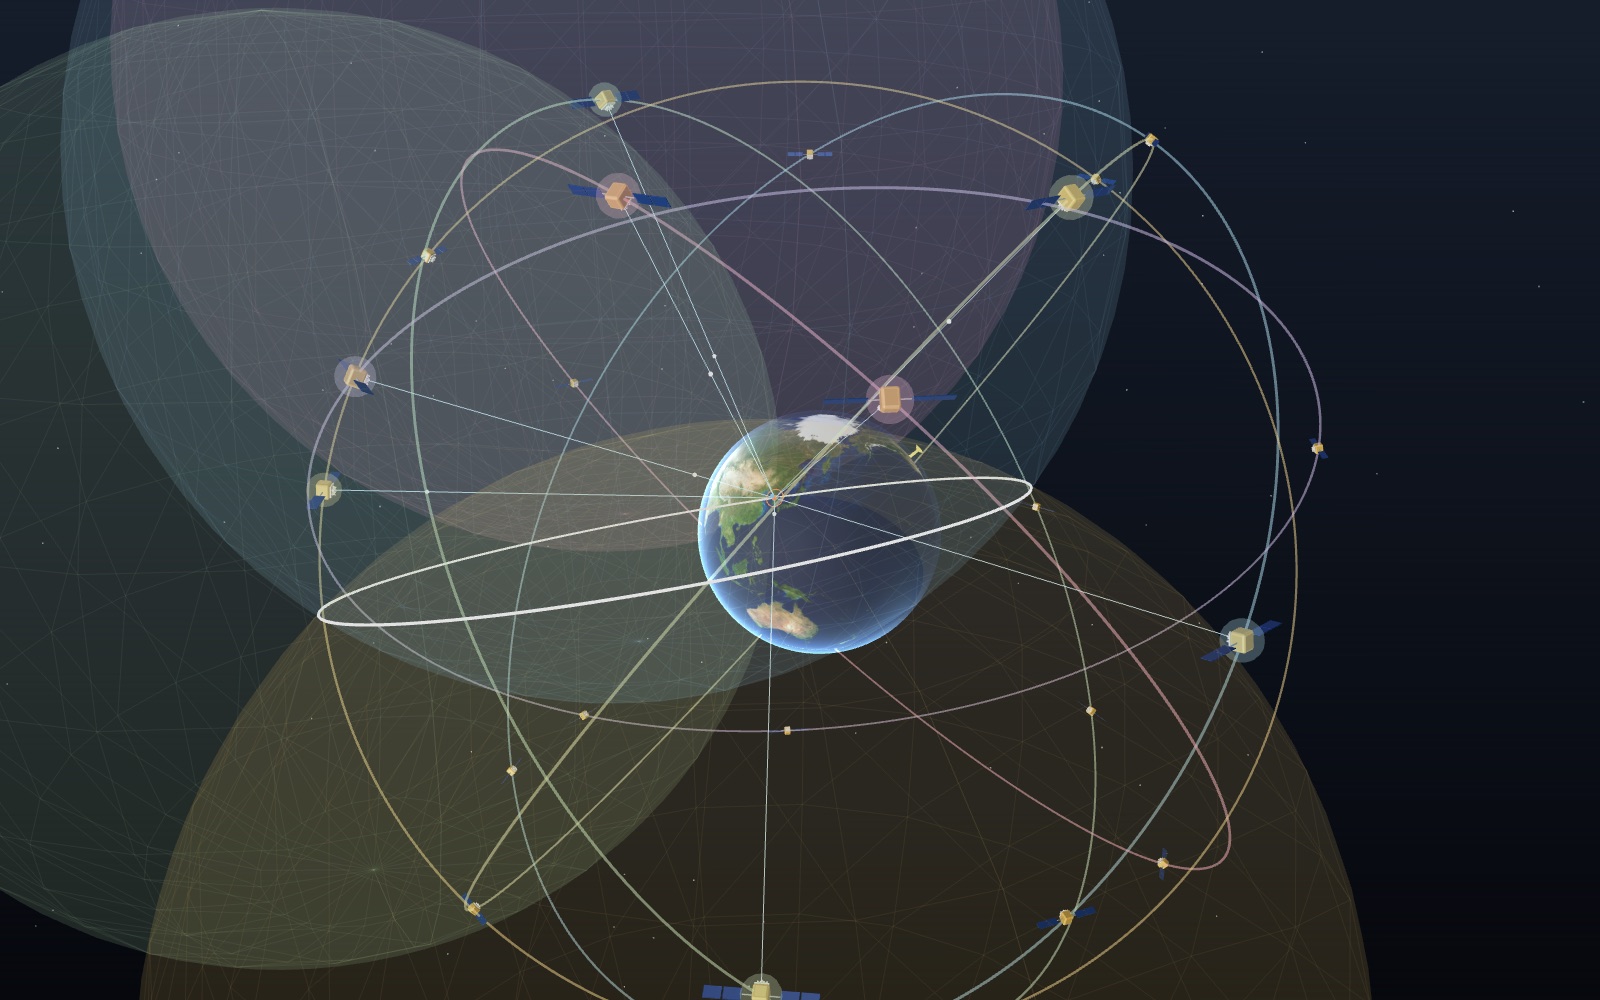
How GPS works: why your phone needs four satellites
A GPS signal takes about 70 thousandths of a second to fall 20,200 km to your phone, and a millionth of a second of error moves you 300 m.
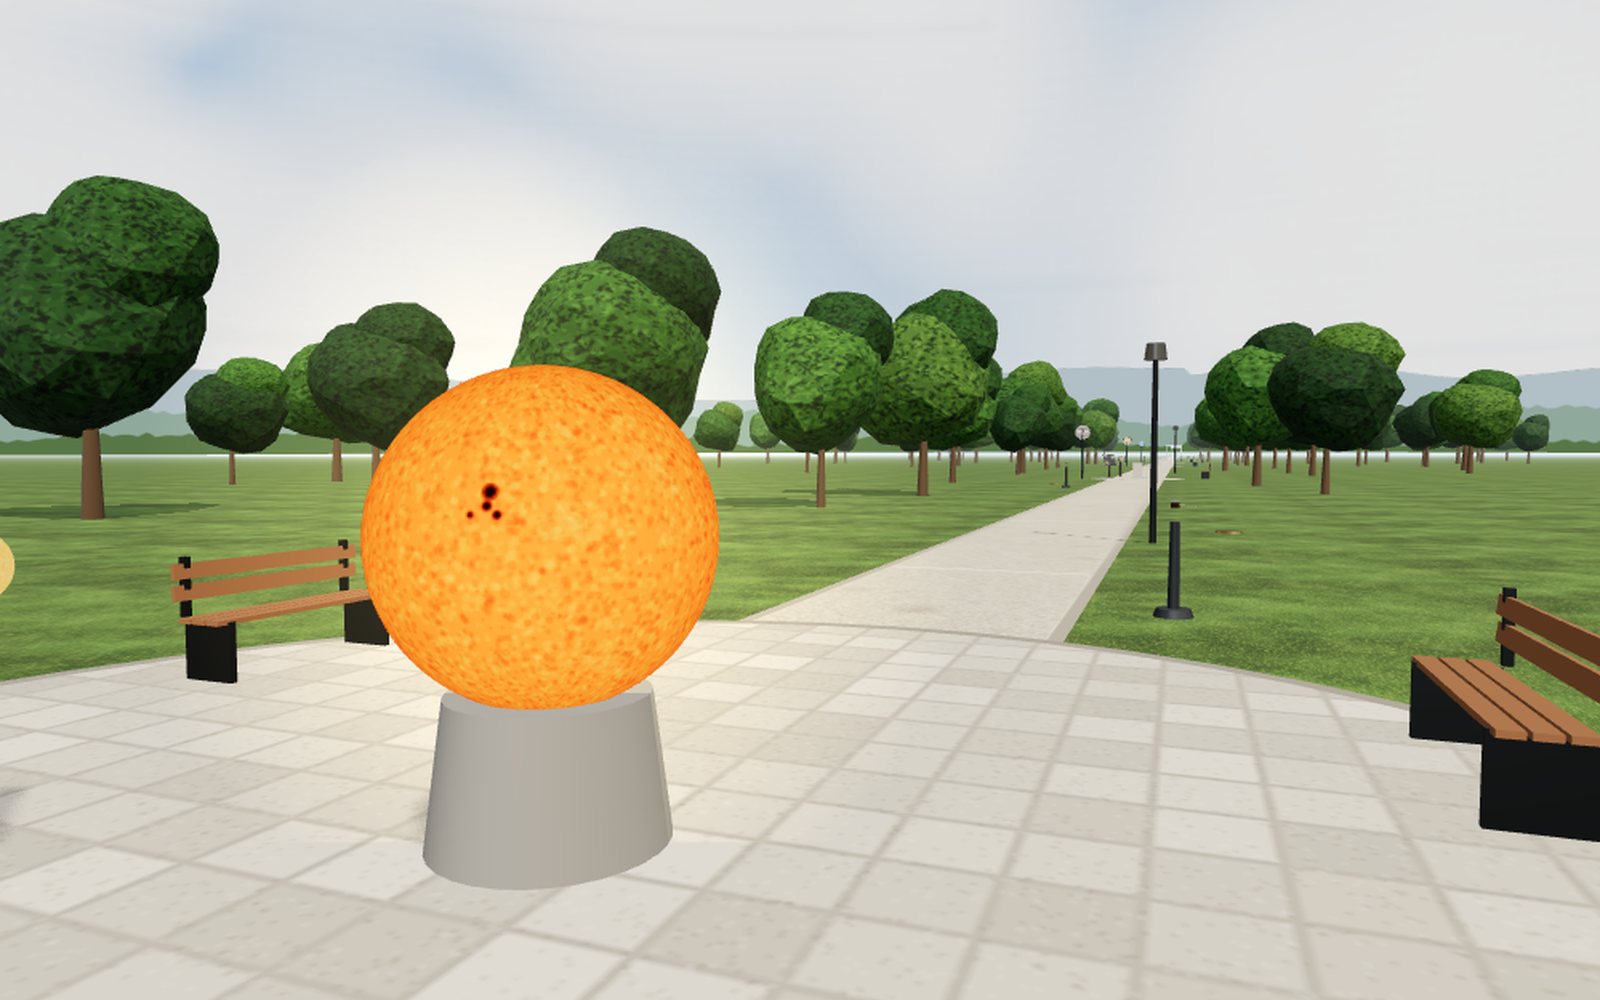
Solar system scale model measurements along a park walk
Shrink the Sun to a ball 1.39 m wide and Earth becomes a 1.27 cm marble 150 m down the path, Neptune is 4.5 km away and Voyager 1 would be 25.7 km.
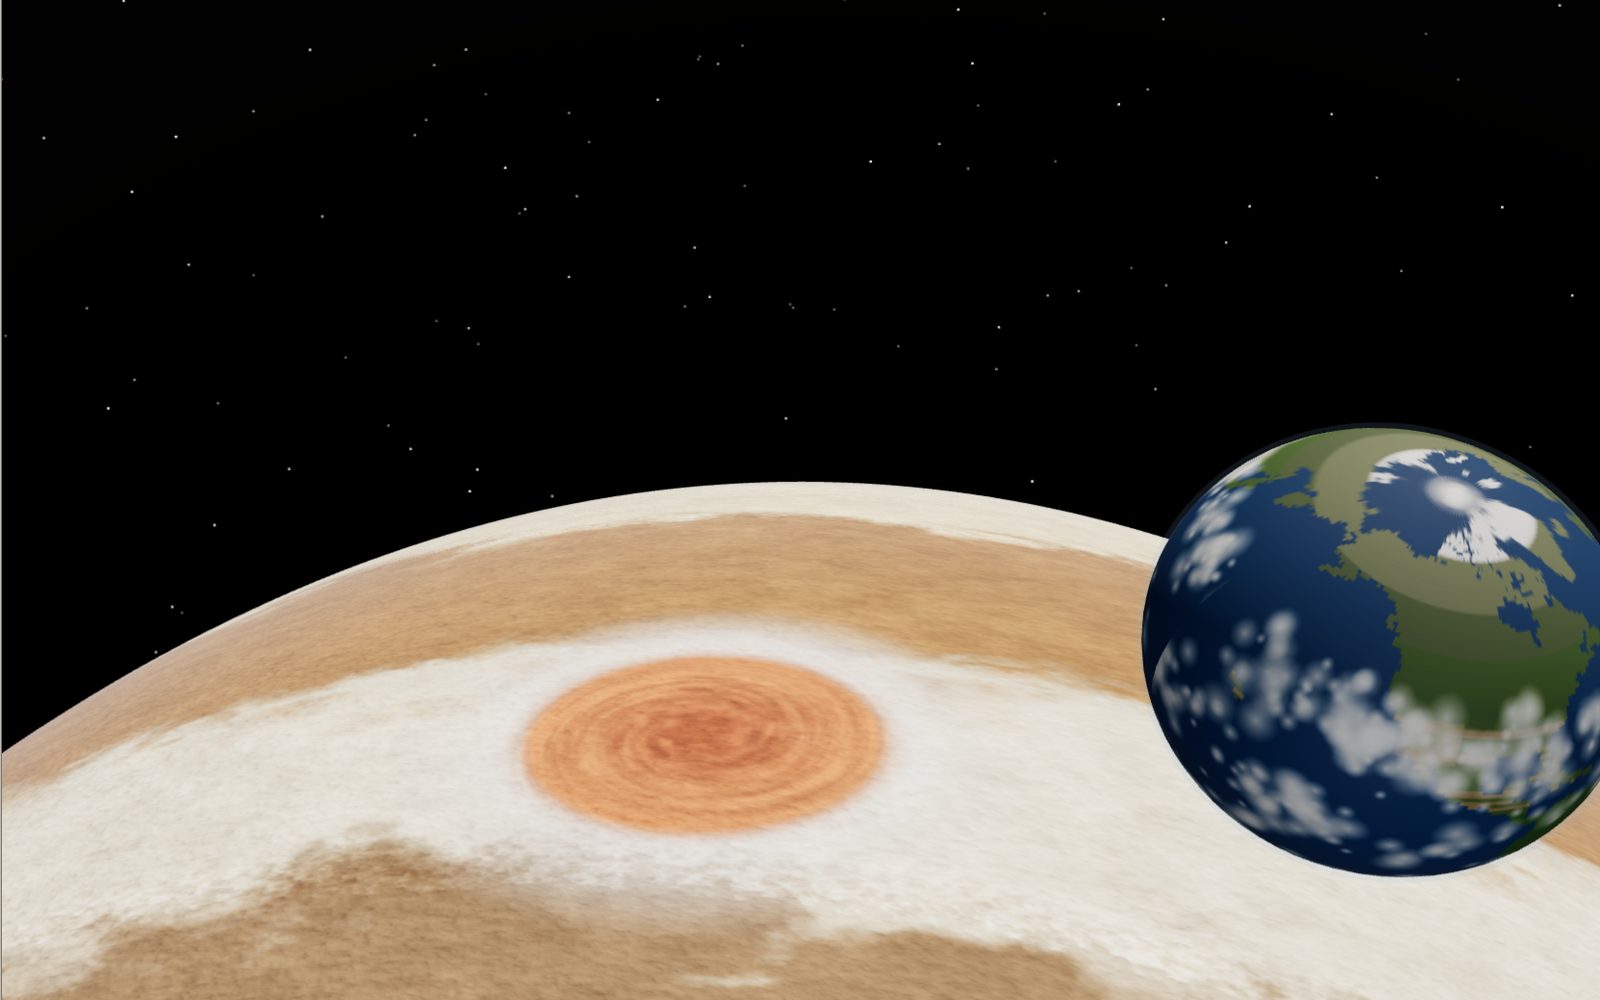
Fly over Jupiter's clouds and the Great Red Spot
In the late 1800s the Great Red Spot was about three Earths long; Hubble now measures it at about one. Float over it with Earth beside you, then sink 132 km into the clouds with the Galileo probe.
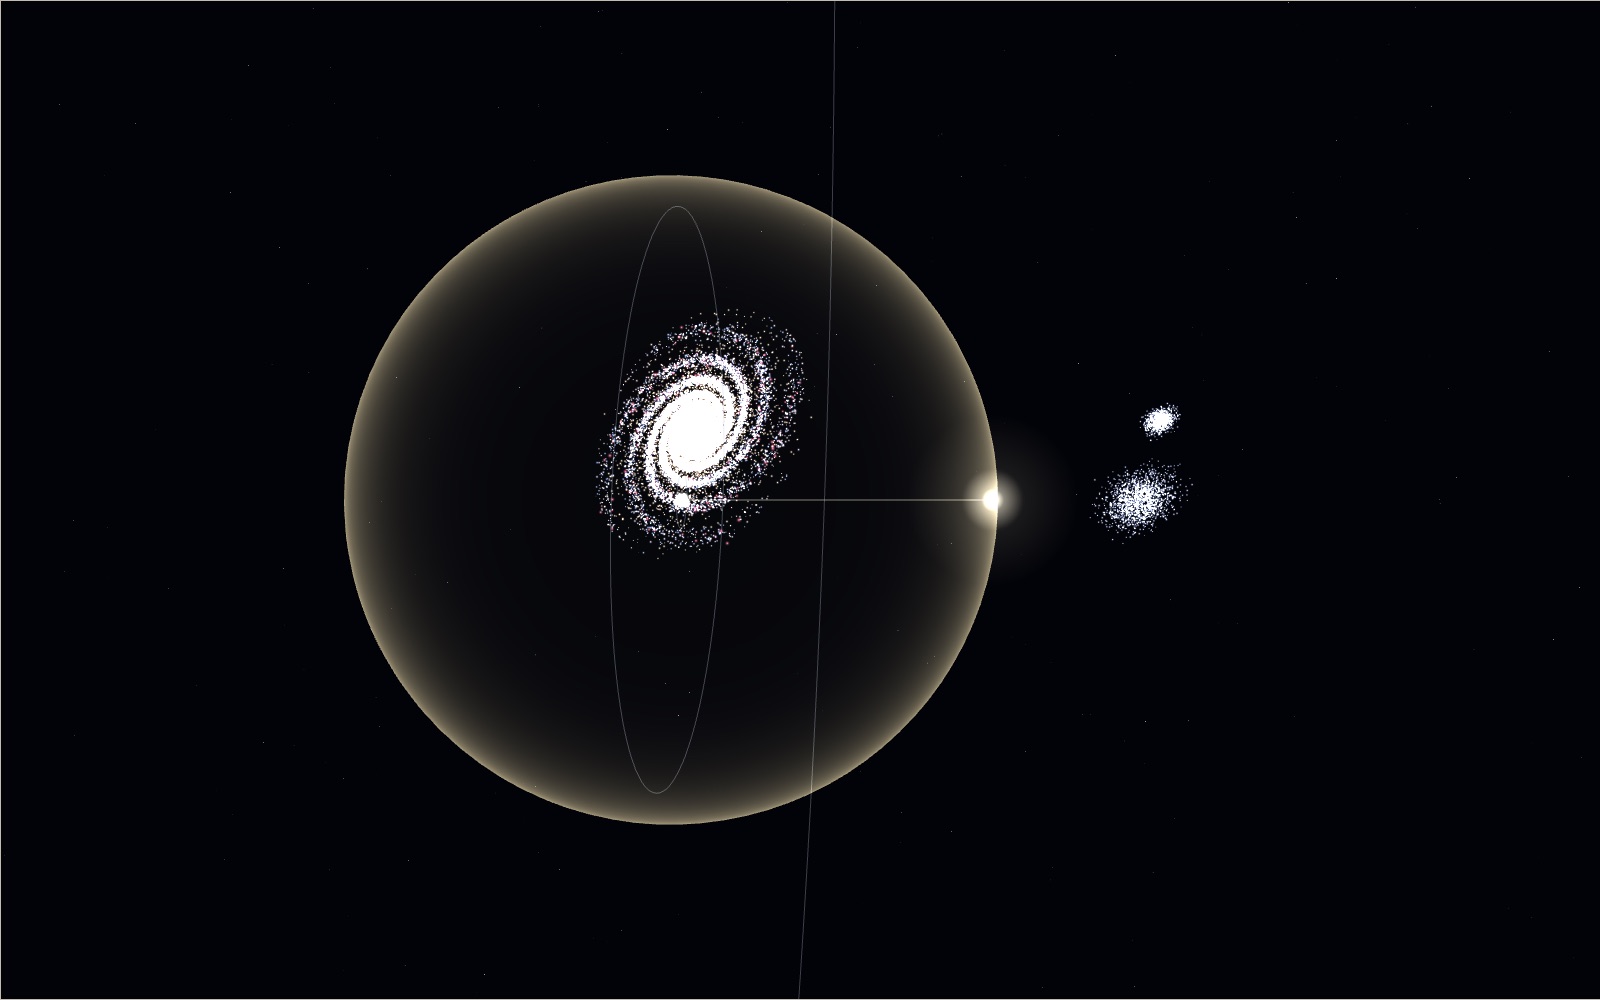
Travelling at the speed of light
Light goes round the equator 7.5 times in a second, yet the same light needs 2.5 million years to reach the Andromeda galaxy.