FIG. 97Walk-throughs
Fly over Jupiter's clouds and the Great Red Spot
In the late 1800s the Great Red Spot was about three Earths long; Hubble now measures it at about one. Float over it with Earth beside you, then sink 132 km into the clouds with the Galileo probe.
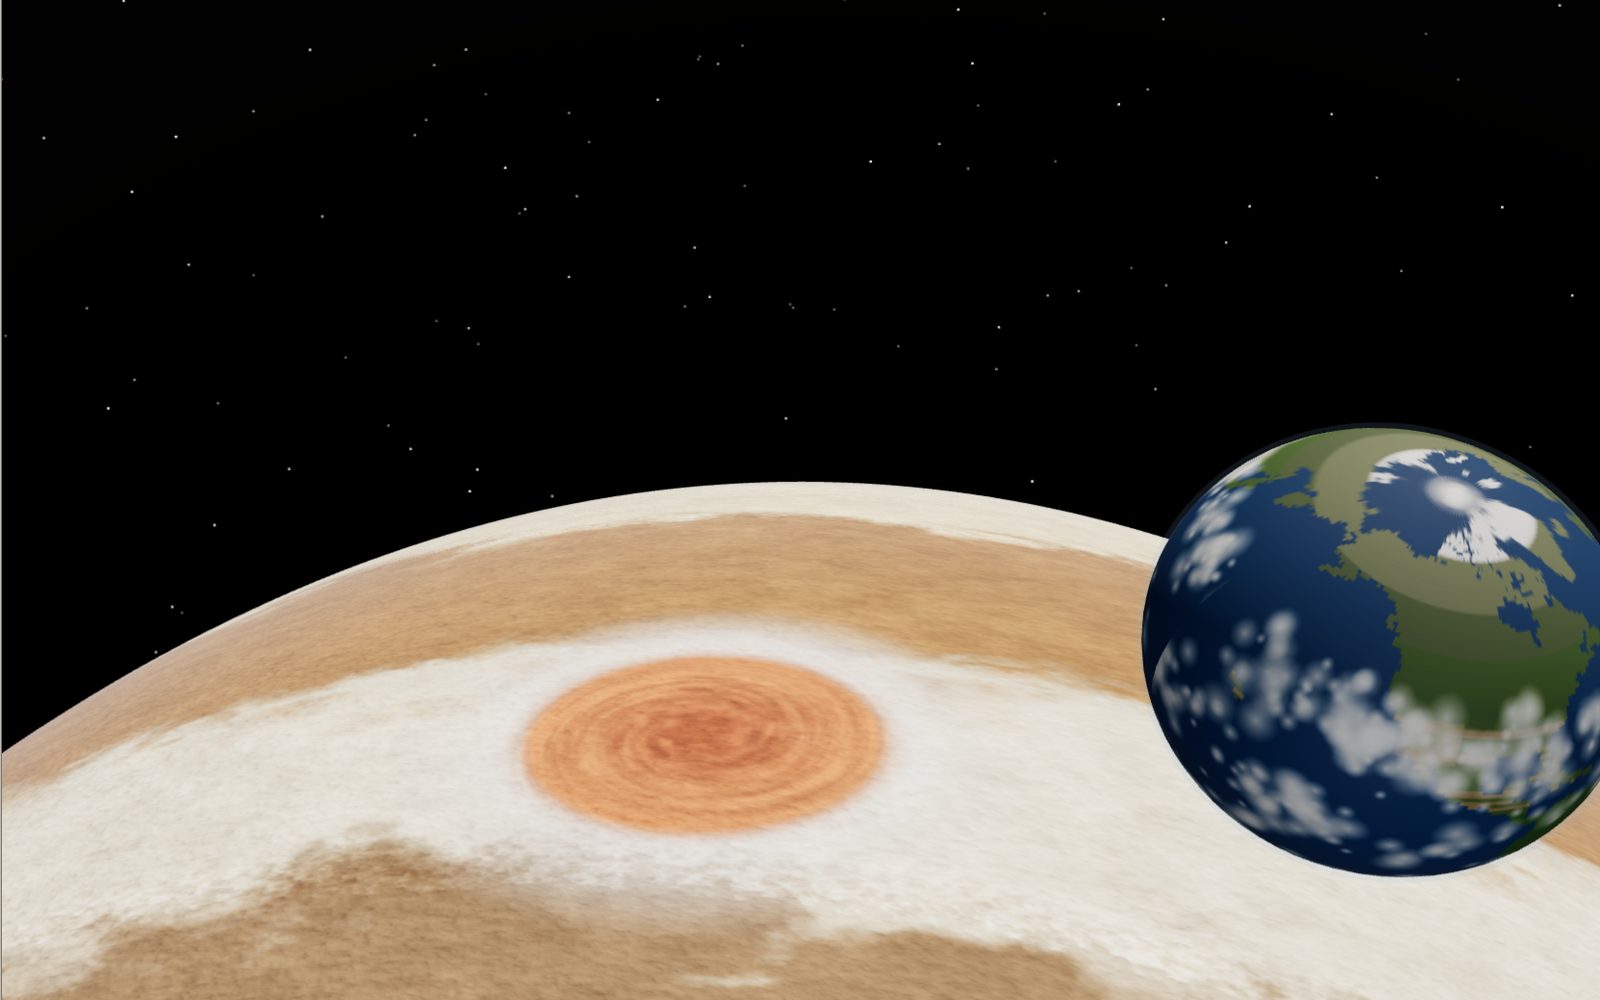
This device cannot show the 3D model. You can read the guide steps below as text.
1 / 16 Earth beside the Great Red SpotYou are 30,000 km above Jupiter. The red oval is the Great Red Spot, and the blue ball beside it is Earth at the same scale. In Hubble images from 2023 and 2024 the storm is about 13,600 km long, a little more than one Earth.
Drag to turn. Scroll or pinch to zoom.
Floating 30,000 km above Jupiter
Jupiter has no ground. Everything you see in photographs of it is cloud: bands of cream, tan and brown, white ovals, a red storm wider than our planet. This exhibit puts you above those clouds. You start 30,000 km up, looking down at the Great Red Spot, with Earth floating beside it at the same scale. From there you can sink to the cloud tops, ride the fastest wind on the planet, watch lightning at night, look at the cyclones that ring the north pole, and then go down through the cloud layers along the path the Galileo probe took in 1995, until the point where its radio fell silent.
Heights on the stage are measured from the "1-bar level", the height where the air pressure equals the average pressure at sea level on Earth. Planetary scientists use it as Jupiter's stand-in for sea level, because there is no surface to measure from. The visible cloud tops sit a little above it, about 10 km up in this model. Negative heights are below it, inside the clouds.
Six areas take you to the main sights: the Great Red Spot, the jet stream at 24° N, the north pole, a stormy belt at 47° N, the Galileo probe's entry point, and the evening sky over the equator. A person 1.7 m tall stands on an imaginary platform in front of you whenever you are close to the clouds, so you always have something your own size to compare with, and a scale bar in the corner turns the distance in view into a number of people lying head to foot. There are 23 hidden finds, 14 "Actually…" cards and 13 challenges. The numbers on the readout, the cards and this page come from NASA, its laboratories and published papers, listed at the end.
How big is the Great Red Spot?
The Great Red Spot is an anticyclone, a high-pressure storm, sitting about 22° south of the equator. It turns counterclockwise once every few days. Its size has been measured for more than a century, and the numbers tell a clear story.
| Year | Long axis | Earths (12,742 km) | Measured by |
|---|---|---|---|
| late 1800s | about 41,000 km | 3.2 | historic telescope observations |
| 1979 | 23,300 km | 1.8 | Voyager 1 and 2 |
| 1995 | 21,000 km | 1.6 | Hubble |
| 2009 | 17,900 km | 1.4 | Hubble |
| 2014 | 16,500 km | 1.3 | Hubble |
| 2017 | 16,350 km | 1.3 | Juno |
| 2020 | about 15,770 km | 1.2 | Hubble |
| 2023 to 2024 | 12,881 to 14,233 km, about 13,600 km on average | 1.1 | Hubble |
Earth's diameter is 12,742 km. In the late 1800s you could have laid three Earths side by side along the storm with room to spare. Today a single Earth nearly covers it. The year slider in the controls redraws the storm at the size measured for any year from the late 1800s to 2024, and the Sizes panel plots the same table against bands one, two and three Earths wide.
The storm's north-south width has shrunk too, but more slowly. A 2018 study of more than 150 years of measurements found the long axis shrinking by about 0.194 degrees of longitude per year and the width by about 0.048 degrees of latitude per year. The stage uses that ratio to draw the width for years when only the length was recorded, and the card says so. In the eight Hubble visits between December 2023 and March 2024 the red oval averaged about 13,600 by 9,900 km.
A storm that is shrinking
NASA first drew wide attention to the shrinking in 2014, when Hubble images showed the spot at about 16,500 km, the smallest ever measured at the time. Amateur astronomers had noticed in 2012 that the shrinking was speeding up, by roughly 930 km a year, and the storm was changing from an oval to something closer to a circle.
Why it shrinks is still an open question. One idea is that small eddies feeding into the storm change how much energy and momentum it receives. Another is that the jets around it slowly squeeze it. None of these is settled, and the stage does not pretend otherwise.
Hubble's latest look added a surprise. Over 90 days, from December 2023 to March 2024, the spot changed size and shape in a regular rhythm, wobbling like a bowl of jelly while its drift in longitude sped up and slowed down with the same 90-day period. Astronomers had known about the drift oscillation for decades; the size change was new. The team expects the storm to keep shrinking until it fits more snugly between the jets on either side, and then perhaps to settle at a stable, rounder shape.
While it shrank, its winds sped up. Hubble wind maps from 2009 to 2020 show the "high-speed ring" just inside the edge of the storm getting up to 8 percent faster, with average speeds above 640 km/h (400 mph). The centre of the storm turns much more slowly. Fly low over the middle of the spot to find that quiet core, one of the hidden finds.
Is it the storm Cassini saw?
Many books say the Great Red Spot has been watched since the 1600s. In 1665 the astronomer Giovanni Domenico Cassini saw a dark oval at about the same latitude, later called the "Permanent Spot", and others followed it until 1713. Then the records go quiet for more than a century.
A 2024 study went back through the old drawings and measurements. Comparing the size and the drift of Cassini's spot with the storm we know, it concluded that the Permanent Spot probably faded away, and that today's Great Red Spot was first seen in 1831. The study also used computer models to test how a storm like this could form, and found that a long, shallow, slow circulation between the two opposing jets north and south of it fits better than a merger of smaller storms. If that is right, the young Great Red Spot spun slowly, and its winds have picked up as it has shrunk. This is one of the "Actually…" cards: the storm is old, but probably not as old as the textbooks say.
Wide but thin
The Great Red Spot is wider than Earth, so how deep does it go? Two Juno experiments, published together in 2021, answered from two directions.
Juno's microwave radiometer looks down through the clouds at different depths depending on the radio frequency. It found that the storm's roots go below the levels where water and ammonia are expected to condense, so the storm is connected to the deeper atmosphere rather than being a pattern in the top cloud deck alone. Juno's gravity experiment measured the tiny tug of the storm's extra mass on the spacecraft during two passes right over it. That signal limits the depth: the Great Red Spot is contained within the top 500 km of the atmosphere.
That makes the storm about 27 times wider (13,600 km) than it is deep (500 km at most). A pizza 27 cm across and 1 cm thick has the same proportions. Jupiter's radius is 71,492 km, so even the deepest storm reaches less than 1 percent of the way to the centre.
Why is it red?
Nobody knows for sure. The colour sits high in the storm, in the haze above the main clouds, where sunlight is strong. One laboratory study shined ultraviolet light on ammonia mixed with acetylene, two gases found in Jupiter's upper atmosphere, and got reddish compounds with colours close to the spot's. It is a strong candidate, not a final answer. The colour also changes: in some years the spot is a pale salmon, in others deep brick red, and Hubble has measured the storm getting darker in blue light and brighter in near-infrared light since 2014, a sign that the high haze is changing. The stage paints the spot in a model colour; the card about colour lists the studies.
Smaller storms you can find
The Great Red Spot is the largest of many storms. Slide the year slider and the map around it changes too, because several neighbours have their own histories.
Oval BA sits south of the Great Red Spot at about 33° S. It began as three white ovals that had circled the planet for decades. Between 1998 and 2000 they merged into one, and by 2006 the merged storm had turned red, the first time anyone had watched a red spot form. Hubble photographed it, and astronomers nicknamed it "Red Spot Jr."; it is about half as wide as its big neighbour. In later years it faded toward white and darkened again. Set the year before 2000 to see the three white ovals, and after 2005 to see the red one.
Farther south, at 40° S, a row of white anticyclones circles the planet: the "String of Pearls". Juno photographed eight of them in 2017. North of the equator, just above the dark North Equatorial Belt, a long-lived white storm called White Spot Z was photographed on Juno's 21st close pass in 2019.
Some storms are new. On 31 May 2020 the amateur astronomer Clyde Foster, imaging Jupiter from South Africa, spotted a bright plume in the South Temperate Belt that had not been there hours earlier. Two days later Juno flew past and photographed it, and the plume became known as "Clyde's Spot". It appears on the stage from 2020 onward. Bright plumes also burst out next to the 24° N jet every few years, and one of those outbreaks is a find in the jet area.
Comet scars of 1994
In July 1994, more than twenty pieces of comet Shoemaker-Levy 9 hit Jupiter's southern hemisphere one after another. Each impact left a dark brown scar in the clouds, visible from Earth with small telescopes for months. The scar from fragment G had a dark centre 2,500 km across, inside a thin dark ring 7,500 km across: larger than many countries, though smaller than Earth. Set the year to 1994 and look south of the Great Red Spot to find the row of scars. Their exact positions on the stage are a model; their sizes follow the NASA image of fragment G.
Belts, zones and jet streams
Look at Jupiter from far away and you see stripes. The light stripes are called zones and the dark ones belts. Zones are usually higher, colder clouds of ammonia ice; belts are places where you see deeper, browner layers. Between them run jet streams, narrow bands of wind that blow east or west and keep their latitudes for decades. Cassini, Voyager and Hubble have tracked them by following cloud features from one image to the next.
The strongest eastward jet at the cloud tops sits at about 24° N. Hubble measurements from 2008 to 2016 put its peak at 144 to 160 m/s, which is about 520 to 580 km/h. It slows down after the big outbreaks of bright plumes that erupt beside it every few years: after the outbreak of October 2016 it dropped from about 160 to 144 m/s. On Earth, a Category 5 hurricane begins at 70 m/s (157 mph). Jupiter's ordinary jet is more than twice as fast, and it never stops.
The equator has its own surprises. At the visible cloud level the wind there blows at about 250 km/h. In 2023 the James Webb Space Telescope found a narrow jet 25 to 50 km higher up, in the lower stratosphere, blowing at about 515 km/h, twice as fast as the clouds below it.
The "Wind lines" control draws the jets on the clouds as moving streaks: orange for eastward, blue for westward. The little chart that appears with it shows the wind against latitude, with a red dot for where you are. The profile on the stage is a smooth model drawn through the main peaks Hubble measured; the readout labels it as a model.
How deep do the winds go?
When the Galileo probe fell through the atmosphere in 1995, the small changes in its radio frequency told scientists how fast the wind was pushing it sideways. Below the cloud tops the wind grew stronger, reaching about 170 m/s at 4 bar, and then stayed that fast all the way down to about 21 bar, where the probe stopped working. The winds were not a thin skin of weather; they were deep.
Juno later measured how much the jets bend Jupiter's gravity field. The answer, published in 2018, is that the jet streams extend about 3,000 km down, where the hydrogen starts to conduct electricity and the flow is dragged into turning with the planet. Compared with the Great Red Spot's 500 km, that is six times deeper. These are two of the "Actually…" cards.
Riding the jet
Turn on "Ride the wind" over the jet at 24° N and the clouds carry you east. The arithmetic is simple. At 150 m/s the jet covers 540 km in an hour, so 1,000 km takes a little under two hours. The time-lapse control speeds the clouds and your drift by 1 to 30,000 times so you do not have to wait. One of the challenges asks you to ride 1,000 km.
Most features on Jupiter drift with the jet at their latitude, so the map you see is a snapshot. The positions of Oval BA, the white ovals and the storm towers on the stage are model positions; the cards give the latitude and date of the real observations instead.
Storms at the poles
Before Juno arrived in July 2016, no spacecraft had looked straight down on Jupiter's poles. What Juno found was unlike anything else known. At the north pole, one cyclone sits at the pole and eight more circle it, each 4,000 to 4,600 km across, packed so tightly that their spiral arms touch. At the south pole, five cyclones of 5,600 to 7,000 km circle a central one. Each one would cover a large country. Winds in them reach about 350 km/h.
The pattern has stayed in place year after year, which surprised scientists who expected such storms to wander, merge or die. Then, in November 2019, Juno saw a sixth cyclone slip into a gap in the southern ring, smaller than the others, about the size of Texas, turning the pentagon into a hexagon. Later the ring went back to five. Set the year to 2019 or 2020 to see the sixth cyclone; it is one of the finds.
The pole area shows the cyclones in infrared, as Juno's JIRAM camera sees them at a wavelength of about 5 microns. In that light, thick clouds look dark and thin clouds glow, because heat from deeper down escapes through the gaps. JIRAM measured brightness temperatures from about 190 K (−83 °C) in the coldest, highest clouds to about 260 K (−13 °C) where it sees deepest. Turn on "Infrared (5 µm)" anywhere on the planet to switch views.
Lightning, shallow lightning and mushballs
Voyager 1 saw lightning on Jupiter's night side in 1979. For decades its radio signals seemed odd, until Juno's microwave radiometer picked up lightning at 600 MHz, the same kind of radio crackle Earth's lightning makes. In its first eight orbits it recorded 377 flashes. They were mostly near the poles, more in the north, and none near the equator. On Earth it is the other way round: lightning is most common in the tropics, where sunlight heats the ground. Jupiter's storms run on heat from inside the planet, and that heat seems to rise more easily near the poles.
Juno found a second kind of lightning too. Small flashes come from high in the clouds, about 25 km above the water clouds, where the air is colder than −88 °C. Liquid water should not exist there. The explanation is ammonia: at those heights it acts like antifreeze, melting ice crystals thrown up by storms into droplets of water and ammonia. The droplets and ice collide and build up charge, and the result is "shallow lightning", from a kind of cloud Earth does not have.
The same storms probably make hail of a strange kind. Juno scientists call them "mushballs": slushy balls of water and ammonia with a crust of ice, growing as they bounce up and down in the storm, then falling deep and taking ammonia with them. That would explain why Juno's microwave radiometer finds less ammonia high in the atmosphere than expected. The stage shows the hail as falling grains under the storm towers; go below a tower in the storm area to find it.
Far above the storms, Juno's ultraviolet spectrograph caught 11 brief bright flashes, each lasting only a few thousandths of a second, about 260 km above the 1-bar level. They look like sprites and elves, flashes known from Earth that are set off by powerful lightning far below. In Earth's nitrogen-rich air sprites are red; in Jupiter's hydrogen they would probably look blue or pink. The stage shows them now and then at night above the storm area.
The storm area itself is a model: tall towers at 47° N that flash with lightning at night and dusk. Real Jovian thunderstorms can be thousands of kilometres across and their clouds can rise far above the main deck; the sizes on the stage are chosen to be seen, not measured.
Going down: what the Galileo probe measured
On 7 December 1995 a probe released from the Galileo spacecraft five months earlier hit Jupiter's atmosphere at 47.6 km/s, at 6.5° N and 4.4° W. The shock wave in front of it glowed brighter than the Sun's surface. About two minutes later, slowed by its heat shield, it opened a parachute and began a slow fall through the clouds. NASA's records describe 58 minutes of useful data before the radio link ended; the probe was 1.27 m across and weighed 339 kg at launch.
Its Atmospheric Structure Instrument measured temperature and pressure the whole way down. Those numbers are on the stage. When you go below about 160 km above the 1-bar level, the readout's pressure and temperature are read from the probe's own data, archived in NASA's Planetary Data System, not from a model. A few values from that record:
| Height above 1 bar | Pressure | Temperature |
|---|---|---|
| +60 km | 0.044 bar | −151 °C |
| +30 km | 0.24 bar | −163 °C |
| 0 km | 1.0 bar | −107 °C |
| −20 km | 2.0 bar | −66 °C |
| −54 km | 5 bar | about 3 °C |
| −80 km | 8.8 bar | 53 °C |
| −100 km | 12.9 bar | 92 °C |
| −132 km | 22 bar | 155 °C |
The coldest air is near the top, around 0.2 bar, at about 110 K (−163 °C). Below that it warms steadily, by about 2 °C for every kilometre down, close to the rate gas warms when it is squeezed without gaining or losing heat. At 5 bar, 54 km below the 1-bar level, the temperature passes freezing. The last values were recorded at 22 bar and 428 K, 155 °C, 132 km below the 1-bar level. The "Ride down with the Galileo probe" button in the Inside panel replays that descent at sixty times its real speed, a minute per second, with the probe hanging under its parachute beside you.
Three cloud decks, and the one the probe missed
A standard model of Jupiter's clouds, built from what gases should condense at what temperatures, predicts three main decks. The top one, at about 0.5 to 0.7 bar, is ammonia ice; it is the white cloud you see from Earth. The middle one, at about 1.5 to 2.2 bar, is ammonium hydrosulfide, a compound of ammonia and hydrogen sulfide, tinted tan and brown. The deepest, at about 5 to 7 bar, is water: ice above, droplets below, and the source of the big thunderstorms. Using the probe's own pressure and height record, the water deck would sit 54 to 69 km below the 1-bar level.
Go down in the area "Under the clouds" and the stage puts those three decks around you, with their model levels; you pass through each as a short white-out. The readout names the layer you are in.
The probe itself did not see this neat stack. Its nephelometer found only the thin lower edge of the ammonia cloud between about 0.46 and 0.55 bar, a modest layer between 0.76 and 1.34 bar that fits ammonium hydrosulfide, and no thick water cloud at all. Its mass spectrometer found far less water than expected. The reason is where it fell. Observations from Earth showed that the probe entered a 5-micron hot spot, a clear, dry patch on the edge of the North Equatorial Belt, about 900 km inside its southern boundary. Hot spots are among the clearest and driest places on Jupiter. So the probe's result says a lot about hot spots and less about the whole planet; this is the "dry patch" card.
How Juno sees under the clouds
Cameras only see cloud tops. To look deeper, Juno uses a microwave radiometer: radio waves of longer wavelength come from deeper layers, so six channels together sample the atmosphere from the cloud tops down to hundreds of kilometres. Its first passes, published in 2017, showed that ammonia is not spread evenly. There is a plume of ammonia-rich air rising at the equator and drier air in many other places, down to depths far below the clouds. The mushball idea and shallow lightning grew from trying to explain where the missing ammonia goes.
Juno's gravity science tracks tiny changes in the spacecraft's speed with radio signals sent to Earth. Those changes revealed the depth of the jets, the shallow base of the Great Red Spot and the dilute core. Its magnetometer mapped the magnetic field and found a surprise near the equator: an intense, isolated patch of magnetic field, nicknamed the Great Blue Spot, which Jupiter's deep winds slowly pull east and west. It is invisible in any picture of the clouds; it appears on the stage only as one of the cards.
There is no ground
Keep pressing Down and you stop at 132 km below the 1-bar level, where the probe's data end. That is only about 0.2 percent of the way to Jupiter's centre. Nothing solid waits below. The gas grows hotter and denser, and thousands of kilometres down, hydrogen is squeezed so hard that it conducts electricity like a metal. Juno's measurements of Jupiter's gravity fit best with a "dilute" core: heavier elements mixed through a large part of the planet's interior instead of a small rocky ball at the centre. The depths of these layers come from models, not direct measurement, and the Inside panel draws them to scale along the radius with that warning.
This is the first "Actually…" card many visitors find: a planet you cannot land on, because there is nowhere to stand.
What the air is made of
The Galileo probe sampled the gas directly. Its helium experiment measured a helium fraction of 13.6 percent of the molecules; almost all of the rest is hydrogen. The probe's mass spectrometer measured methane, ammonia, hydrogen sulfide and water, and found some noble gases more enriched than expected. The clouds that give Jupiter its colours come from a tiny remainder: ammonia, ammonium hydrosulfide and water make up well under one percent of the gas.
Jupiter makes its own heat
Jupiter is five times farther from the Sun than Earth is, and sunlight there is weak: about 50 W per square metre, against 1,361 at Earth. Yet Jupiter is warmer than sunlight alone would make it. Measurements from the Cassini spacecraft, published in 2018, found that Jupiter reflects about half of the sunlight that reaches it and gives off about 7.5 W per square metre of heat from inside. Put together, it radiates about 2.2 times the energy it absorbs from the Sun. That inner heat, left over from the planet's formation and from slow contraction, drives the storms and is one reason the lightning gathers at high latitudes. Turn on infrared to see where the heat escapes.
Aurora and Io's footprint
Jupiter has the brightest aurora in the Solar System. Like Earth's, it forms when charged particles stream along the magnetic field into the upper atmosphere around the magnetic poles. Hubble's ultraviolet images show it more than a thousand times brighter than auroras on Earth. Most of that light is ultraviolet and infrared, which our eyes cannot see, so the curtains on the stage are drawn in false colour. Juno's infrared camera mapped the main ovals and the "footprints" of Io, Europa and Ganymede: bright spots where the electric currents linking each moon to Jupiter reach the atmosphere. Io's footprint has a tail that lingers for about three hours after the moon's magnetic connection has moved on.
The aurora on the stage sits at a model height of a few hundred kilometres above the clouds, on ovals a few degrees from the pole. Turn on "Aurora" and fly over the north pole at night to find Io's footprint.
The sky from the cloud tops
The evening sky over the equator holds four big moons, and their sizes are true to scale. Io, 3,643 km across and 421,800 km from Jupiter's centre, spans 0.60° seen from the cloud tops, a little more than our Moon seen from Earth (0.52°). Ganymede is the biggest moon in the Solar System, 5,262 km across, but it is 1,070,400 km from Jupiter's centre, so it looks no bigger than Europa: both span about 0.30°. Callisto, the outermost of the four, spans 0.15°. That is why the challenge "Biggest in the sky" has the answer it does.
Smaller moons are there too. Amalthea, a reddish potato about 250 km long, orbits only 181,400 km from the centre and shows as a tiny red speck. The rings are faint: the main ring lies 123,000 to 128,940 km from the centre, with a fainter halo inside it and wispy outer rings beyond. From the equator the ring plane passes overhead, so the ring crosses the sky as a thin pale line through the zenith.
The Sun is small and dim from here. It spans about 0.10°, one fifth of what we see from Earth, and gives about 1/27 as much light. A day lasts 9 hours and 55 minutes, so sunsets come quickly; the "Run the clock" control runs one Jupiter day per minute. Earth is up there too, as a blue-white dot. Because Earth's orbit is so much smaller than Jupiter's, it never strays more than 11° from the Sun, so you can only catch it in twilight, just after sunset or before sunrise.
When Io passes between the Sun and Jupiter, its shadow sweeps across the clouds as a black spot about as wide as Io itself. Anyone floating inside that shadow would see a total eclipse of the Sun, because Io looks about six times wider than the Sun from there. The last step of the tour shows one, seen from 60,000 km up.
You on Jupiter
Jupiter has 318 times the mass of Earth, so people often guess they would weigh 318 times as much. They would not, because at the cloud tops you are also 11 times farther from the planet's centre, and gravity weakens with the square of the distance. NASA gives the acceleration at the 1-bar level as 23.12 m/s² at the equator, where the fast spin flings things outward a little, and 27.01 m/s² at the poles, against 9.82 m/s² on Earth. A bathroom scale that reads 60 kg on Earth would read about 141 kg at Jupiter's equator and 165 kg at the poles.
The You panel does the arithmetic for your own weight and height, for the latitude you are floating over. Put in your birthday and it tells you your age in Jupiter years (one Jupiter year is 11.86 Earth years), how many Jupiter days you have lived, and the date of your next Jupiter birthday. It also measures the Great Red Spot of the year on the stage in units of you lying head to foot. Nothing you type leaves your browser.
Juno
NASA's Juno spacecraft reached Jupiter on 4 July 2016 and has orbited it on long, looping paths over the poles ever since. At its closest it passes about 4,200 km above the clouds, at high speed, and then swings far out again. Its three solar panels stretch about 20 m from the body. Juno carried the microwave radiometer, the gravity experiment, the infrared camera JIRAM, the ultraviolet spectrograph and the camera JunoCam whose results fill much of this exhibit. On the stage it crosses over the jet area every two minutes at about 4,200 km; go up and look for a moving glint.
How the model works, and where it differs from Jupiter
The planet is drawn around you. A grid shaped exactly to Jupiter's curve, fine near you and coarser toward the horizon, follows the point straight below, and the planet turns underneath so that you always stay at the centre of the scene. That is how the same stage can show the whole disc from 150,000 km and single cloud billows from a few kilometres away. The cloud colours come from a map of the planet drawn on the graphics card: bands, jets, the Great Red Spot at the size of the chosen year, white ovals, hot spots and the polar cyclones. Near you, finer cloud detail is added and lit by the Sun at the local time.
Some things are simplified or invented for the stage, and the readout or a card says so.
- The wind profile is a smooth model through the measured jet peaks, not a measured profile at every latitude.
- Cloud colours, cloud heights and the shapes of individual billows are a model. The heights of the cloud decks below come from a standard condensation model; the pressures and temperatures come from the Galileo probe.
- The positions of drifting features (Oval BA, the String of Pearls, White Spot Z, Clyde's Spot, hot spots and storm towers) are model positions. Their latitudes and the dates of the observations are real.
- Jupiter is drawn as a sphere 71,492 km in radius. The real planet is flattened: its polar radius is 66,854 km.
- The aurora is drawn in false colour at a model height.
- The colour of the sky seen from the cloud tops has never been photographed; the blue overhead and the beige haze near the horizon are an estimate.
- The person on the platform, and the platform, are there only for scale. People could not survive anywhere in Jupiter's atmosphere: there is little oxygen, the radiation is intense, and the cold air above and the hot air below are equally deadly.
Questions
How big is the Great Red Spot now?
In Hubble images from December 2023 to March 2024 its red oval was 12,881 to 14,233 km long, about 13,600 km on average, a little wider than Earth (12,742 km). In the late 1800s it was about 41,000 km long.
Is the Great Red Spot going to disappear?
Nobody knows. It has shrunk for more than a century and faster since 2012. The Hubble team expects it to keep shrinking until it fits more tightly between the jets around it, and then perhaps to settle into a smaller, rounder, stable shape.
Is the Great Red Spot the same storm Cassini saw in 1665?
Probably not. A 2024 study of the historical records concluded that the spot Cassini saw faded away after 1713, and that today's Great Red Spot was first seen in 1831.
How deep is the Great Red Spot?
No deeper than about 500 km, according to Juno's gravity measurements, even though its roots reach below the levels where water condenses. It is about 27 times wider than it is deep.
What is the fastest wind on Jupiter?
At the cloud tops, the jet at 24° N, at 144 to 160 m/s (about 520 to 580 km/h). The outer ring of the Great Red Spot exceeds 640 km/h. A jet above the equator measured by the James Webb Space Telescope reaches about 515 km/h, 25 to 50 km above the clouds.
Could you stand on Jupiter?
No. Jupiter has no solid surface under its clouds. The atmosphere just gets denser and hotter. The Galileo probe stopped working 132 km below the 1-bar level at 22 bar and 155 °C, and the planet's centre is still about 71,000 km further down.
How much would I weigh on Jupiter?
On a bathroom scale at the cloud tops, about 2.4 times your Earth weight at the equator and 2.8 times at the poles. A person who weighs 60 kg on Earth would read about 141 kg at the equator.
What are Jupiter's clouds made of?
Mostly ammonia ice at the top, ammonium hydrosulfide below that, and water deeper still, according to the standard cloud model. The air around them is about 86 percent hydrogen and 13.6 percent helium by number of molecules.
Why are there stripes?
The light zones and dark belts are bands of cloud at different heights and with different colours, separated by jet streams that blow east and west at fixed latitudes. The fast spin (a day of 9 hours 55 minutes) keeps the jets narrow and straight.
Does Jupiter have lightning?
Yes, and a lot of it. Juno recorded hundreds of flashes, mostly near the poles. It also found "shallow lightning" high in clouds of water and ammonia, and possible sprites and elves far above the storms.
What does the north pole look like?
One cyclone at the pole with eight around it, each 4,000 to 4,600 km across. The south pole has a central cyclone with five around it, briefly six in 2019 and 2020.
Can you see Jupiter's aurora?
Mostly not with your eyes: it shines mainly in ultraviolet and infrared. Hubble's ultraviolet images show it over a thousand times brighter than Earth's aurora.
Which moon looks biggest from Jupiter's clouds?
Io, at 0.60°, slightly bigger than our Moon from Earth. Ganymede is the largest moon but is so far away that it looks the same size as Europa, about 0.30°.
Can you see Earth from Jupiter?
Yes, as a dot near the Sun. It never appears more than 11° from the Sun, so you can only see it in twilight.
Why did the Galileo probe stop working?
Its instrument housings were designed for about 20 bar, and it worked to about 22 bar. Heat and pressure finally ended the radio link 58 minutes into the descent, as expected for a probe with no way back.
Is the time-lapse real?
The cloud motion follows the model wind at each latitude, sped up by the factor shown (1 to 30,000 times). The turning of the storms and the drift of the bands are real in direction and in relative speed, but the shapes of individual clouds are a model.
Terms
- 1-bar level: the height where the pressure is 1 bar, used as Jupiter's "sea level" for heights.
- Anticyclone: a high-pressure storm. In the southern hemisphere it turns counterclockwise, like the Great Red Spot.
- Cyclone: a low-pressure storm, turning the opposite way to an anticyclone in the same hemisphere.
- Belt and zone: the dark and light stripes of Jupiter's clouds.
- Jet stream: a narrow band of fast wind blowing east or west.
- 5-micron hot spot: a clear, dry patch through which heat from deeper layers escapes at a wavelength of 5 microns.
- Galileo probe: the descent module that NASA's Galileo spacecraft dropped into Jupiter on 7 December 1995.
- Juno: the NASA spacecraft orbiting Jupiter since 2016.
- JIRAM: Juno's infrared camera and spectrometer, which sees the clouds at about 5 microns.
- Mushball: a proposed hailstone of water and ammonia slush with an icy crust.
- Sprite: a brief flash high above a thunderstorm, set off by lightning below.
- Dilute core: a core in which heavy elements are spread through a large part of the planet's interior.
Sources
- NASA NSSDCA. Jupiter Fact Sheet. https://nssdc.gsfc.nasa.gov/planetary/factsheet/jupiterfact.html (checked 19 October 2026)
- NASA NSSDCA. Jovian Satellite Fact Sheet. https://nssdc.gsfc.nasa.gov/planetary/factsheet/joviansatfact.html (checked 19 October 2026)
- NASA NSSDCA. Jovian Rings Fact Sheet. https://nssdc.gsfc.nasa.gov/planetary/factsheet/jupringfact.html (checked 19 October 2026)
- NASA NSSDCA. Earth Fact Sheet. https://nssdc.gsfc.nasa.gov/planetary/factsheet/earthfact.html (checked 19 October 2026)
- NASA. Hubble Shows that Jupiter's Great Red Spot Is Smaller than Ever Seen Before (2014). https://science.nasa.gov/missions/hubble/hubble-shows-that-jupiters-great-red-spot-is-smaller-than-ever-seen-before/ (checked 19 October 2026)
- NASA JPL. NASA's Juno Spacecraft Spots Jupiter's Great Red Spot (2017). https://www.jpl.nasa.gov/news/nasas-juno-spacecraft-spots-jupiters-great-red-spot/ (checked 19 October 2026)
- NASA. Jupiter and Europa 2020 (Hubble). https://science.nasa.gov/asset/hubble/jupiter-and-europa-2020/ (checked 19 October 2026)
- Simon, A. A., Wong, M. H., Marcus, P. S. & Irwin, P. G. J. (2024). A detailed study of Jupiter's Great Red Spot over a 90-day oscillation cycle. Planetary Science Journal 5: 223. https://doi.org/10.3847/PSJ/ad71d1 (checked 19 October 2026)
- Simon, A. A. et al. (2018). Historical and contemporary trends in the size, drift, and color of Jupiter's Great Red Spot. Astronomical Journal 155: 151. https://doi.org/10.3847/1538-3881/aaae01 (checked 19 October 2026)
- Wong, M. H. et al. (2021). Evolution of the horizontal winds in Jupiter's Great Red Spot from one Jovian year of HST/WFC3 maps. Geophysical Research Letters 48. https://doi.org/10.1029/2021GL093982 (checked 19 October 2026)
- NASA. Winds in Jupiter's Great Red Spot (Hubble, 2021). https://science.nasa.gov/asset/hubble/winds-in-jupiters-great-red-spot/ (checked 19 October 2026)
- Sánchez-Lavega, A. et al. (2024). The origin of Jupiter's Great Red Spot. Geophysical Research Letters 51. https://doi.org/10.1029/2024GL108993 (checked 19 October 2026)
- Parisi, M. et al. (2021). The depth of Jupiter's Great Red Spot constrained by Juno gravity overflights. Science 374. https://doi.org/10.1126/science.abf1396 (checked 19 October 2026)
- Bolton, S. J. et al. (2021). Microwave observations reveal the deep extent and structure of Jupiter's atmospheric vortices. Science 374. https://doi.org/10.1126/science.abf1015 (checked 19 October 2026)
- Carlson, R. W. et al. (2016). Chromophores from photolyzed ammonia reacting with acetylene: application to Jupiter's Great Red Spot. Icarus 274. https://doi.org/10.1016/j.icarus.2016.03.008 (checked 19 October 2026)
- Tollefson, J. et al. (2017). Changes in Jupiter's zonal wind profile preceding and during the Juno mission. Icarus 296. https://doi.org/10.1016/j.icarus.2017.06.007 (checked 19 October 2026)
- Hueso, R. et al. (2023). An intense narrow equatorial jet in Jupiter's lower stratosphere observed by JWST. Nature Astronomy 7. https://doi.org/10.1038/s41550-023-02099-2 (checked 19 October 2026)
- Kaspi, Y. et al. (2018). Jupiter's atmospheric jet streams extend thousands of kilometres deep. Nature 555. https://doi.org/10.1038/nature25793 (checked 19 October 2026)
- Atkinson, D. H., Pollack, J. B. & Seiff, A. (1998). The Galileo Probe Doppler Wind Experiment: measurement of the deep zonal winds on Jupiter. Journal of Geophysical Research 103. https://doi.org/10.1029/98JE00060 (checked 19 October 2026)
- Seiff, A. et al. (1998). Thermal structure of Jupiter's atmosphere near the edge of a 5-µm hot spot in the north equatorial belt. Journal of Geophysical Research 103. https://doi.org/10.1029/98JE01766 (checked 19 October 2026)
- NASA Planetary Data System, Atmospheres Node. Galileo Probe Atmospheric Structure Instrument data (upperatm.tab, descent.tab). https://pds-atmospheres.nmsu.edu/data_and_services/atmospheres_data/Galileo/asi.html (checked 19 October 2026)
- NASA Science. Galileo Jupiter Atmospheric Probe. https://science.nasa.gov/mission/galileo-jupiter-atmospheric-probe/ (checked 19 October 2026)
- Ragent, B. et al. (1998). The clouds of Jupiter: results of the Galileo Jupiter Mission Probe Nephelometer Experiment. Journal of Geophysical Research 103. https://doi.org/10.1029/98JE00353 (checked 19 October 2026)
- Orton, G. S. et al. (1998). Characteristics of the Galileo probe entry site from Earth-based remote sensing observations. Journal of Geophysical Research 103. https://doi.org/10.1029/98JE02380 (checked 19 October 2026)
- Atreya, S. K. et al. (1999). A comparison of the atmospheres of Jupiter and Saturn: deep atmospheric composition, cloud structure, vertical mixing, and origin. Planetary and Space Science 47. https://doi.org/10.1016/S0032-0633(99)00047-1 (checked 19 October 2026)
- Niemann, H. B. et al. (1998). The composition of the Jovian atmosphere as determined by the Galileo probe mass spectrometer. Journal of Geophysical Research 103. https://doi.org/10.1029/98JE01050 (checked 19 October 2026)
- von Zahn, U., Hunten, D. M. & Lehmacher, G. (1998). Helium in Jupiter's atmosphere: results from the Galileo probe Helium Interferometer Experiment. Journal of Geophysical Research 103. https://doi.org/10.1029/98JE00695 (checked 19 October 2026)
- Adriani, A. et al. (2018). Clusters of cyclones encircling Jupiter's poles. Nature 555. https://doi.org/10.1038/nature25491 (checked 19 October 2026)
- NASA JPL. NASA's Juno Mission Provides Infrared Tour of Jupiter's North Pole (2018). https://www.jpl.nasa.gov/news/nasas-juno-mission-provides-infrared-tour-of-jupiters-north-pole/ (checked 19 October 2026)
- NASA JPL. A Sixth Cyclone Has Joined the Configuration of Circumpolar Cyclones at Jupiter's South Pole (2019). https://www.jpl.nasa.gov/images/pia23608-a-sixth-cyclone-has-joined-the-configuration-of-circumpolar-cyclones-at-jupiters-south-pole/ (checked 19 October 2026)
- NASA. NASA's Juno Navigators Enable Jupiter Cyclone Discovery (2019). https://www.nasa.gov/missions/juno/nasas-juno-navigators-enable-jupiter-cyclone-discovery/ (checked 19 October 2026)
- Li, C., Ingersoll, A. P. et al. (2021). Deep, closely packed, long-lived cyclones on Jupiter's poles. Planetary Science Journal 2: 79. https://doi.org/10.3847/PSJ/abedbd (checked 19 October 2026)
- Brown, S. et al. (2018). Prevalent lightning sferics at 600 megahertz near Jupiter's poles. Nature 558. https://doi.org/10.1038/s41586-018-0156-5 (checked 19 October 2026)
- NASA JPL. Juno Solves 39-Year Old Mystery of Jupiter Lightning (2018). https://www.jpl.nasa.gov/news/juno-solves-39-year-old-mystery-of-jupiter-lightning/ (checked 19 October 2026)
- Becker, H. N. et al. (2020). Small lightning flashes from shallow electrical storms on Jupiter. Nature 584. https://doi.org/10.1038/s41586-020-2532-1 (checked 19 October 2026)
- Guillot, T. et al. (2020). Storms and the depletion of ammonia in Jupiter: I. Microphysics of "mushballs". Journal of Geophysical Research: Planets 125. https://doi.org/10.1029/2020JE006403 (checked 19 October 2026)
- NASA JPL. 'Shallow Lightning' and 'Mushballs' Reveal Ammonia to NASA's Juno Scientists (2020). https://www.jpl.nasa.gov/news/shallow-lightning-and-mushballs-reveal-ammonia-to-nasas-juno-scientists/ (checked 19 October 2026)
- Giles, R. S. et al. (2020). Possible transient luminous events observed in Jupiter's upper atmosphere. Journal of Geophysical Research: Planets 125. https://doi.org/10.1029/2020JE006659 (checked 19 October 2026)
- NASA. Juno Data Indicates 'Sprites' or 'Elves' Frolic in Jupiter's Atmosphere (2020). https://www.nasa.gov/centers-and-facilities/jpl/juno-data-indicates-sprites-or-elves-frolic-in-jupiters-atmosphere/ (checked 19 October 2026)
- NASA. Auroras on Jupiter (Hubble, 2016). https://science.nasa.gov/asset/hubble/auroras-on-jupiter/ (checked 19 October 2026)
- Mura, A. et al. (2017). Infrared observations of Jovian aurora from Juno's first orbits: main oval and satellite footprints. Geophysical Research Letters 44. https://doi.org/10.1002/2017GL072954 (checked 19 October 2026)
- Grodent, D. et al. (2018). Jupiter's aurora observed with HST during Juno orbits 3 to 7. Journal of Geophysical Research: Space Physics 123. https://doi.org/10.1002/2017JA025046 (checked 19 October 2026)
- NASA JPL. NASA's Juno to Soar Closest to Jupiter This Saturday (2016). https://www.jpl.nasa.gov/news/nasas-juno-to-soar-closest-to-jupiter-this-saturday/ (checked 19 October 2026)
- Bolton, S. J. et al. (2017). Jupiter's interior and deep atmosphere: the initial pole-to-pole passes with the Juno spacecraft. Science 356. https://doi.org/10.1126/science.aal2108 (checked 19 October 2026)
- Li, C. et al. (2017). The distribution of ammonia on Jupiter from a preliminary inversion of Juno microwave radiometer data. Geophysical Research Letters 44. https://doi.org/10.1002/2017GL073159 (checked 19 October 2026)
- Wahl, S. M. et al. (2017). Comparing Jupiter interior structure models to Juno gravity measurements and the role of a dilute core. Geophysical Research Letters 44. https://doi.org/10.1002/2017GL073160 (checked 19 October 2026)
- Li, L. et al. (2018). Less absorbed solar energy and more internal heat for Jupiter. Nature Communications 9: 3709. https://doi.org/10.1038/s41467-018-06107-2 (checked 19 October 2026)
- Moore, K. M. et al. (2018). A complex dynamo inferred from the hemispheric dichotomy of Jupiter's magnetic field. Nature 561. https://doi.org/10.1038/s41586-018-0468-5 (checked 19 October 2026)
- NASA. NASA's Juno Finds Changes in Jupiter's Magnetic Field (2019). https://www.nasa.gov/missions/juno/nasas-juno-finds-changes-in-jupiters-magnetic-field/ (checked 19 October 2026)
- NASA. Hubble Snaps Baby Pictures of Jupiter's "Red Spot Jr." (2006). https://science.nasa.gov/missions/hubble/hubble-snaps-baby-pictures-of-jupiters-red-spot-jr/ (checked 19 October 2026)
- NASA. "Clyde's Spot" on Jupiter (2020). https://www.nasa.gov/image-article/clydes-spot-jupiter/ (checked 19 October 2026)
- NASA JPL. Jupiter's Stunning Southern Hemisphere (2017). https://www.jpl.nasa.gov/images/pia21970-jupiters-stunning-southern-hemisphere/ (checked 19 October 2026)
- NASA Science. Two Comet Shoemaker-Levy 9 Impact Sites on Jupiter (1994). https://science.nasa.gov/resource/two-comet-shoemaker-levy-9-impact-sites-on-jupiter-1994/ (checked 19 October 2026)
- Porco, C. C. et al. (2003). Cassini imaging of Jupiter's atmosphere, satellites, and rings. Science 299. https://doi.org/10.1126/science.1079462 (checked 19 October 2026)
- NOAA National Hurricane Center. Saffir-Simpson Hurricane Wind Scale. https://www.nhc.noaa.gov/aboutsshws.php (checked 19 October 2026)
More exhibits
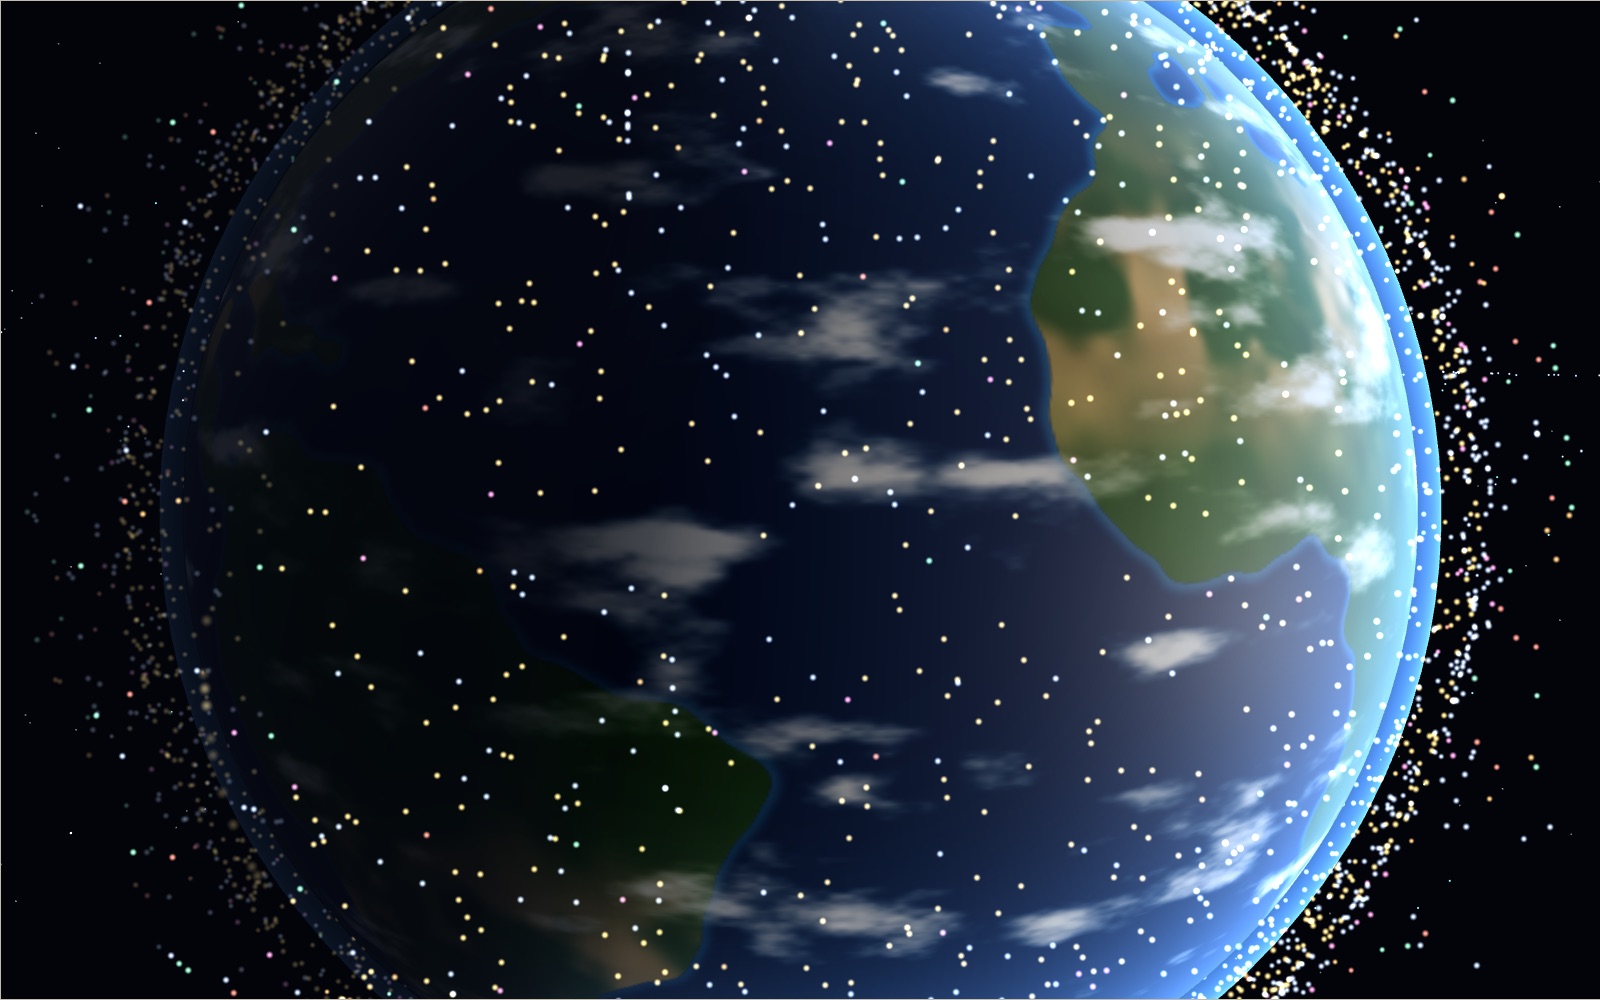
Satellites orbiting Earth right now
On 20 October 2026 the public catalogue listed 16,768 working satellites, and two in every three belonged to one company's internet network.
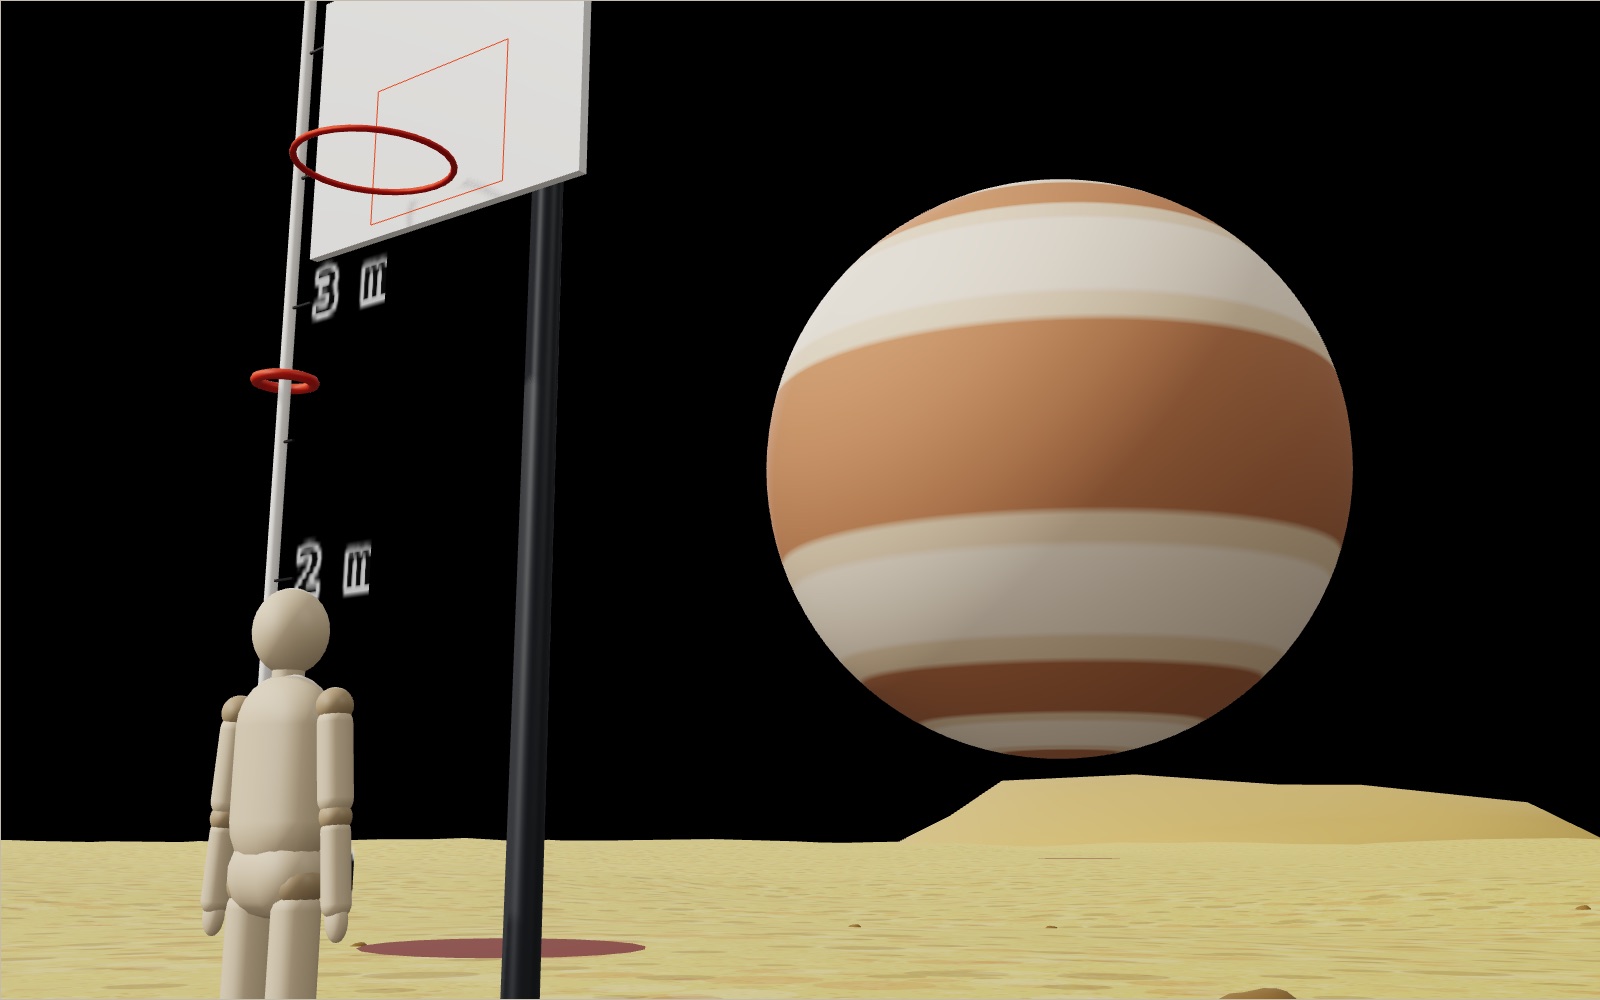
Your weight and jump height on other planets and moons
A 50 cm jump on Earth becomes a 3 m leap on the Moon, 18 m on Ceres and a one-way trip off asteroid Bennu.
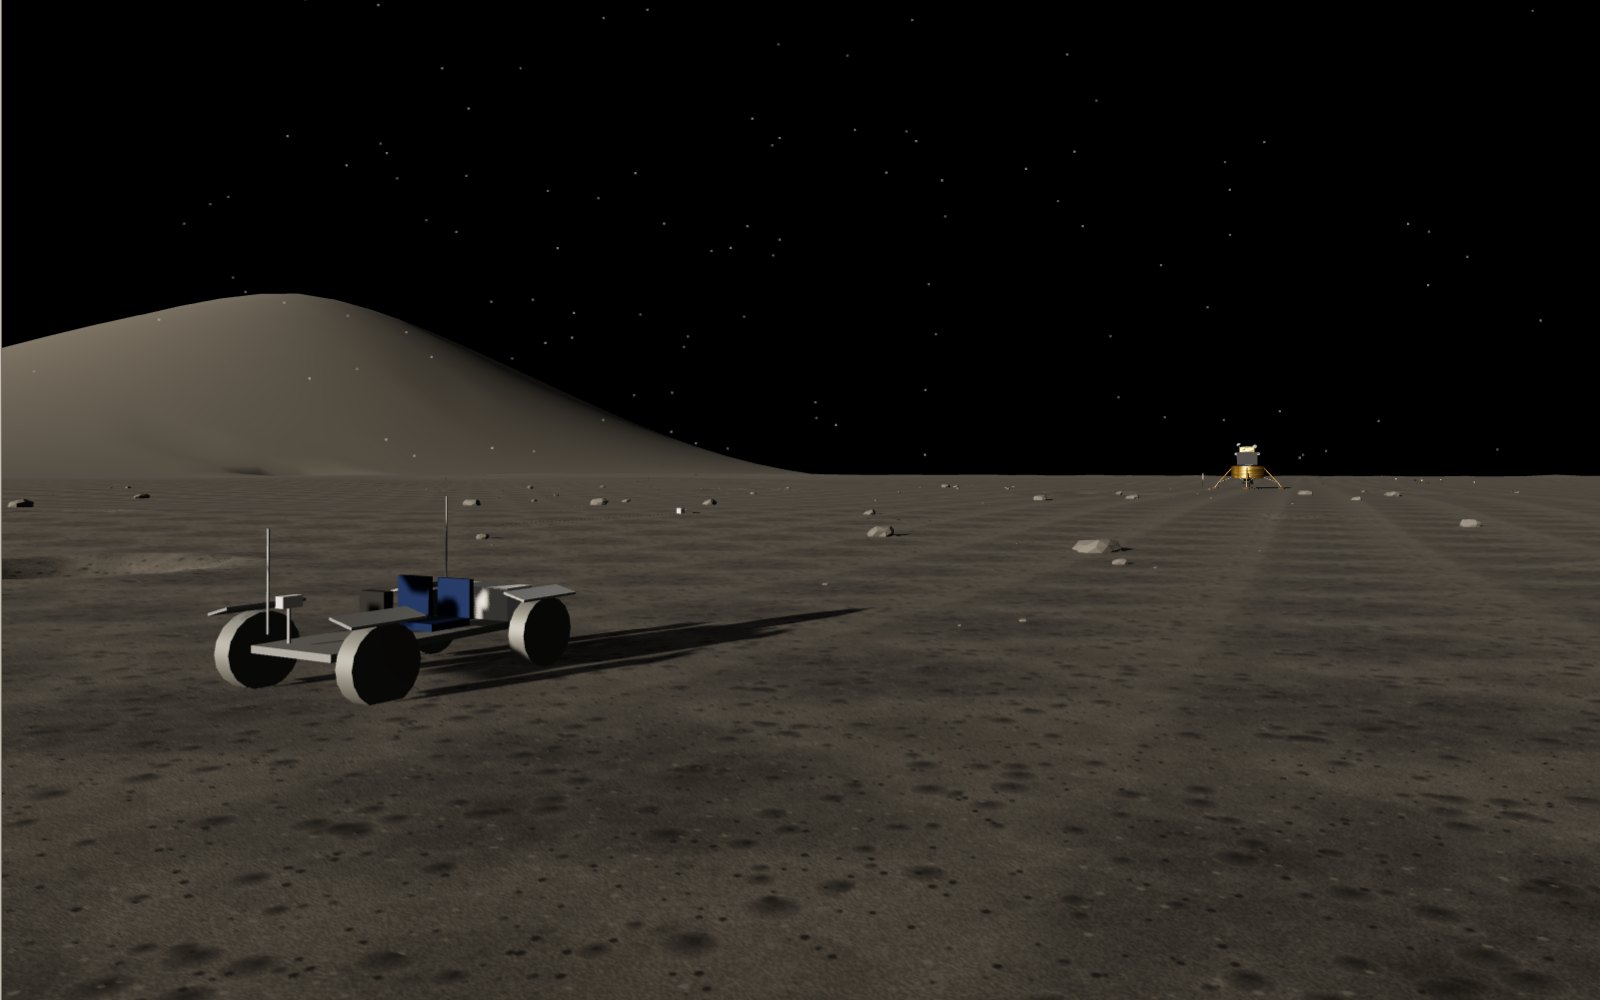
Walk the Apollo landing sites
Standing on the Moon with your eyes 1.6 m up, the horizon is only about 2.4 km away. All six Apollo landing sites are here, from Tranquility Base to Taurus-Littrow.
Solar system scale model measurements along a park walk
Shrink the Sun to a ball 1.39 m wide and Earth becomes a 1.27 cm marble 150 m down the path, Neptune is 4.5 km away and Voyager 1 would be 25.7 km.
Travelling at the speed of light
Light goes round the equator 7.5 times in a second, yet the same light needs 2.5 million years to reach the Andromeda galaxy.
Why we have seasons: tilted Earth, changing daylight
The Earth is closest to the Sun in the first week of January, in the middle of the northern winter.