FIG. 07How It Works
Why we have seasons: tilted Earth, changing daylight
The Earth is closest to the Sun in the first week of January, in the middle of the northern winter.
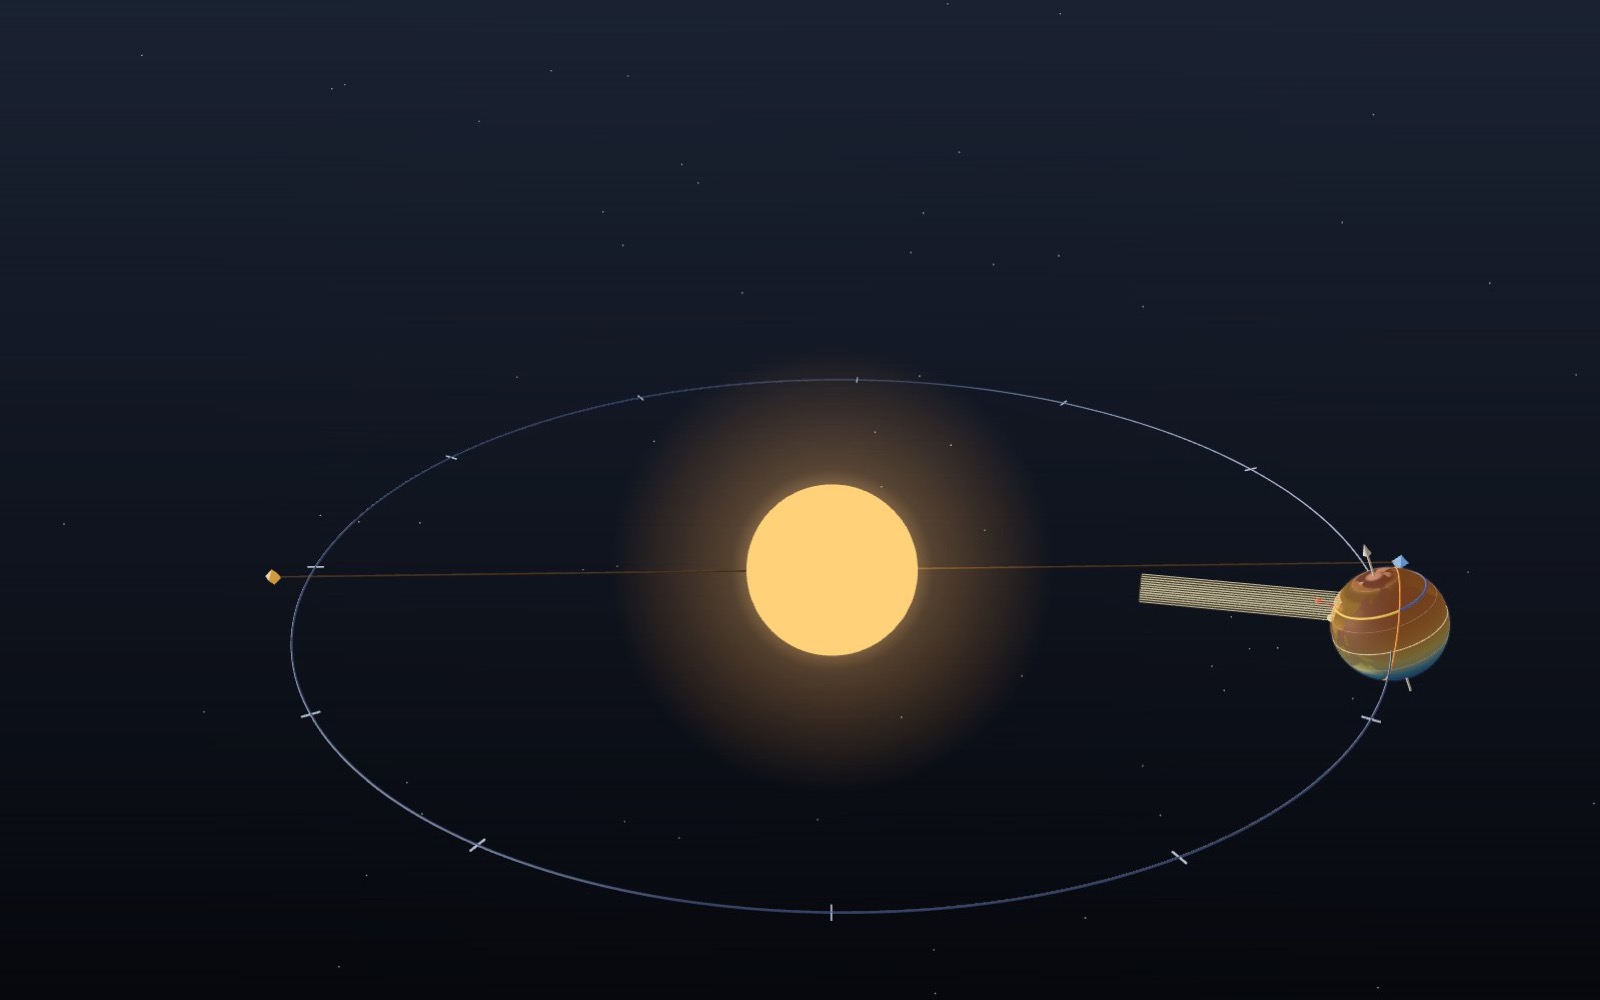
This device cannot show the 3D model. You can read the guide steps below as text.
1 / 8 The Earth goes round the SunOne lap takes a year. Press play and four days pass each second. Sizes and distances are not to scale: on this scale the real Earth would be a speck smaller than a pixel. Drag to turn. Scroll or pinch to zoom.
Drag to turn. Scroll or pinch to zoom.
What the model shows
We have seasons because Earth’s tilted axis changes the height of the Sun and the length of the day through the year. A hemisphere leaning towards the Sun gets longer days and more direct sunlight. The seasons are not caused by Earth being closer to the Sun in summer.
Ask people why summer is warm and many will say the Earth is closer to the Sun. It is a reasonable guess, and it is wrong. The Earth is nearest the Sun in the first week of January, when Seoul is at its coldest and Sydney at its warmest. This exhibit shows what does make the seasons: the tilt of the Earth's axis, and what that tilt does to the height of the Sun and the length of the day.
The Sun sits in the middle and the Earth goes round it on a path traced from the same solar formulas that drive the numbers. Press play and four days pass every second, while the Earth spins once every 2.4 seconds so you can see the day and night line sweep across the surface. The date slider puts the Earth anywhere on its 2026 orbit. The latitude slider, or the buttons under it, picks a place: the North Pole, the Arctic Circle, Seoul at 37.57° N, the equator or Sydney at 33.87° S.
The panel in the top left corner gives the numbers for that date and place: the Sun's declination, the distance to the Sun, the height of the Sun at noon, the length of the day with and without atmospheric refraction, the share of full sunlight that lands on a level square metre at noon, and the average sunlight per square metre over the whole day at the top of the atmosphere. The small drawing under the numbers compares a beam of light coming straight down with the same beam arriving at today's noon angle.
The model is not to scale, and it could not be. If the orbit were drawn this size, the real Earth would be about 2,350 times smaller than the ball you see, far smaller than a pixel. So the Earth is drawn about 2,350 times too big for its orbit and the Sun about 35 times too big. The Sun is only 1.6 times wider than the Earth here; in reality it is 109 times wider. The shape of the orbit, on the other hand, is true. It is an ellipse with an eccentricity of 0.0167, and at this size that is close enough to a circle that you have to look hard to see the Sun sitting off centre.
Distance is not the reason
The Earth's distance from the Sun does change through the year. In 2026 the nearest point, perihelion, falls on 3 January at 17:15 UT (4 January in Korea), at about 147.1 million km. The farthest point, aphelion, falls on 6 July at about 152.1 million km. The difference is 5 million km, or 3.4%.
Sunlight weakens with the square of distance, so January sunlight at the top of the atmosphere is (152.1 / 147.1)² = 1.069 times July sunlight, about 6.9% stronger. That is a real effect, and climate scientists do include it. But it cannot be the cause of the seasons, for two reasons you can see in the model. First, it points the wrong way for the north: the Earth is closest during the northern winter. Second, if distance made the seasons, the whole planet would have summer at the same time. Instead Seoul and Sydney have opposite seasons on the same day. Set the date to January and switch between the two cities: the distance line stays the same, yet one city gets a high Sun and long days while the other gets a low Sun and short days.
The tilt that stays put
The Earth spins about an axis that is tilted 23.44° away from a line square to the plane of its orbit. The important part is that the axis keeps pointing at the same place among the stars, close to Polaris, all year. It does not lean towards the Sun or away from it on purpose. It simply keeps its direction while the Earth travels round.
Switch on "Earth at four dates" to see faint copies of the Earth at the two equinoxes and the two solstices. Their axes are parallel. On the June solstice the north end of the axis happens to lean towards the Sun; six months later, on the other side of the orbit, the same lean now points the north end away from the Sun. At the equinoxes the lean is sideways to the Sun and neither hemisphere is favoured.
The latitude where the Sun stands straight overhead at noon is called the Sun's declination, written δ. It swings between +23.44° in June and −23.44° in December. The orange dot on the globe marks that point. The dashed rings at 23.44° north and south are the Tropic of Cancer and the Tropic of Capricorn, the farthest the overhead Sun ever gets from the equator. The model calculates δ from the date with the low-precision formulas used by the US Naval Observatory: first the Sun's ecliptic longitude λ, then
δ = asin(sin ε × sin λ), with ε = 23.44°.
The height of the Sun at noon
At local noon the Sun crosses the meridian, the north-south line overhead. Its height above the horizon then depends only on your latitude φ and the declination:
noon height h = 90° − |φ − δ|.
For Seoul on 21 June 2026, φ = 37.57° and δ = +23.44°, so h = 90° − 14.13° = 75.9°. On 22 December δ = −23.43°, so h = 90° − 61.00° = 29.0°. The red pin on the globe marks the noon point on the chosen latitude, and the model also measures the angle between the local vertical at that pin and the Sun direction in 3D. The two methods agree to within 0.01°.
If the formula gives a negative number, the Sun stays below the horizon all day. That happens inside the polar circles in winter. The panel shows the negative height with a note.
How long the day lasts
As the Earth spins, each place is carried round its circle of latitude. The yellow part of the chosen circle is in daylight and the blue part is in night. Because the circle of latitude and the day and night line are tilted against each other, the yellow part is longer than half in summer and shorter in winter. The angle from noon to sunset, called the hour angle H, comes from spherical trigonometry:
cos H = −tan φ × tan δ, and day length = 2H / 15 hours (the Earth turns 15° per hour).
For Seoul in June this gives 2 × acos(−0.7695 × 0.4335) / 15 = 2 × 109.5° / 15 = 14.60 h, or 14 h 36 min. In December it gives 9 h 24 min.
This formula treats the Sun as a point and ignores the air. Almanacs count sunrise as the moment the top edge of the Sun appears, and the atmosphere bends light so that the Sun is visible when it is really about 0.57° below the horizon. Together with the Sun's radius of about 0.27°, that is usually written as an altitude of −0.833°. The general formula is
cos H = (sin h₀ − sin φ sin δ) / (cos φ cos δ), with h₀ = −0.833°.
That is the second time shown in the panel, "Sunrise to sunset". It adds about ten minutes in Seoul: 14 h 46 min in June and 9 h 34 min in December. The Korea Astronomy and Space Science Institute (KASI) almanac table for Seoul lists sunrise 05:11 and sunset 19:57 on 21 June 2026, which is 14 h 46 min, and 07:43 and 17:17 on 21 December, which is 9 h 34 min. On 22 December KASI lists 17:18 for sunset, a 9 h 35 min day; the times are rounded to the minute, so a one-minute difference is the rounding. The same refraction is why the equinox day in Seoul is not exactly 12 hours: KASI gives 06:36 to 18:44 on 20 March 2026, 12 h 08 min, and the model gives 12 h 8 min.
The same beam on a bigger patch
Height matters because it decides how much ground a given amount of sunlight has to cover. Switch on the sunlight beam: it is a square bundle of parallel rays with the same cross-section every day, arriving at the noon point. When the Sun is high, the patch it lights on the ground is barely bigger than the beam. When the Sun is low, the same rays land on a stretched patch. The stretch factor is 1 / sin h, so the energy per square metre is the full-beam value times sin h.
At Seoul's June noon, sin 75.9° = 0.970, a stretch of only 1.03 times. At the December noon, sin 29.0° = 0.485, a stretch of 2.06 times, so each square metre gets about half the light it would get under an overhead Sun.
The longer day adds to this. The last line in the panel combines both effects into the average sunlight on a level surface at the top of the atmosphere over 24 hours:
Q = (S₀ / π) × (1 / r²) × (H sin φ sin δ + cos φ cos δ sin H),
where S₀ = 1,361 W/m² is the total solar irradiance at 1 AU, r is the distance in AU and H is in radians. For Seoul this is 482 W/m² on 21 June and 173 W/m² on 22 December, 2.8 times as much in June even though the Earth is farther from the Sun then.
Numbers you can check
All values are for 2026, with δ at 12:00 UT. "Day" ignores refraction; "Sunrise to sunset" uses h₀ = −0.833°.
| Place, date | δ | Noon height | Day | Sunrise to sunset | Daily mean at top of air |
|---|---|---|---|---|---|
| Seoul 37.57° N, 21 Jun | +23.44° | 75.9° | 14 h 36 min | 14 h 46 min | 482 W/m² |
| Seoul, 20 Mar | −0.04° | 52.4° | 12 h 00 min | 12 h 08 min | 346 W/m² |
| Seoul, 22 Dec | −23.43° | 29.0° | 9 h 24 min | 9 h 34 min | 173 W/m² |
| Equator, 21 Jun | +23.44° | 66.6° | 12 h 00 min | 12 h 07 min | 385 W/m² |
| Sydney 33.87° S, 22 Dec | −23.43° | 79.6° | 14 h 15 min | 14 h 24 min | 511 W/m² |
| Sydney, 21 Jun | +23.44° | 32.7° | 9 h 45 min | 9 h 54 min | 187 W/m² |
| North Pole, 21 Jun | +23.44° | 23.4° | 24 h | 24 h | 524 W/m² |
Two details in the table are worth a second look. The North Pole in June receives more sunlight per day at the top of the atmosphere than the equator does: the Sun is low, but it never sets. And Sydney's December figure, 511 W/m², is a little higher than Seoul's June figure. Part of that is Sydney's lower latitude, and part is perihelion: the Earth is 3.2% closer to the Sun in December than in June.
Midnight Sun and polar night
Pick the Arctic Circle at 66.56° N and move the date to June. The whole circle turns yellow: the Sun does not set. In December the circle is all blue. In the formula, −tan φ × tan δ goes past −1 or +1 and there is no hour angle left to compute. Without refraction, the Arctic Circle on 21 June 2026 gets 23 h 50 min, because the declination at 12:00 UT is 23.435°, just short of the tilt. With refraction the Sun stays up for the full 24 hours. Polar day reaches about 90 km south of the circle for the same reason.
Why the hottest days come later
The sunlight peaks at the June solstice, but Seoul's warmest month is August, and the coldest is January rather than December. Land and especially the oceans take weeks to warm up and cool down, so temperature lags the sunlight. This model shows the sunlight only. It does not model air, clouds or the sea.
What the model simplifies
- Sizes and distances are not to scale, as described above. The orbit's shape is true.
- The Earth spins once every 2.4 seconds on screen, not once per 365th of a year, so the date and the spin are not linked.
- The red pin shows the noon point on the chosen latitude, not a fixed city turning with the globe.
- The numbers use δ at 12:00 UT. Near the equinoxes δ changes by about 0.4° per day, which moves the noon height by up to 0.2° over half a day from the reference instant.
- The beam drawing ignores the atmosphere. Real light at a low Sun also passes through more air, which weakens it further.
- The surface map is drawn in code from a few hundred outline points with noise added to roughen the coasts. It is accurate enough to find Korea and Australia, not to navigate by.
From noon power to a day's energy
The cosine law is sometimes written with a zenith angle z instead of the altitude h. These are complementary angles: z = 90° − h, so cos z = sin h. A reading of 0.970 on the noon light fraction means that a horizontal surface intercepts 97.0% of a beam measured on a surface facing the Sun. It does not mean that the atmosphere transmits 97.0% of the incoming energy. The model has no cloud cover or aerosol setting. NASA's account of Earth's energy budget explains why reflection and atmospheric absorption must be considered separately from this geometric projection.
As a worked comparison, hold distance fixed and divide Seoul's summer projection by its winter projection: 0.970 / 0.485 = 2.00. Now restore the actual orbital distances. The winter beam is stronger before it reaches the horizontal surface, so the summer-to-winter ratio of noon power is somewhat smaller than 2.00. This does not undo the tilt effect. It only offsets part of it. Comparing the full daily means gives 482 / 173 = 2.79 because the summer Sun also stays above the horizon longer. Multiplying noon power by daylight hours would overestimate the daily total: at sunrise and sunset the projected contribution approaches zero, rather than remaining at its noon value.
The daily mean can also be converted into an energy total. For a hypothetical horizontal square metre above the atmosphere at Seoul, 482 W/m² × 24 h = 11.568 kWh/m² per day. The winter calculation is 173 × 24 / 1000 = 4.152 kWh/m² per day. These are derived from rounded display readings, not measurements of a rooftop panel. A panel's slope, clouds, shadows and conversion efficiency all change its electrical output. Watts measure a rate; watt-hours measure an accumulated amount. Keeping that distinction prevents a daily average from being mistaken for a noon maximum or for an electricity bill.
The same date at different latitudes
The equator does not have an overhead Sun every day. At the equinoxes δ crosses 0°, giving a noon altitude of 90° there. At either solstice the altitude is 90° − 23.44° = 66.56°. The geometric day nevertheless stays close to 12 hours throughout the year, because tan φ is zero at the equator. There are therefore two annual peaks in noon solar height rather than the single summer peak familiar in Seoul. Rainy and dry seasons in tropical regions depend on circulation and the movement of rain belts, which this geometry alone cannot predict.
Sydney offers a different comparison. December is its summer because its negative latitude is closer to the negative solar declination. The table's 79.6° noon altitude is higher than Seoul's 75.9° in June, partly because Sydney lies nearer the equator. Do not attribute the entire difference to Earth's distance. For an isolated hemispheric comparison, use the latitude slider to compare +37.57° and −37.57° at opposite solstices. The geometry then matches approximately, while the orbital-distance contribution still differs. Ocean coverage and atmospheric circulation make real temperature comparisons more complicated than the sunlight comparison.
At the North Pole in June, the Sun circles the sky at nearly constant altitude during a day instead of climbing to a sharply defined midday peak. The 524 W/m² daily mean in the table can exceed the equator's 385 W/m² because all daylight hours contribute. This does not make the pole warmer than the equator. Snow and ice reflect sunlight, much energy can go into melting ice rather than raising temperature, and winter has an extended absence of sunlight. NASA's energy-budget discussion distinguishes incoming radiation from absorbed energy and shows how oceans and the atmosphere redistribute heat. A single summer day cannot describe an annual climate.
Heat storage and the seasonal lag
A solstice marks an extreme in solar declination, not an instruction for air temperature to reverse immediately. A surface continues warming whenever the energy it gains exceeds the energy it loses. After the June solstice, incoming energy can be declining while still exceeding outgoing energy. The temperature peak arrives later, when that balance changes sign. The daily analogy is familiar: the warmest part of a clear afternoon usually follows solar noon. The seasonal version also involves heat exchange with deeper soil and water, so it cannot be calculated by simply stretching an afternoon temperature curve.
Consider a deliberately simplified storage example. Assume a net gain of 100 W/m² persists for one day. The added energy is 100 × 86400 = 8.64 million joules per square metre. Using a rounded water heat capacity of 4,200 J/(kg·°C), a layer containing 1,000 kg of water per square metre would warm by about 2.06°C if all that energy stayed in the layer. A layer ten times as massive would warm only 0.206°C. This is an illustrative energy balance, not a prediction for the sea: evaporation, mixing, currents and infrared radiation continually alter the balance. It explains why the depth of the material being heated matters as much as the incoming flux.
For an observational check, the Korea Meteorological Administration's climate-normal page allows selection of Seoul and monthly means for 1991–2020. Compare June with August and December with January, rather than selecting one unusually hot or cold year. The stated period is essential: a climate normal is an average over a defined reference interval, not a promise about next summer. NOAA's climate-normal documentation likewise describes a standard reference based on 30 years. The exhibit does not contain these temperature records. Its daily sunlight curve supplies one physical input, while the station records describe the response of the atmosphere and surface together.
Orbital cycles beyond one year
The direction of the axis is effectively fixed for this exhibit's single year, but not for the whole history of Earth. NASA's Milankovitch overview separates three slow changes. Obliquity varies between about 22.1° and 24.5° on a roughly 41,000-year cycle. Greater tilt increases the contrast between summer and winter at high latitudes. Eccentricity describes changes in orbital shape, with a prominent cycle near 100,000 years. Axial precession changes the direction of the spin axis over about 26,000 years. The combined timing of precession and changes in the orbit produces climatic precession cycles around 19,000–23,000 years.
These cycles redistribute sunlight by season and latitude; they are not a switch that alternately turns the Sun up and down everywhere. Summer energy at high northern latitudes matters for whether winter snow survives to the following year. Persistent snow can increase reflectivity, and ice sheets, greenhouse gases and ocean circulation provide further responses. Explaining an ice age therefore needs more than computing an annual global mean or drawing a slightly wider ellipse. NASA also stresses that the slow orbital cycles do not explain the rapid warming observed in recent decades.
The January perihelion is a feature of the present orbital arrangement, not an eternal calendar rule. Precession gradually changes which season occurs near perihelion. Earth's speed also varies: it moves faster near perihelion, so equal angular sections of the orbit do not take equal time. That is why astronomical seasons have unequal lengths. None of these slow cycles can be adjusted in this exhibit. The date slider covers 2026, and the axis and solar-position calculation belong to that year. Reading an ice-age scenario from this screen would exceed what the model calculates.
Standing on the ground
The buttons at the bottom of the stage switch between two views. From space you see the whole orbit: tap the Earth to pick a latitude, or drag the Earth along its orbit to change the date. The colours laid over the globe show the day's mean sunlight at the top of the air, warm in the half of the world that has summer, cool in the half that has winter and dark blue where the Sun does not rise at all.
On the ground you stand at the chosen latitude under a glass sky. The yellow arc is the Sun's path on the chosen date; the faint orange and blue arcs are its paths at the June and December solstices. A stick in the middle casts a shadow, and a thin line on the ground traces the tip of that shadow through the day. Beside it a square beam of sunlight lands on the ground: the yellow patch is what it lights now, the red square what it would light with the Sun straight overhead. Drag the Sun to change the time of day. When the whole arc stays above the horizon the Sun does not set (the midnight Sun); when it stays below, the Sun does not rise (polar night).
The Controls tab adds a tilt experiment. Set the axis to 0°, 45° or 90° instead of 23.44° and every arc, colour and number follows; these are model values, a thought experiment rather than a forecast. With no tilt every place gets 12 hours of daylight all year, and at 90° each pole swings between months of day and months of night, much like Uranus. The same tab has 12 challenges, 10 hidden finds, a chart of the whole year at the chosen latitude, your own location or birthday, and a catalogue of 50 entries: the 2026 equinoxes, solstices and apsides from the US Naval Observatory, the 24 solar terms, monuments built around the rising and setting Sun, and calendars that keep the solstices and equinoxes.
Checks to make on the screen
Pause the animation before comparing readings. Select Seoul and the June solstice, then note noon height, daylight and daily mean. Switch to the December solstice without changing latitude. The height should fall from about 75.9° to 29.0° and the geometric day from about 14 h 36 min to 9 h 24 min. Turn the beam off and on to see which drawing represents the footprint; the numerical sunlight values do not depend on whether that drawing is visible. The beam toggle changes the illustration, not the physical assumptions.
Next select the equator and move between the solstices and equinoxes. The day length changes little, while the noon altitude rises toward the equinoxes. Finally choose the North Pole in June and December. Compare the daylight reading with the daily mean rather than assuming that a low Sun necessarily means a small daily total. At the pole, the usual sunrise equation needs the limiting all-day or all-night case; an inverse cosine outside its allowed range is not a negative number of daylight hours.
Use the four-date overlay to check the main misconception directly. The axes remain parallel even when the Earth is on the opposite side of the Sun. The planet does not tip back and forth each half-year. Also distinguish local solar noon from 12:00 on a wristwatch: longitude, time zones and the equation of time can shift the clock time of the meridian crossing. This screen reports the altitude at solar noon, not a weather forecast for a particular clock hour. Record the selected latitude and date with any copied number so another reader can reproduce the comparison.
Questions
Is summer caused by the Earth being closer to the Sun?
No. The Earth is closest to the Sun around 3 January and farthest around 6 July. The northern summer happens near the farthest point. Distance changes sunlight by about 6.9% over the year, much less than the change caused by tilt.
Why are the seasons reversed in the southern hemisphere?
The axis keeps one direction in space. When its north end leans towards the Sun, its south end leans away, so the Sun is high and the days long in one hemisphere while the opposite is true in the other.
Why is the noon Sun height 90° − |φ − δ|?
At noon the Sun is on your meridian. Its angle from straight overhead equals the difference between your latitude and the latitude where it is overhead, the declination. Subtracting that from 90° gives the height above the horizon.
Why is the equinox day longer than 12 hours?
The 12-hour figure treats the Sun as a point with no atmosphere. Sunrise is counted when the top edge appears, and refraction lifts the Sun's image by about half a degree near the horizon. In Seoul the March equinox day is 12 h 08 min.
Does the tilt of the axis change?
Slowly. It varies between about 22.1° and 24.5° over roughly 41,000 years and is now 23.44° and decreasing. The direction of the axis also circles round once in about 26,000 years, which is precession. Neither is noticeable from one year to the next.
Why is the hottest month not June?
The ground and the oceans store heat, so temperatures keep rising for a few weeks after the sunlight peaks. In Seoul the warmest month is usually August.
What would happen with no tilt?
The Sun would stand over the equator every day, every place would have about 12 hours of day all year, and the only seasonal change would be the small 6.9% swing from the orbit's shape.
Does 482 W/m² predict my solar panel output?
No. It is a 24-hour mean on a horizontal surface above the atmosphere. Clouds, panel slope and electrical efficiency are excluded.
Does the equator have an overhead Sun every day?
No. Its noon Sun reaches 90° at the equinoxes and about 66.56° at the solstices, while the geometric day remains about 12 hours.
Can this model show an ice age?
No. The date control covers 2026. Slow orbital cycles and the responses of ice sheets, oceans and greenhouse gases are not simulated.
Terms
- Axial tilt (obliquity): the angle between the Earth's axis and a line square to its orbit, 23.44° in 2026.
- Declination (δ): the latitude where the Sun is directly overhead at a given moment.
- Solstice: the date when δ reaches its greatest north or south value, around 21 June and 21-22 December.
- Equinox: the date when δ crosses 0° and the Sun is over the equator, around 20 March and 23 September.
- Perihelion and aphelion: the nearest and farthest points of the Earth's orbit from the Sun.
- Hour angle (H): how far the Earth has turned since local noon, 15° per hour.
- Refraction: the bending of light in the atmosphere, which makes the Sun appear higher near the horizon.
- Insolation: sunlight energy arriving on a surface, in watts per square metre.
- Terminator: the line between day and night on a planet.
Sources
US Naval Observatory, "Earth's Seasons and Apsides" (2026 equinoxes, solstices, perihelion and aphelion). https://aa.usno.navy.mil/data/Earth_Seasons (checked 2026-10-16)
US Naval Observatory, "Approximate Solar Coordinates" (formulas used for λ, δ and the distance). https://aa.usno.navy.mil/faq/sun_approx (checked 2026-10-16)
Korea Astronomy and Space Science Institute, "Monthly sunrise and sunset", Seoul 2026 almanac tables. https://astro.kasi.re.kr/life/pageView/6 (checked 2026-10-16)
NOAA Global Monitoring Laboratory, "General Solar Position Calculations" (hour angle and the −0.833° sunrise convention). https://gml.noaa.gov/grad/solcalc/solareqns.PDF (checked 2026-10-16)
NASA Goddard Space Flight Center, "Earth Fact Sheet" (radius, orbit, obliquity). https://nssdc.gsfc.nasa.gov/planetary/factsheet/earthfact.html (checked 2026-10-16)
NASA Space Place, "What Causes the Seasons?" https://spaceplace.nasa.gov/seasons/en/ (checked 2026-10-16)
US National Weather Service, "The Seasons, the Equinox, and the Solstices". https://www.weather.gov/fsd/season (checked 2026-10-16)
Calculations on this page: the formulas above for 2026, δ at 12:00 UT, S₀ = 1,361 W/m².
NASA, Milankovitch orbital cycles. https://science.nasa.gov/earth/milankovitch-orbital-cycles-and-their-role-in-earths-climate/ (2026-10-23)
NASA, Climate and Earth’s Energy Budget. https://science.nasa.gov/earth/earth-observatory/climate-and-earths-energy-budget/ (2026-10-23)
NOAA NWS, Why Do We Have Seasons?. https://www.weather.gov/lmk/seasons (2026-10-23)
NOAA NCEI, U.S. Climate Normals. https://www.ncei.noaa.gov/products/land-based-station/us-climate-normals (2026-10-23)
KMA, Climate normals 1991–2020. https://data.kma.go.kr/climate/average30Years/selectAverage30YearsKoreaList.do (2026-10-23)
NOAA GML, Solar Calculation Details. https://gml.noaa.gov/grad/solcalc/calcdetails.html (2026-10-23)
NASA, Sun Facts. https://science.nasa.gov/sun/facts/ (2026-10-23)
More exhibits
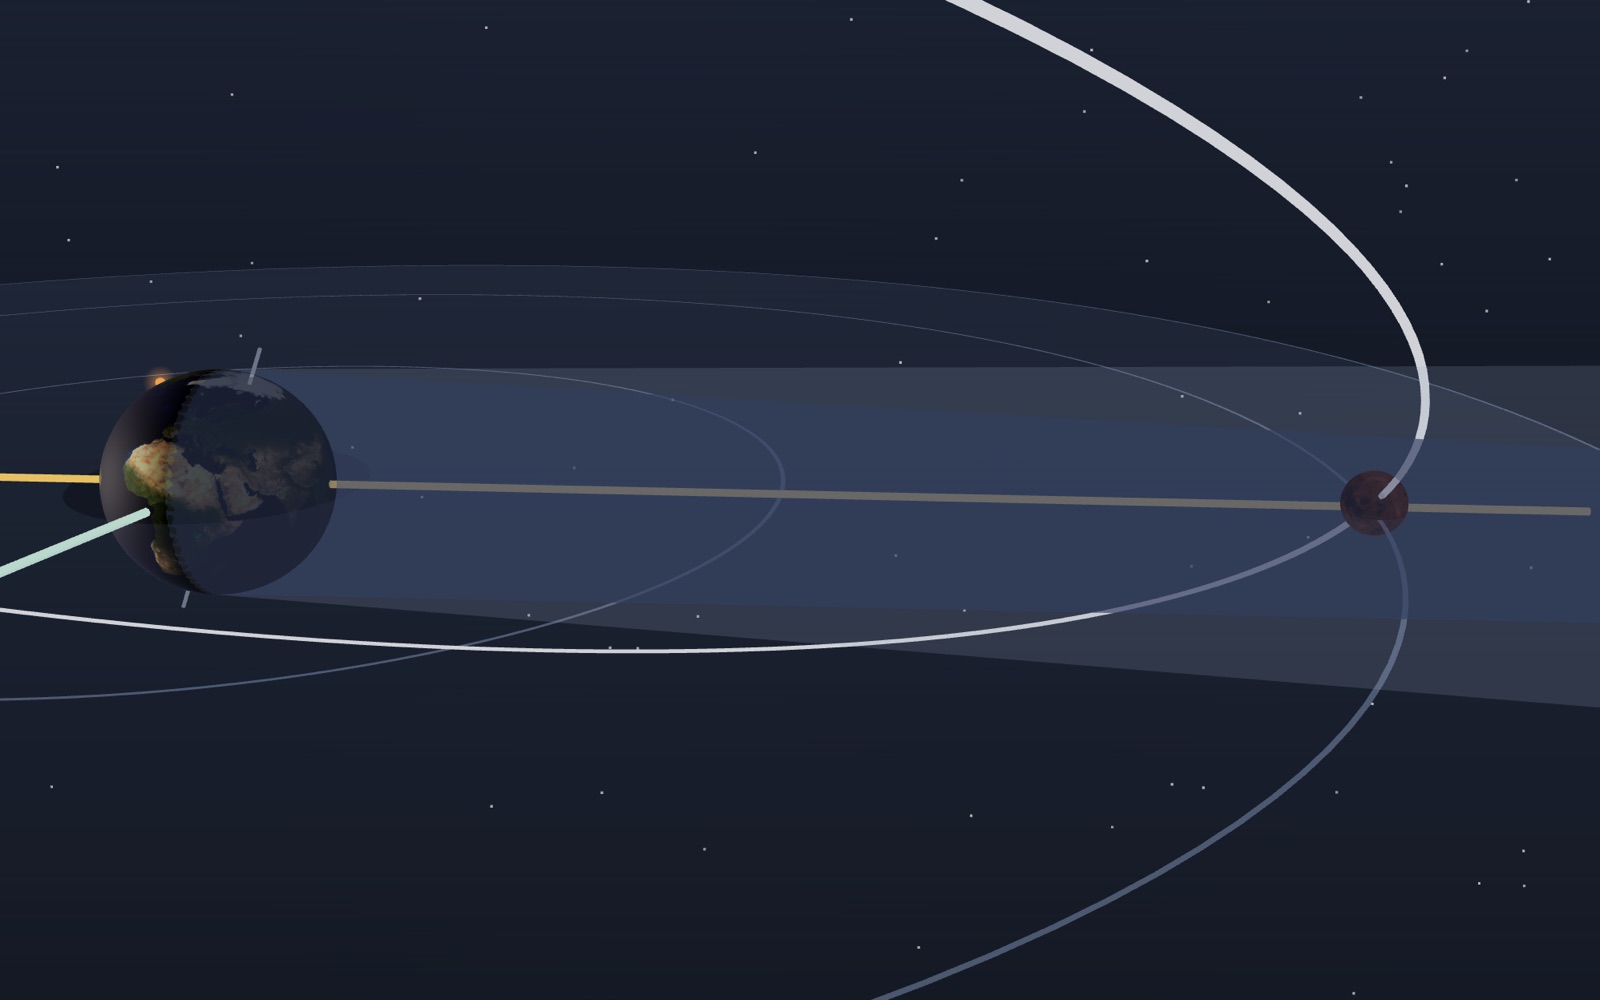
Moon phases: why a crescent is not Earth’s shadow
The Moon passes between the Earth and the Sun every 29.5 days, so why is there no solar eclipse every month?
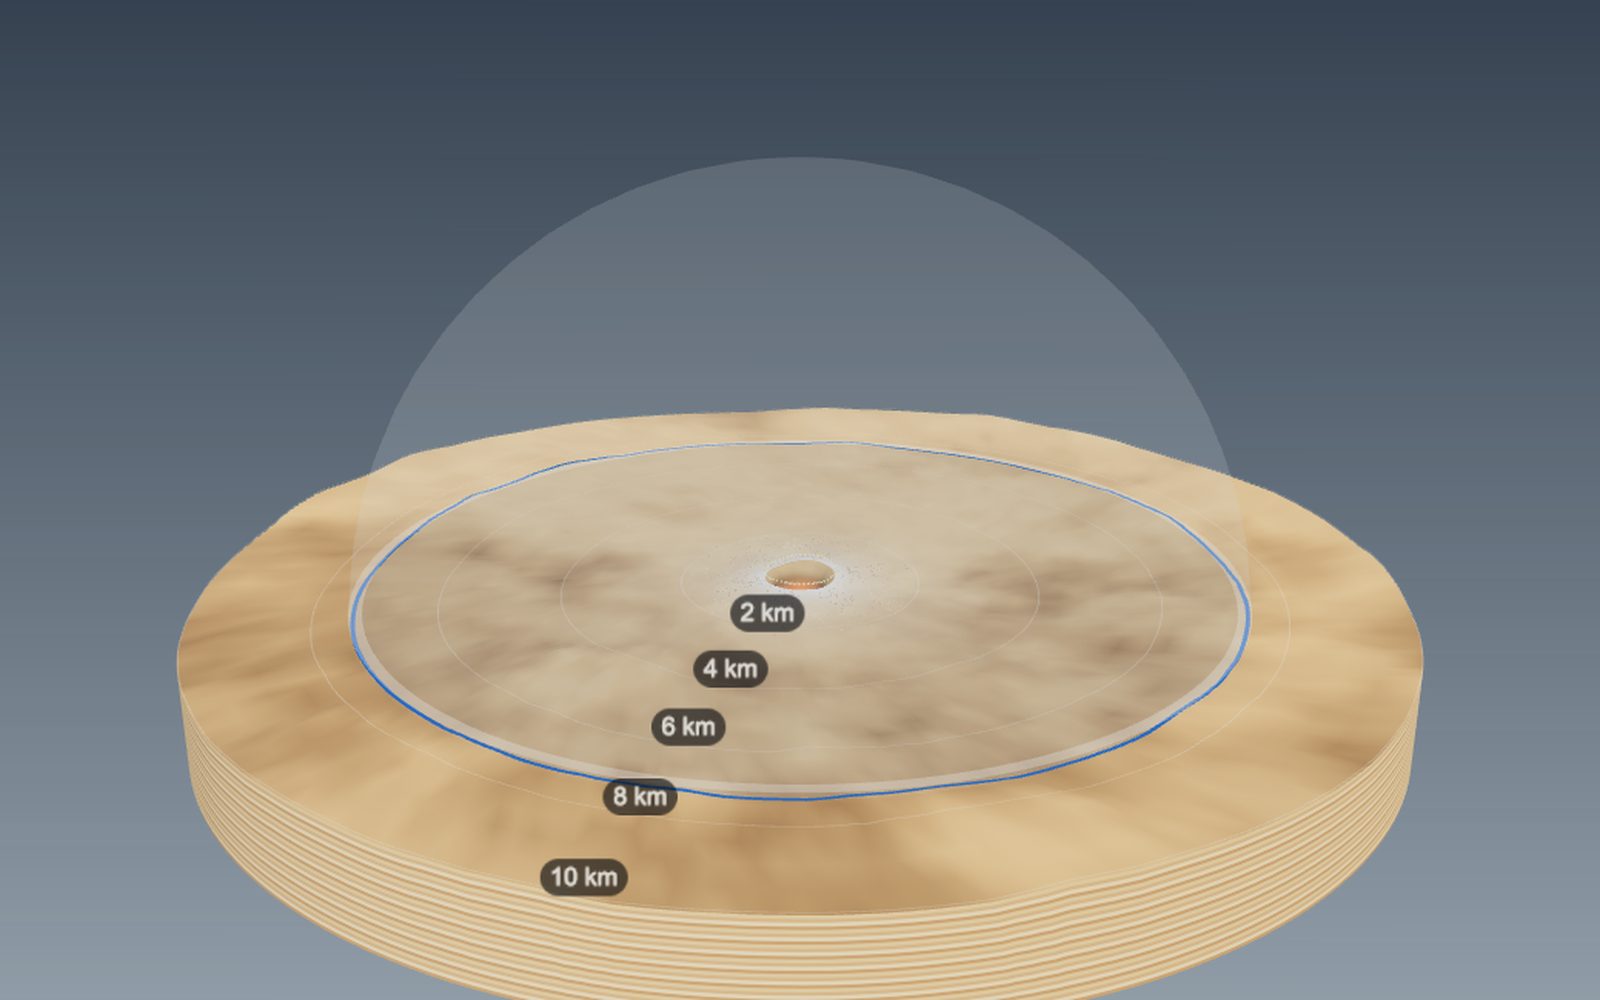
How big a crater would an asteroid make, and how craters form
The 1.2 km wide Meteor Crater in Arizona was dug by an iron asteroid only a few tens of metres across.
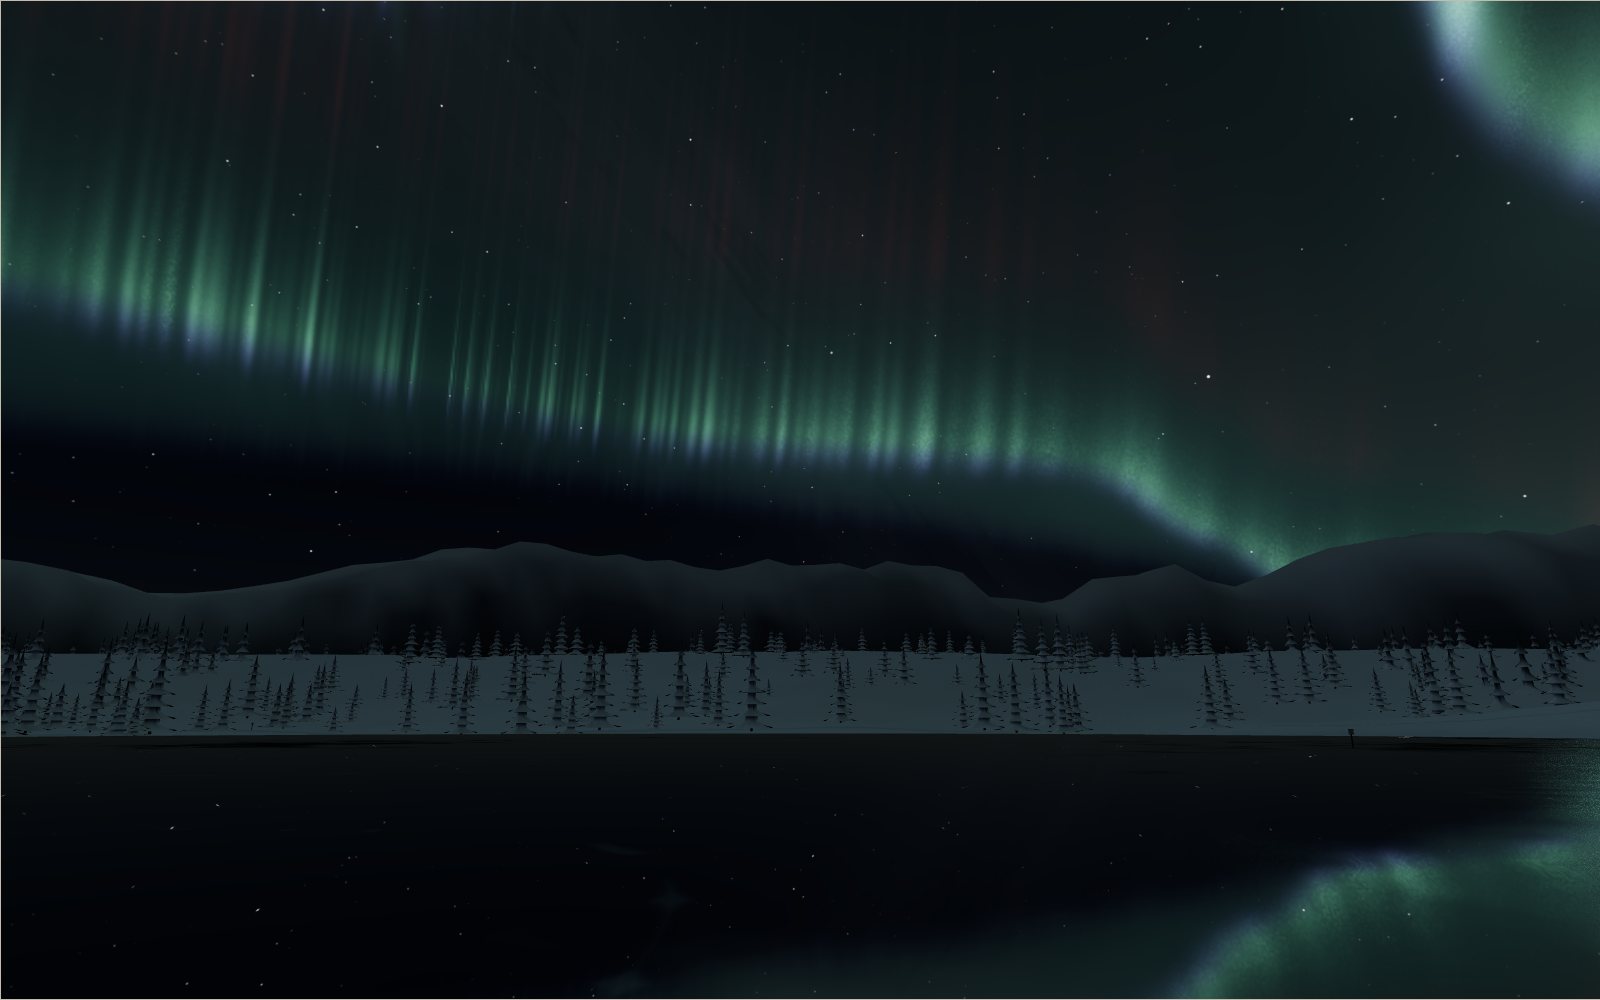
Northern lights over an Arctic village
The green of the northern lights comes from oxygen about 100 km up, and in the biggest storms the red glow above it can be seen as far south as Korea.
How tides work
The Moon raises the sea on the side of the Earth facing it, so why is there a second high tide on the side facing away?
Satellites orbiting Earth right now
On 20 October 2026 the public catalogue listed 16,768 working satellites, and two in every three belonged to one company's internet network.
Your weight and jump height on other planets and moons
A 50 cm jump on Earth becomes a 3 m leap on the Moon, 18 m on Ceres and a one-way trip off asteroid Bennu.