FIG. 25How It Works
How tides work
The Moon raises the sea on the side of the Earth facing it, so why is there a second high tide on the side facing away?
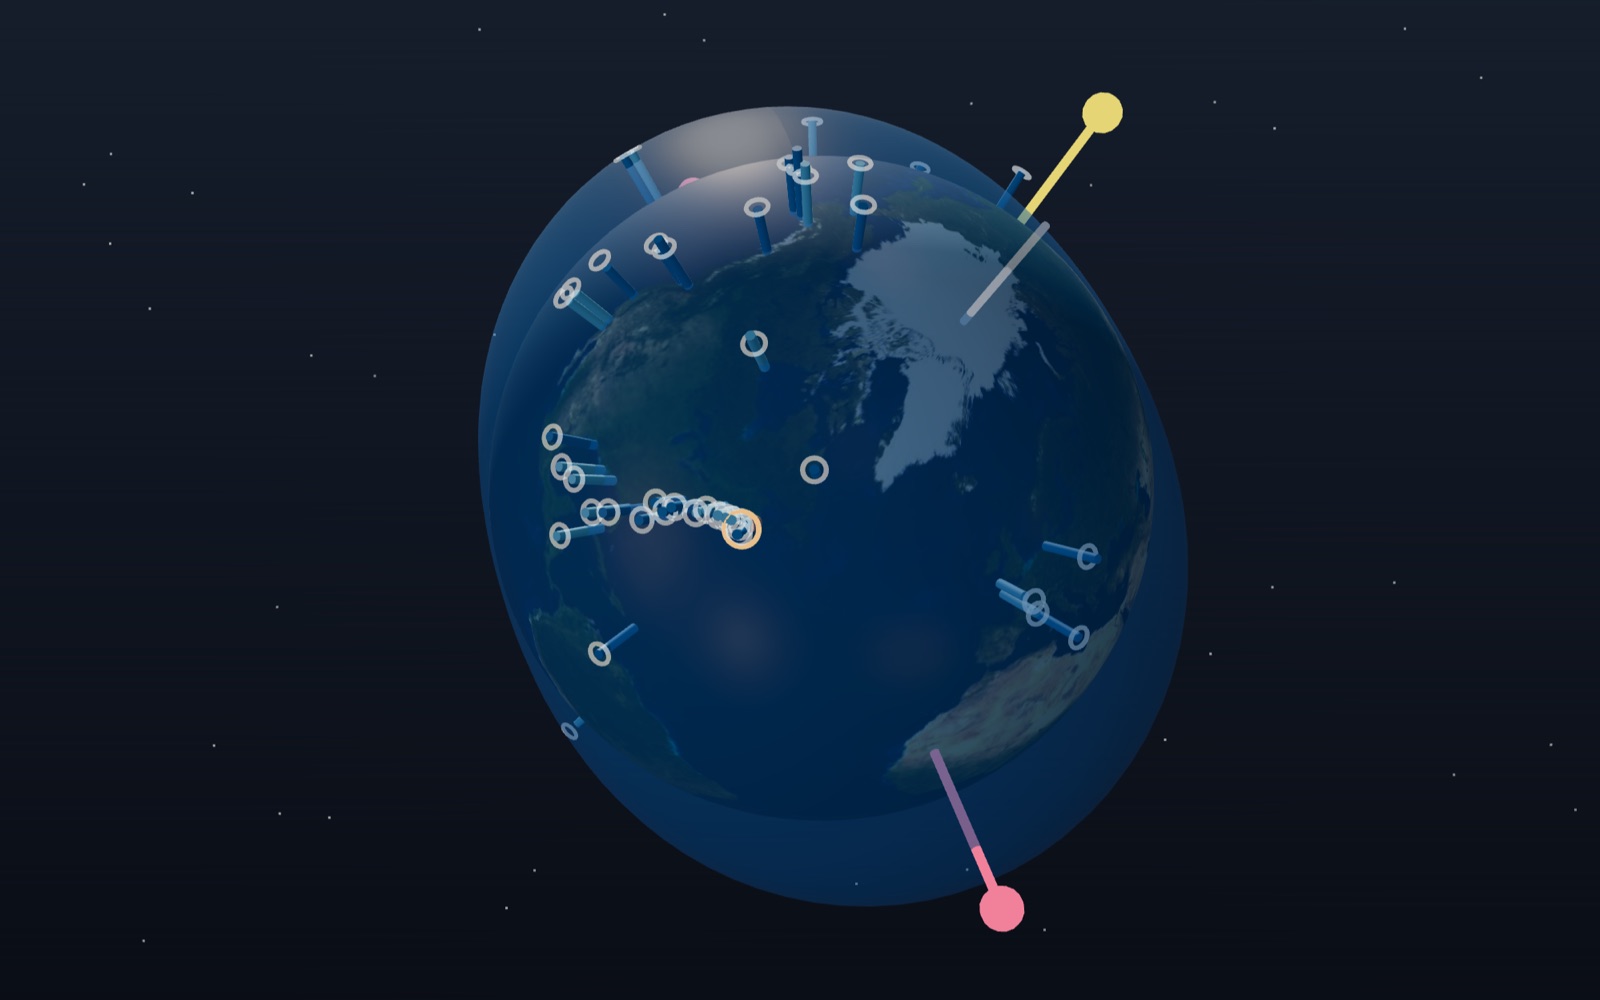
This device cannot show the 3D model. You can read the guide steps below as text.
1 / 8 Earth, Moon, Sun and two bulgesThe Sun stays on the left; this frame turns with the Earth. The blue shell is the sea, with its height stretched 2.5 million times. Use the date and time sliders on the Controls tab to move through two months.
Drag to turn. Scroll or pinch to zoom.
What the model shows
Stand on a beach for an afternoon and the waterline moves. Rocks that were dry at lunch are under water by evening, and a few hours later they come out again. The Moon is the main cause, which most people know. The puzzle is the timing: the sea rises about twice a day, not once, and the second high tide comes when the Moon is on the far side of the Earth, under your feet.
This exhibit shows why. The Earth sits in the middle, the Moon goes round it, and the Sun stays on the left, because the frame turns with the Earth on its trip around the Sun. The blue shell around the Earth is the sea. Its height follows a simple formula called the equilibrium tide, and it is stretched 2.5 million times so that the bulges can be seen at all. The readout in the top left gives the time, the Moon's phase, the angle between the Sun and the Moon, the kind of tide, the height of the water at a site near Incheon and the time of the next high water there. The graph in the bottom right draws the same height for 48 hours.
On the Controls tab you can move the date over 60 days and the time of day in 15-minute steps. The Sun's tide can be switched off to see the Moon's part alone, and True height puts the bulges back to their real size, which makes them vanish.
Why the far side bulges too
Gravity gets weaker with distance. The Moon pulls on every part of the Earth, but not equally: the ocean on the side facing the Moon is about 6,371 km closer to it than the Earth's centre, and the ocean on the far side is 6,371 km further away. The Moon is on average 384,400 km away, or 60.3 Earth radii, so the pull at the near side is (60.3 / 59.3)² = 1.034 times the pull at the centre, and at the far side it is (60.3 / 61.3)² = 0.968 times.
The whole Earth is falling around the Moon (more exactly, the two go around their common centre of mass), and it falls at the rate set by the pull on its centre. What matters for the water is the difference between the local pull and that shared fall. On the near side the Moon pulls a little harder than it pulls the centre, so the water is drawn toward the Moon. On the far side the Moon pulls a little less than it pulls the centre, so the water is left behind as the Earth is drawn away from it. Both effects point away from the Earth's centre, and that is why there are two bulges, not one.
The second guide step shows the three pulls as arrows. Because the drawn Moon is only 5.7 Earth radii away, the near arrow is 1.47 times the centre arrow and the far one 0.72 times. On the real Earth the difference is the 3% worked out above. The third step takes the centre arrow away from every point on a ring around the Earth. What is left is the tidal force: outward along the Earth–Moon line on both sides, inward around the middle.
How big the tidal force is
For a point at distance r from the Earth's centre, the difference between the Moon's pull there and at the centre is, to a very good approximation,
F = (G M r / d³) × (3 cos θ m̂ − n̂), with the largest value 2 G M r / d³
where M is the Moon's mass, d its distance, n̂ the direction of the point from the Earth's centre, m̂ the direction of the Moon and θ the angle between them. The important part is d³. A plain pull falls with the square of the distance, but a difference between two pulls falls one power faster.
With the NASA values (Moon 7.346 × 10²² kg, distance 384,400 km, Earth radius 6,371 km) the largest tidal acceleration is 1.10 × 10⁻⁶ m/s². That is about one nine-millionth of the gravity we feel at the surface (9.81 m/s²). It is small, but it acts on every drop of the ocean, and it changes direction as the Earth turns. The arrows on the white ring in the model follow the bracket in the formula: two units long and pointing out along the Moon line, one unit long and pointing in at 90°.
From force to water height
If the oceans covered the whole Earth and had time to settle, the sea surface would take the shape where the tidal force and the Earth's own gravity balance. Newton explained the tides with gravity in 1687, and this balance gives the equilibrium tide:
h = K × (3 cos²θ − 1) / 2, with K = (M / M_Earth) × R⁴ / d³
Here R is the Earth's radius. For the Moon, this gives K = 0.357 m. Directly under the Moon (θ = 0°) and on the opposite side (θ = 180°) the sea stands 36 cm above its average level. Along the ring at 90° it stands 18 cm below. The full range at a point on the Moon's path is 1.5 K = 0.54 m. The 3D shell uses this formula for every vertex, and the corner graph uses it for the site near Incheon. The height in the readout is taken from the 3D model and the graph is computed separately; the two agree to the centimetre.
Two high tides a day: 24 hours 50 minutes
The bulges stay lined up with the Moon while the Earth turns underneath them, so a point on the coast passes through one bulge, then a low, then the other bulge, then another low. If the Moon stood still that would take 24 hours. But the Moon moves the same way the Earth turns, about 12.2° a day against the Sun, so the Earth has to turn a little further to bring the site back under the Moon. The time from one passage to the next is the lunar day:
lunar day = 24 h / (1 − 1 / 29.5306) = 24.841 h = 24 h 50.5 min
Half of it, 12 h 25 min, is the spacing between high waters. NOAA gives the same numbers. Put the site on the equator (the Controls tab has a switch) and run the clock: over the 60 days from 16 October 2026 the model finds 116 high waters, spaced 12.43 hours apart on average.
At Incheon's latitude the picture is less tidy. In 2026 the Moon swings up to about 28° north and south of the equator each month, so one bulge passes north of the equator and the other south. A site at 37.45°N then goes through the middle of one bulge and only the edge of the other, and the two highs of the day are unequal. This is called the diurnal inequality. Over the same 60 days the model at Incheon misses 2 of the expected high waters, because on those days the smaller high fades into a slight shoulder on the curve. You can see the tall and short peaks alternate in the graph.
The Sun's share: 46%
The Sun raises tides in the same way. Its pull on the Earth is about 180 times the Moon's, but tidal force depends on M / d³, not M / d². The Sun is 27.1 million times as massive as the Moon and 389 times as far away:
Sun / Moon = (1.9885 × 10³⁰ / 7.346 × 10²²) × (384,400 / 149,600,000)³ = 0.459
So the Sun's tide is 46% of the Moon's, with K = 0.164 m. NOAA puts it as "about half". The orange arrows in the model are drawn at this ratio.
Spring tides and neap tides
The two tides add up. When the Sun and the Moon are in line, at new moon and at full moon, both sets of bulges point the same way and the range grows. When they are at right angles, at first and last quarter, the Sun's bulges sit where the Moon's lows are, filling them in and trimming the Moon's highs.
For a site on the Moon's path, the size of the twice-daily tide relative to the Moon's tide alone is
f = √(1 + r² + 2 r cos 2E), with r = 0.459 and E the angle between the Sun and the Moon
At E = 0° or 180° that gives f = 1.46, a spring tide. At E = 90° it gives f = 0.54, a neap tide. The spring range is 2.7 times the neap range. The readout shows this factor and calls it a spring tide above 1.33 and a neap tide below 0.72. Spring tides come twice in each synodic month of 29.53 days, about every 14.8 days. The name has nothing to do with the season; NOAA traces it to the tide "springing forth".
Between spring and neap, the line through the two high-water points does not point straight at the Moon. It leans toward the Sun by up to ½ asin(0.459) = 13.7°, which happens when cos 2E = −0.459. The pink high-water line in the model shows the lean.
The Moon's distance also matters, because K goes with 1/d³. NASA lists a mean perigee of 363,300 km and a mean apogee of 405,500 km. At perigee the Moon's tide is (384,400 / 363,300)³ = 1.18 times its mean value, and at apogee 0.85 times. The model keeps the Moon at its mean distance, so it does not show this. The Korea Hydrographic and Oceanographic Agency (KHOA) pointed to this effect in October 2016, when a spring tide close to perigee gave the largest range of that year.
What the model changes
- Heights are stretched 2.5 million times, and the water shell is drawn about 700 km thick so that its low points stay above the land. True height sets the stretch to 1.
- The Moon is drawn 10.6 times closer than it is, and the Sun far closer and smaller. Directions are right; distances are not.
- The Sun and the Moon move at their mean rates (the same model as the moon-phases exhibit), with the Moon at its mean distance. The mean Moon can be several degrees away from the true one, which shifts the modelled high waters by up to about half an hour.
- The equilibrium tide assumes an ocean that covers the whole Earth and answers at once. There are no continents, no depth, no friction and no delay.
Why real coasts differ
Real oceans are broken up by continents and are shallow compared with their width. The tide cannot keep pace with the Moon as a standing bulge, so it travels around each ocean basin as a long wave, and each basin and bay responds in its own way. The equilibrium range is under 80 cm everywhere. Real ranges can be far larger, or almost zero, and high water at a given port arrives at its own delay after the Moon passes, which only local measurements can tell you.
The west coast of Korea has some of the largest. KHOA forecast a range of 9.9 m at Incheon and 10.1 m at Pyeongtaek for 17 and 18 October 2016, against 1.5 to 2.9 m on the south-east coast around Busan. Incheon's figure is about 13 times the equilibrium spring range. Fisheries and Oceans Canada gives 16 m as the world's largest range, in the Minas Basin of the Bay of Fundy. There, water takes about 13 hours to rock from the mouth of the bay to its head and back, close to the 12 hours 25 minutes of the tide, so each tide pushes the swing a little higher. Parks Canada gives up to 12 m at Fundy National Park, lower down the same bay.
So the model is good for the causes (two bulges, the 24 h 50 min rhythm, spring and neap tides) and wrong for the sizes and times at any real harbour. For those, use the tide tables of the national hydrographic office: KHOA for Korea, NOAA for the United States, the Canadian Hydrographic Service for Canada.
Comparing the Moon and Sun with a calculation
The ratio 0.459 becomes easier to interpret if the Moon is the unit. Divide 1 by 0.459 and the Moon's tide-raising effect is about 2.18 times the Sun's, usually rounded to 2.2:1. This compares the differential gravitational acceleration across Earth, not the total attraction on Earth, and not measured water heights at two different beaches. A harbour with a small range is not receiving less lunar gravity than a neighbouring harbour with a large range. Its water is responding differently to the same astronomical forcing.
A useful distance experiment can be done on paper even though the exhibit has no distance slider. Suppose, as an invented example, the same Moon were twice as far away. Its ordinary attraction would become 1/4 as large, but its tide-raising effect would become 1/8 as large. Bringing it to half the distance would multiply the tidal effect by 8. These are comparisons at fixed mass and fixed Earth radius; they do not describe a possible rapid change of the real lunar orbit. The extra power of distance comes from subtracting the acceleration of Earth's centre from that of nearby water.
The same distinction explains why a photograph can be misleading. The model draws a nearby Moon so that its position is easy to see, but the calculation still uses the astronomical distance. Measuring the gap between the drawn spheres and putting that gap into a gravity formula would produce a different and much stronger tide. Use the physical values in the text for calculations, and the drawn directions for interpreting the arrows. The display is a diagram of the cause, not a scale drawing of the entire Earth-Moon system.
Reading a tidal clock rather than a calendar day
Two high waters per lunar day do not mean two high waters inside every midnight-to-midnight interval. The interval used by the dominant lunar twice-daily component is about 12 h 25 min. Starting from an assumed high water at midnight, a uniform sequence would put the next near midday and the following one after the next midnight. The civil date can therefore contain only one high water even though the underlying oscillation has not stopped. This example assumes a regular lunar component; it is not a prediction for Incheon.
The 50-minute daily shift is also an average, not a rule for adding a fixed number to yesterday's tide table. Solar and lunar components change their relative phase. The Moon's declination changes the relative heights of alternate peaks, and coastal response changes their timing. NOAA distinguishes semidiurnal tides, with two roughly similar highs, mixed semidiurnal tides, with unequal highs, and diurnal tides, with one high and one low. The equilibrium picture is useful for understanding the lunar rhythm but does not replace those local classifications.
There is another clock hidden in the calculation. A lunar month of 29.5306 days measures the Moon's phase relative to the Sun, which is why it belongs in the formula based on a 24 h solar day. Combining a solar day with a lunar orbital period measured against the stars would mix reference frames. The formula here keeps both motions relative to the Sun. Its result is the mean interval between successive meridian passages, not the duration of daylight and not the time between every pair of observed high waters.
Turning the spring-neap factor into metres
Range is a difference of levels, not the height of one crest above the average. For the lunar equilibrium tide on its path, K = 0.357 m gives a high level K and a low level −K/2. Subtraction gives 1.5 K = 0.5355 m. Rounding this to 0.54 m is appropriate for an idealised ocean. Calling the range 0.357 m would leave out the fall below the average level, while doubling K would incorrectly make the trough as deep as the crest is high.
Using the unrounded factors 1.459 and 0.541 gives an illustrative spring range 0.5355 × 1.459 = 0.7813 m and neap range 0.5355 × 0.541 = 0.2897 m. Their ratio is about 2.70. These numbers assume the simple twice-daily component at a suitable site; the moving latitude and changing declination in the exhibit mean a selected location need not trace precisely these limiting values. They are a check on the scale of the theory, not additional predictions for a Korean port.
A neap tide is not an absence of tide. At right angles, the solar contribution opposes part of the lunar height pattern, but the Sun's 0.459 contribution cannot cancel the Moon's unit contribution. Nor does a spring tide imply that the Sun is closer to Earth or that the season is spring. Alignment changes which height patterns reinforce each other. At full moon the Sun and Moon lie on opposite sides of Earth, yet each produces a two-sided pattern, so their twice-daily effects reinforce rather than cancel. Thinking about two bulges instead of a single pull avoids this common mistake.
Comparing coastal ranges without confusing the measurements
The Bay of Fundy's often quoted 16 m is a large range in the upper bay, not a wall of water rising everywhere along Canada's Atlantic coast. NOAA identifies the bay as the location of the highest tides; the Canadian Hydrographic Service explains its shape and resonance. The Canadian sources distinguish the upper basin from Fundy National Park, where the quoted upper range is 12 m. Those values can both be correct because they refer to different places. A range must always be attached to a site and to the conditions under which it was measured or predicted.
The Korean figures need the same care. The KHOA release linked below forecast 9.9 m at Incheon during the October 2016 event. That is a dated forecast for a large tide, not Incheon's constant daily range and not a new measurement made by this exhibit. Saying the west coast has ranges of roughly 9 m is a broad description; using 9.9 m for every day would be wrong. The east and south coasts need their own tide tables, even when the Moon has the same phase over the whole peninsula.
The narrowing of a bay is only part of the explanation. Water has inertia, and the basin has a characteristic response time. When repeated forcing arrives at a favourable part of that response, the oscillation grows, much as repeated pushes can increase a swing's movement. Friction limits the growth. Continental barriers and changing depth alter the wave path, so a coastal peak can occur well after the Moon's passage. Range alone also does not specify current speed: a narrow channel can carry a strong flow while adjacent open water changes level more gently. Safe shore access requires local predictions and weather information, neither of which this diagram supplies.
Experiments using the controls on this page
Start with the equator option in Controls and leave the Sun's tide enabled. Pause the motion and move the date until the Sun-Moon angle is near 0° or 180°. Read the tide factor, then move toward 90° and compare it. The expected change is from reinforcement toward partial cancellation. Watch the 48 h graph rather than judging only the apparent thickness of the blue shell; its deliberately enlarged geometry makes small theoretical heights visible but is not a ruler for actual sea level.
At a date between these alignments, switch off the Sun's tide. The remaining curve is the lunar contribution. Switching the Sun back on does not simply lift the whole curve upward. It changes highs and lows differently, and can shift the direction of the combined high-water line. Compare the dashed lunar curve with the combined curve where they are shown. Keep the date and site unchanged while making this comparison, otherwise a change in declination or time can be mistaken for the Sun's contribution.
Next change from the equator to the site near Incheon. Follow the alternating tall and short peaks and compare their spacing. A weak peak can become a shoulder, so counting every visible wiggle as a separate high water is not reliable. Finally enable True height. The bulges become practically invisible at the scale of the Earth, but the physical tide has not been removed; only the height exaggeration has changed. Restore the exaggerated view before trying to follow the surface visually. None of these controls adds coastlines, basin depth or harbour delays to the physical calculation.
Record the angle and the displayed factor together when comparing dates. A high-water time without its date and selected site is ambiguous, particularly if the readout marks the next day rather than the current day.
Predicting a real harbour from harmonic constants
The equilibrium tide in the 3D model is a teaching device: it assumes the ocean answers the Moon and the Sun at once. A real harbour is predicted in a different way. Tide gauges record the water level every few minutes for a year or more, and the record is split into constituents. Each constituent is a cosine with a fixed speed set by astronomy. M2, the main lunar constituent, repeats every 12.42 hours. S2, the main solar one, repeats every 12 hours. N2 follows the changing distance of the Moon, K1 and O1 follow its height north or south of the equator, and so on. The speeds are the same everywhere on Earth. What changes from place to place is the amplitude of each constituent and its phase lag, the delay between the astronomical push and the local response. Those pairs of numbers are the harmonic constants of the station.
The Controls tab now uses them. For a station, the height at any moment is the sum over its constituents of f × H × cos(V + u − κ). H is the amplitude and κ the phase lag published or fitted for that station. V is the astronomical argument of the constituent at that moment, built from the mean longitudes of the Moon, the Sun, the lunar perigee and the Moon's node (the polynomials in Jean Meeus, Astronomical Algorithms). f and u are small corrections for the 18.6 year cycle in the tilt of the Moon's orbit; in a year when the Moon swings far north and south, the twice daily lunar tide is a few percent weaker and the once daily tides are stronger. The formulas for V, f and u are those of Paul Schureman's Manual of Harmonic Analysis and Prediction of Tides (US Coast and Geodetic Survey, 1958), still the reference for the NOAA tables.
The page checks this calculation against the official tables. For all 31 NOAA stations in the catalogue, the predicted high and low waters for November 2026 were compared with NOAA's own predictions relative to mean sea level. The median time difference is about 1.5 minutes and the median height difference about 1 cm. The largest differences are at Anchorage, where NOAA uses 120 constituents and the page uses the 35 that matter most elsewhere, so high waters there can differ by 10 to 20 minutes and 10 to 20 cm, and at the Gulf of Mexico stations, where the crest of a once daily tide is so flat that a centimetre of height moves the time of the peak by many minutes.
Constants that the page fitted itself
Not every agency publishes its constants in a form that a web page can read. For five Canadian stations, including Burntcoat Head and Parrsboro in the Bay of Fundy, the page took the Canadian Hydrographic Service's hourly predictions for 2026 and fitted 32 constituents to them by least squares. For ten other harbours, including Brest, Newlyn, Cuxhaven, Broome, Darwin and Sydney, it fitted the same set to one full year of hourly observed sea level from the University of Hawaii Sea Level Center. Each of these entries shows its fit residual in centimetres. For the Canadian stations that residual is how far the fitted curve sits from the official prediction. For the observed records it also contains the weather, because wind and air pressure push the sea up and down by tens of centimetres on top of the tide. Cuxhaven, at the mouth of the Elbe, has the largest residual, around 40 cm, because storms in the German Bight and the river flow are large there.
Korea is the obvious gap. The Korea Hydrographic and Oceanographic Agency publishes official tide predictions for Incheon and other ports, but its open data service asks for a personal service key, so the page does not copy those constants. Incheon and Pyeongtaek appear in the catalogue with the largest range expected for mid October 2016 in a government release, and without a curve.
Why harbours have different kinds of tide
Open the catalogue and filter by tide type. Most of the Atlantic coast of North America and Europe has two nearly equal high waters a day. Much of the Pacific coast of North America has two high waters of different heights. Pensacola and Grand Isle on the Gulf of Mexico usually have only one. A single number sorts them: the form number F = (K1 + O1) / (M2 + S2), the ratio of the main once daily constituents to the main twice daily ones. Below 0.25 the tide is semidiurnal, from 0.25 to 1.5 mixed and mainly semidiurnal, from 1.5 to 3 mixed and mainly diurnal, and above 3 diurnal. Pensacola's F is above 11. Brest's is 0.05.
The reason is resonance. Each ocean basin has its own natural periods of sloshing, set by its size and depth. The Gulf of Mexico responds weakly to the 12 hour forcing and strongly to the 24 hour one, while the North Atlantic does the opposite. The Bay of Fundy and the Gulf of Maine together have a natural period close to 13 hours, near enough to the 12.42 hours of M2 that the tide grows to the largest range on Earth (Garrett 1972, Nature). The columns on the globe show the same thing in another way: at any moment, neighbouring stations can be rising and falling at once, because the tide is a set of waves turning around each basin rather than a bulge sliding under the Moon.
The age of the tide
The 30 day chart puts each day's range under the real phases of the Moon. Spring tides come with new and full Moon, as the equilibrium model predicts, but at most harbours they arrive a day or two later. At Burntcoat Head the delay is about 54 hours, at Brest about 40 hours, at New York about 24 hours. This delay is called the age of the tide. It can be read straight from the constants: the largest range comes when M2 and S2 are in step, and that happens (κS2 − κM2) divided by the difference of their speeds after the syzygy. A difference of 10° in phase lag corresponds to about 9.8 hours. A few Pacific stations have S2 slightly ahead of M2, and their spring tides come a little before new and full Moon.
The quick jumps on the stage use the station's own curve, not the equilibrium factor. Next spring tide looks through the next 15 days for the day with the largest range and moves the date to its highest water; Next neap tide finds the smallest range. Compare the date with the full or new Moon mark in the chart and the age of the tide becomes visible.
Tidal friction and the length of the day
The Earth turns faster than the Moon goes round it, so the water piled up by the tide is carried ahead of the line to the Moon. The Moon pulls the near bulge backward, a brake on the Earth's spin, and the bulge pulls the Moon forward along its orbit, which lifts it into a wider orbit. Tidal lag on the stage shows the bulge turned 12° ahead of the Moon, an exaggerated angle chosen so that it can be seen, with an arrow for the forward tug on the Moon.
Both effects are measured. Laser ranging to the reflectors left by Apollo astronauts shows the Moon moving away by about 3.8 cm a year (Williams and Boggs 2016). Records of ancient eclipses show the day growing longer by about 1.8 milliseconds every 100 years on average since 720 BC; tidal friction alone would give about 2.3, and changes in the Earth's shape since the last ice age make up part of the difference (Stephenson, Morrison and Hohenkerk 2016). Over geological time the change adds up. Growth layers in a 70 million year old rudist shell count 372 days in a year, a day of about 23.5 hours (de Winter and others 2020). Devonian corals show about 400 daily ridges per yearly band (Wells 1963). Tidal layers in the 620 million year old Elatina rocks of South Australia record about 400 days and 13.1 lunar months in a year, and a day of about 21.9 hours (Williams 2000). Climate cycles in 1.4 billion year old rocks in China point to a day of about 18.7 hours (Meyers and Malinverno 2018). The chart in the Controls tab plots these points; the line between them is only a guide, because the rate has changed with the shape of the oceans.
Questions
Why is there a high tide on the side away from the Moon?
Because the Moon pulls the far side less than it pulls the Earth's centre. The Earth as a whole moves toward the Moon at the rate of its centre, so the far-side water lags behind. Seen from the Earth, it is pushed outward, just as the near-side water is pulled outward.
Why is high tide about 50 minutes later each day?
The Moon moves along its orbit in the same direction as the Earth spins. After one turn of the Earth, the Moon has moved on about 12°, and the Earth needs about 50 more minutes to catch up. The tide follows the Moon, so its timetable slips by the same amount.
The Sun pulls harder than the Moon. Why is its tide smaller?
Tides come from the difference in pull across the Earth, and that difference falls with the cube of distance. The Sun is 389 times further away, which cuts its tidal effect by 389³, about 59 million times. Its 27-million-fold mass does not make up for that, and its tide ends up at 46% of the Moon's.
Why don't the times in the model match the tide table for Incheon?
The model shows the equilibrium tide, which assumes the water answers at once. Real tides travel around ocean basins as long waves, so high water at each port arrives at its own delay after the Moon passes, and the range depends on the shape of the coast. Use KHOA's tide predictions for real times.
Do lakes have tides?
Yes, but very small ones. Fisheries and Oceans Canada reports a range of about 0.03 m in the Great Lakes, too small to see against the effects of wind and air pressure. Most lakes are too small for the tidal force to tilt their surface noticeably.
How many spring tides are there in a year?
Two in every synodic month of 29.53 days, one near each new moon and one near each full moon, so about 25 a year. They come in every season.
Does the Moon's distance change the tide?
Yes. Tidal force goes with the inverse cube of distance, so the Moon's tide is about 18% stronger at perigee and 15% weaker at apogee than at the mean distance. A spring tide near perigee gives some of the largest ranges of the year.
Does a neap tide mean the sea stops moving?
No. The Sun partly opposes the lunar height pattern, but its contribution is too small to cancel it. Currents and changing levels remain; use local predictions for safety.
Is tidal range the height above mean sea level?
No. It is the difference between a high water and a low water. A crest above the average is only part of that difference.
Can I use the graph to plan a visit to a tidal flat?
No. It lacks coastal geometry, basin depth, friction and weather. Consult the local hydrographic service and access restrictions instead.
How accurate are the station curves?
At the NOAA stations the page reproduces NOAA's November 2026 high and low waters to about 1.5 minutes and 1 cm in the median. These are predictions of the astronomical tide only. Wind, air pressure and river flow change the real water level, by tens of centimetres in a storm, and the curves do not include them.
Why does Burntcoat Head have the largest range?
The Bay of Fundy and the Gulf of Maine together slosh with a natural period of about 13 hours, close to the 12.42 hour period of the main lunar tide. The basin is pushed nearly in time with its own rhythm, and the range at the head of Minas Basin reaches 14.6 m in 2026 on this page's constants.
Is the Moon really moving away because of the tides?
Yes. The tidal bulge carried ahead of the Moon pulls it forward and lifts it into a wider orbit, about 3.8 cm a year by lunar laser ranging. The same friction slows the Earth, and the day grows longer by about 1.8 milliseconds every 100 years on average.
Terms
- Tide: the regular rise and fall of the sea caused by the Moon and the Sun.
- High water, low water: the highest and lowest levels of one tidal cycle.
- Tidal range: the difference in height between a high water and the next low water.
- Tidal force: the difference between a body's pull at a point and its pull at the Earth's centre.
- Equilibrium tide: the sea surface the tidal force would make on an Earth covered with water that answers at once.
- Lunar day: the time between two passages of the Moon over the same meridian, 24 hours 50 minutes on average.
- Spring tide: a tide with a large range, near new and full moon.
- Neap tide: a tide with a small range, near first and last quarter.
- Diurnal inequality: the difference in height between the two high (or low) waters of one day.
- Perigee, apogee: the nearest and furthest points of the Moon's orbit.
- Harmonic constants: the amplitude and phase lag of each tidal constituent at one place, found from a long record.
- Constituent: one cosine term of the tide with a fixed astronomical speed, such as M2 (12.42 h) or K1 (23.93 h).
- Form number: F = (K1 + O1) / (M2 + S2), which sorts a tide into semidiurnal, mixed or diurnal.
- Age of the tide: the delay between new or full Moon and the largest range at a place.
- Tidal friction: the loss of the Earth's spin to the tides, which also moves the Moon outward.
Sources
NOAA National Ocean Service, "Tides and Water Levels: What Causes Tides?". https://oceanservice.noaa.gov/education/tutorial_tides/tides02_cause.html (checked 2026-10-16)
NOAA National Ocean Service, "Tides and Water Levels: Gravity, Inertia, and the Two Bulges". https://oceanservice.noaa.gov/education/tutorial_tides/tides03_gravity.html (checked 2026-10-16)
NOAA National Ocean Service, "Tides and Water Levels: The Lunar Day". https://oceanservice.noaa.gov/education/tutorial_tides/tides05_lunarday.html (checked 2026-10-16)
NOAA National Ocean Service, "Tides and Water Levels: Variations in Tides". https://oceanservice.noaa.gov/education/tutorial_tides/tides06_variations.html (checked 2026-10-16)
NOAA National Ocean Service, "What is a spring tide?". https://oceanservice.noaa.gov/facts/springtide.html (checked 2026-10-16)
NOAA National Ocean Service, "Where is the highest tide?". https://oceanservice.noaa.gov/facts/highesttide.html (checked 2026-10-16)
NASA Science, "Tides". https://science.nasa.gov/moon/tides/ (checked 2026-10-16)
NASA Space Science Data Coordinated Archive, "Moon Fact Sheet". https://nssdc.gsfc.nasa.gov/planetary/factsheet/moonfact.html (checked 2026-10-16)
NASA Space Science Data Coordinated Archive, "Sun Fact Sheet". https://nssdc.gsfc.nasa.gov/planetary/factsheet/sunfact.html (checked 2026-10-16)
NASA Space Science Data Coordinated Archive, "Earth Fact Sheet". https://nssdc.gsfc.nasa.gov/planetary/factsheet/earthfact.html (checked 2026-10-16)
Korea Policy Briefing, Ministry of Oceans and Fisheries press release by KHOA, 13 October 2016, "10월 중순, 올해 최대 해수면 높이와 조차 발생" (Incheon 9.9 m, Pyeongtaek 10.1 m). https://www.korea.kr/briefing/pressReleaseView.do?newsId=156160770 (checked 2026-10-16)
Korea Hydrographic and Oceanographic Agency (KHOA). https://www.khoa.go.kr/ (checked 2026-10-16)
Fisheries and Oceans Canada, Canadian Hydrographic Service, "About tides and currents". https://tides.gc.ca/en/about-tides-and-currents (checked 2026-10-16)
Parks Canada, "Tides in Fundy National Park". https://parks.canada.ca/pn-np/nb/fundy/nature/environment/marees-tides (checked 2026-10-16)
U.S. Naval Observatory, "Computing Greenwich Apparent Sidereal Time" (sidereal time used to turn the Earth). https://aa.usno.navy.mil/faq/GAST (checked 2026-10-16)
Calculations on this page: masses and distances from the NASA fact sheets, equilibrium tide h = K (3 cos²θ − 1) / 2, Sun and Moon positions from the mean-motion model of the moon-phases exhibit, obliquity 23.4393°.
NOAA National Ocean Service, "Tidal cycles and effects". https://oceanservice.noaa.gov/education/tutorial_tides/tides07_cycles.html (2026-10-23)
NOAA CO-OPS, harmonic constituents and tide predictions for the 31 stations in the catalogue (Metadata API and Data API). https://api.tidesandcurrents.noaa.gov/mdapi/prod/webapi/stations/9455920/harcon.json (checked 2026-10-27)
NOAA CO-OPS, harmonic constituents page for Anchorage. https://tidesandcurrents.noaa.gov/harcon.html?id=9455920 (checked 2026-10-27)
Schureman, P. (1958) Manual of Harmonic Analysis and Prediction of Tides, US Coast and Geodetic Survey Special Publication 98. https://tidesandcurrents.noaa.gov/publications/SpecialPubNo98.pdf (checked 2026-10-27)
Fisheries and Oceans Canada, Canadian Hydrographic Service, Integrated Water Level System API (2026 predictions). https://api-iwls.dfo-mpo.gc.ca/api/v1/stations (checked 2026-10-27)
University of Hawaii Sea Level Center, hourly sea level data (Brest station page). https://uhslc.soest.hawaii.edu/stations/?stn=822 (checked 2026-10-27)
Garrett, C. (1972) Tidal resonance in the Bay of Fundy and Gulf of Maine, Nature 238. https://doi.org/10.1038/238441a0 (checked 2026-10-27)
Williams, G. E. (2000) Geological constraints on the Precambrian history of Earth's rotation and the Moon's orbit, Reviews of Geophysics 38. https://doi.org/10.1029/1999RG900016 (checked 2026-10-27)
Stephenson, F. R., Morrison, L. V., Hohenkerk, C. Y. (2016) Measurement of the Earth's rotation: 720 BC to AD 2015, Proceedings of the Royal Society A 472. https://doi.org/10.1098/rspa.2016.0404 (checked 2026-10-27)
Williams, J. G., Boggs, D. H. (2016) Secular tidal changes in lunar orbit and Earth rotation, Celestial Mechanics and Dynamical Astronomy 126. https://doi.org/10.1007/s10569-016-9702-3 (checked 2026-10-27)
de Winter, N. J. and others (2020) Subdaily-scale chemical variability in a Torreites sanchezi rudist shell, Paleoceanography and Paleoclimatology 35. https://doi.org/10.1029/2019PA003723 (checked 2026-10-27)
Wells, J. W. (1963) Coral growth and geochronometry, Nature 197. https://doi.org/10.1038/197948a0 (checked 2026-10-27)
Meyers, S. R., Malinverno, A. (2018) Proterozoic Milankovitch cycles and the history of the solar system, PNAS 115. https://doi.org/10.1073/pnas.1717689115 (checked 2026-10-27)
More exhibits
Coral bleaching causes: why warmer water turns reefs white
Corals get most of their food from algae living in their tissue, and when the sea stays more than 1 °C above its usual summer high for weeks, they lose those algae and turn white.

Snowflake growth simulator: grow your own crystal
A snow crystal grown at −15 °C sprouts six branching arms, while one grown at −5 °C becomes a needle 2 mm long.
Why we have seasons: tilted Earth, changing daylight
The Earth is closest to the Sun in the first week of January, in the middle of the northern winter.
Moon phases: why a crescent is not Earth’s shadow
The Moon passes between the Earth and the Sun every 29.5 days, so why is there no solar eclipse every month?
How big a crater would an asteroid make, and how craters form
The 1.2 km wide Meteor Crater in Arizona was dug by an iron asteroid only a few tens of metres across.
Northern lights over an Arctic village
The green of the northern lights comes from oxygen about 100 km up, and in the biggest storms the red glow above it can be seen as far south as Korea.
Walk down the Grand Canyon rock layers
Walk 1,360 m down the Bright Angel Trail through 13 rock layers, from a 270-million-year-old sea floor on the rim to 1.75-billion-year-old schist by the river.
How lightning and thunder work
A lightning channel heats the air to about five times the temperature of the Sun’s surface, and its thunder needs about 3 seconds to cover each kilometre to you.
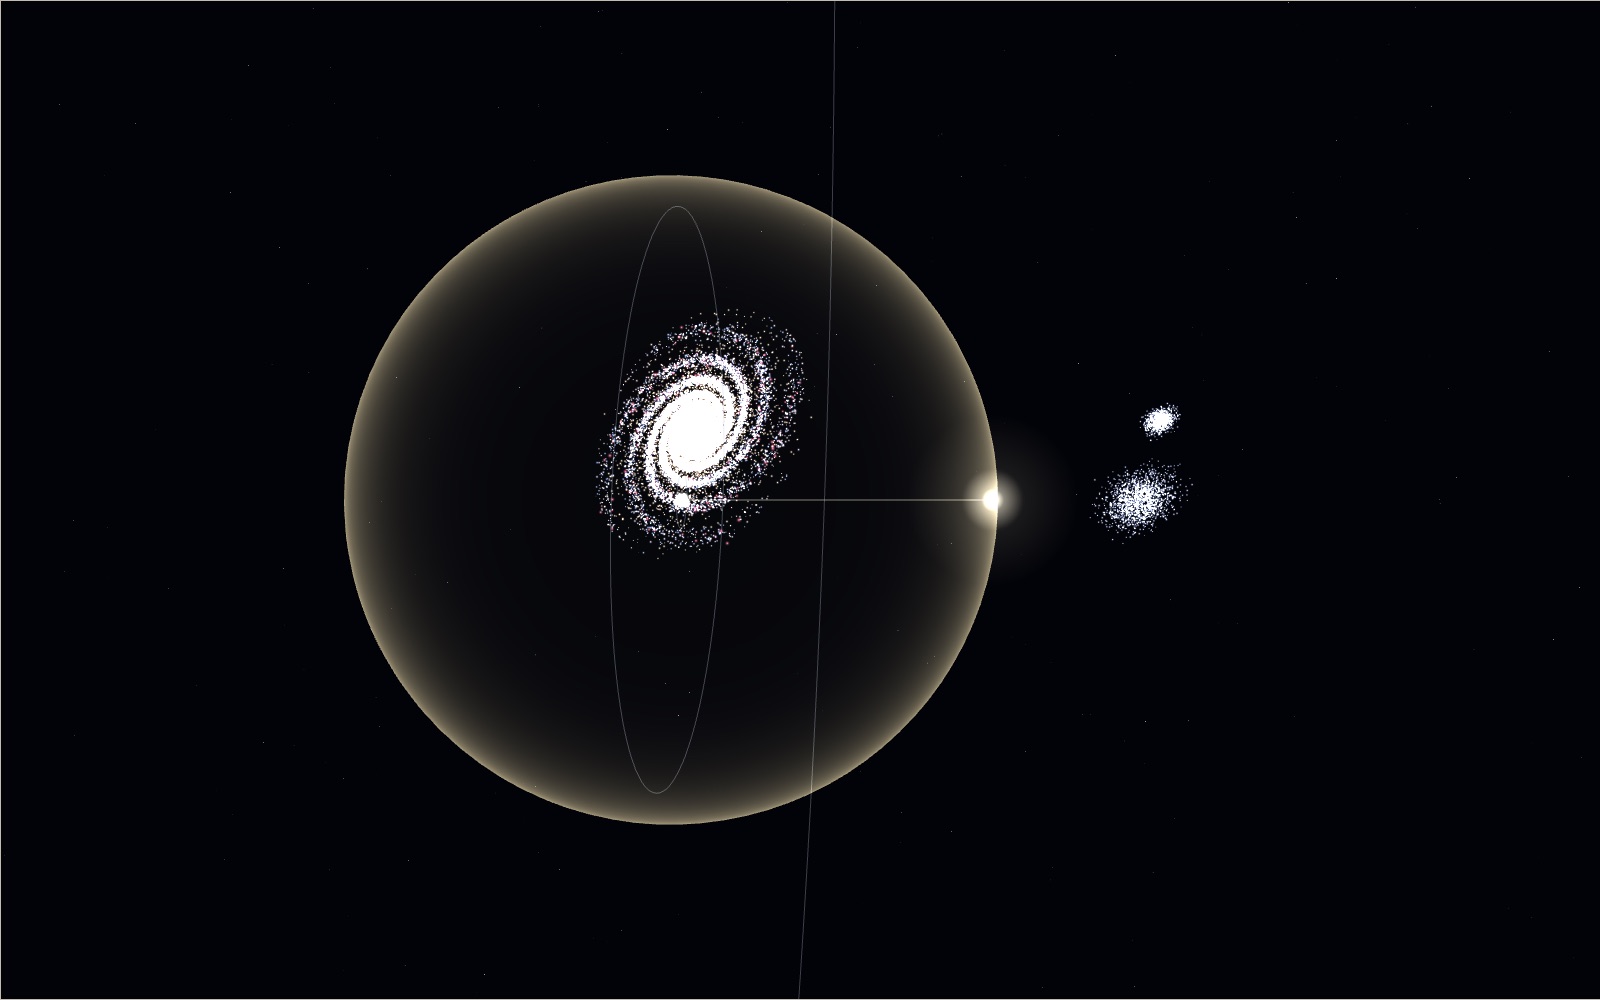
Travelling at the speed of light
Light goes round the equator 7.5 times in a second, yet the same light needs 2.5 million years to reach the Andromeda galaxy.
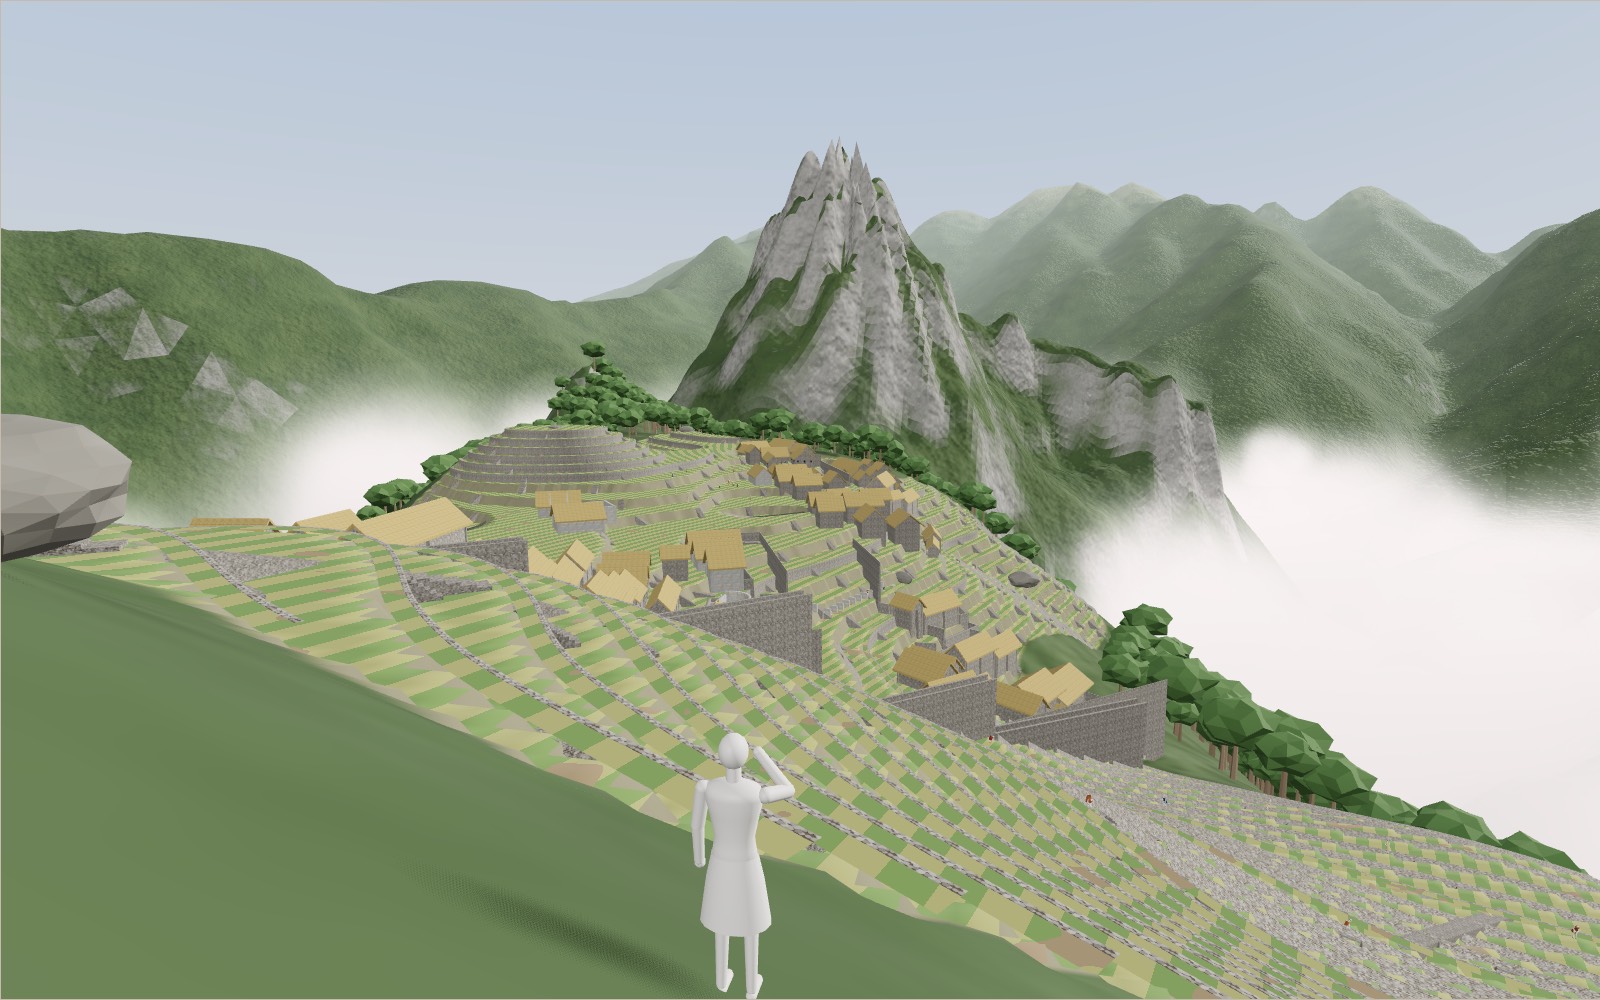
Walk through Machu Picchu
Most of the work that holds Machu Picchu on its ridge, 60 per cent by one estimate, lies under the ground in foundations and drains nobody sees.
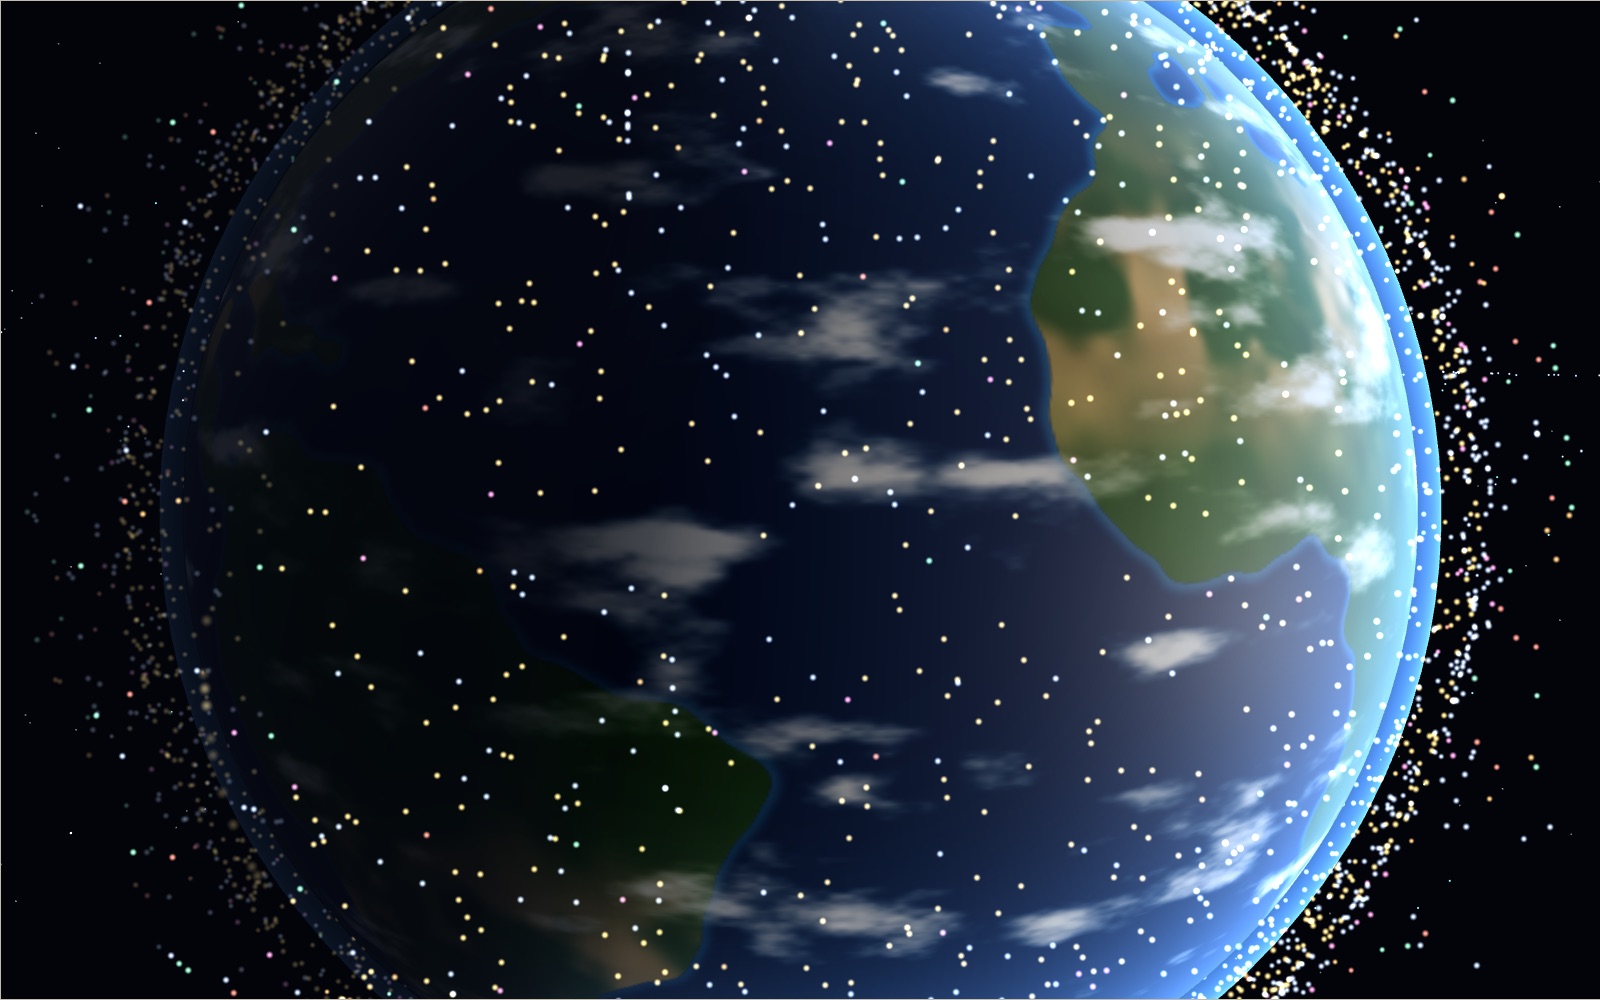
Satellites orbiting Earth right now
On 20 October 2026 the public catalogue listed 16,768 working satellites, and two in every three belonged to one company's internet network.
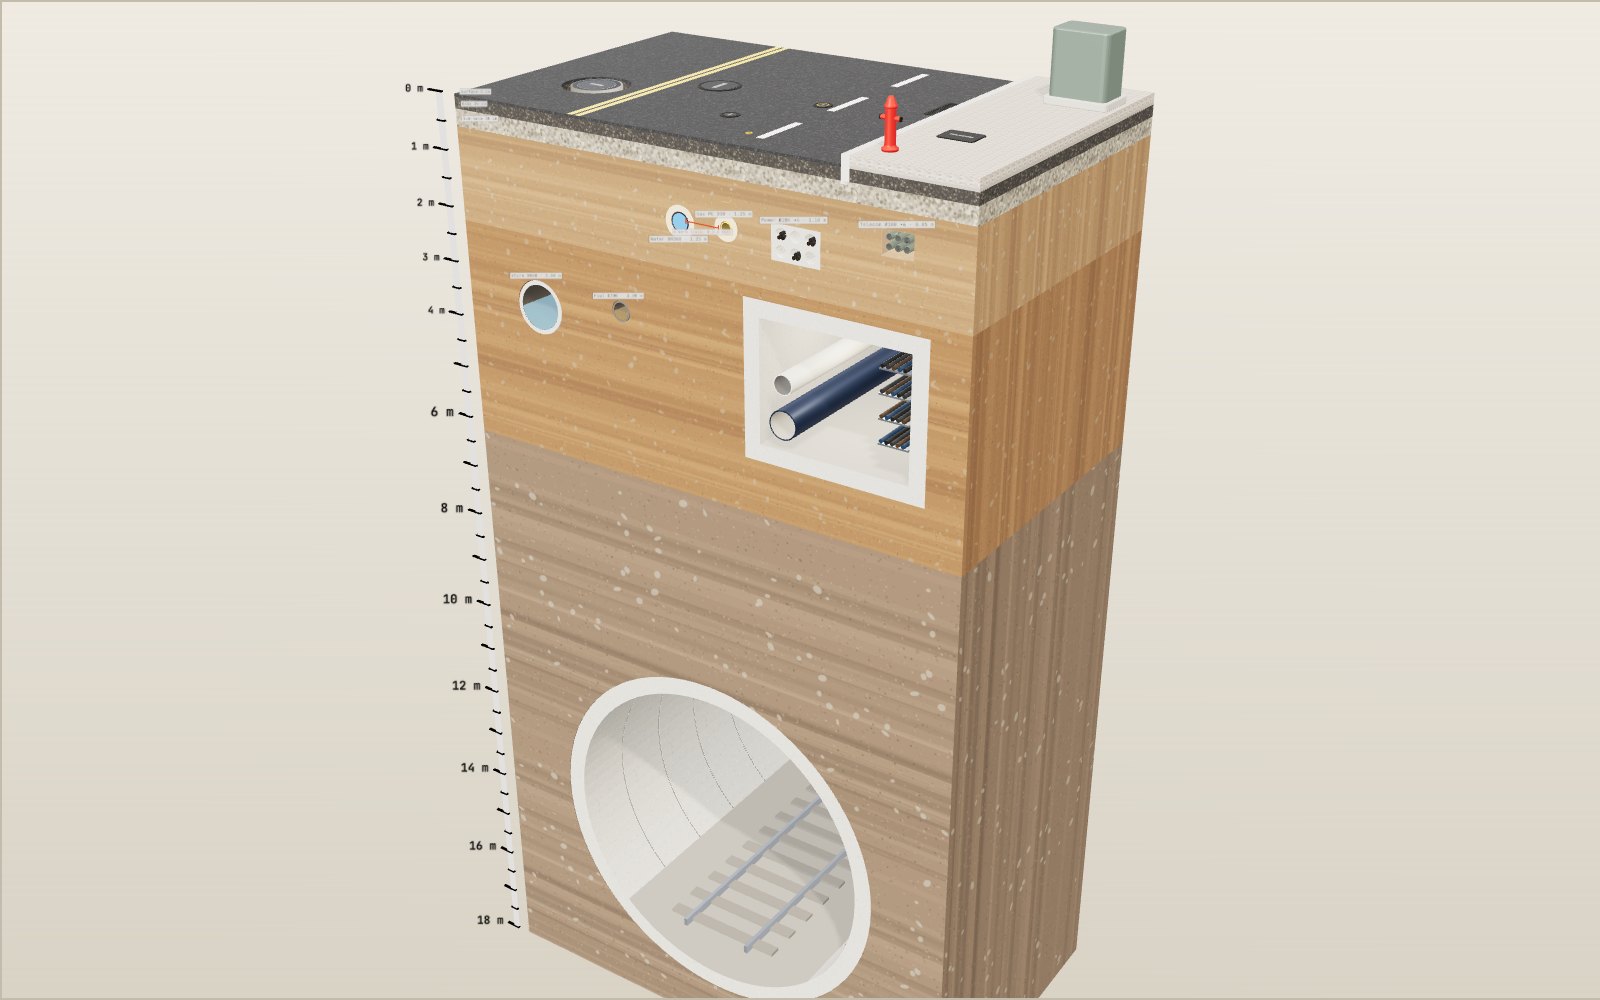
What is under the street
Korean road rules put a water main at least 1.2 metres under the road and a main sewer at least 3 metres down, so four kinds of pipe and cable all lie within the top 2 metres.