FIG. 94Walk-throughs
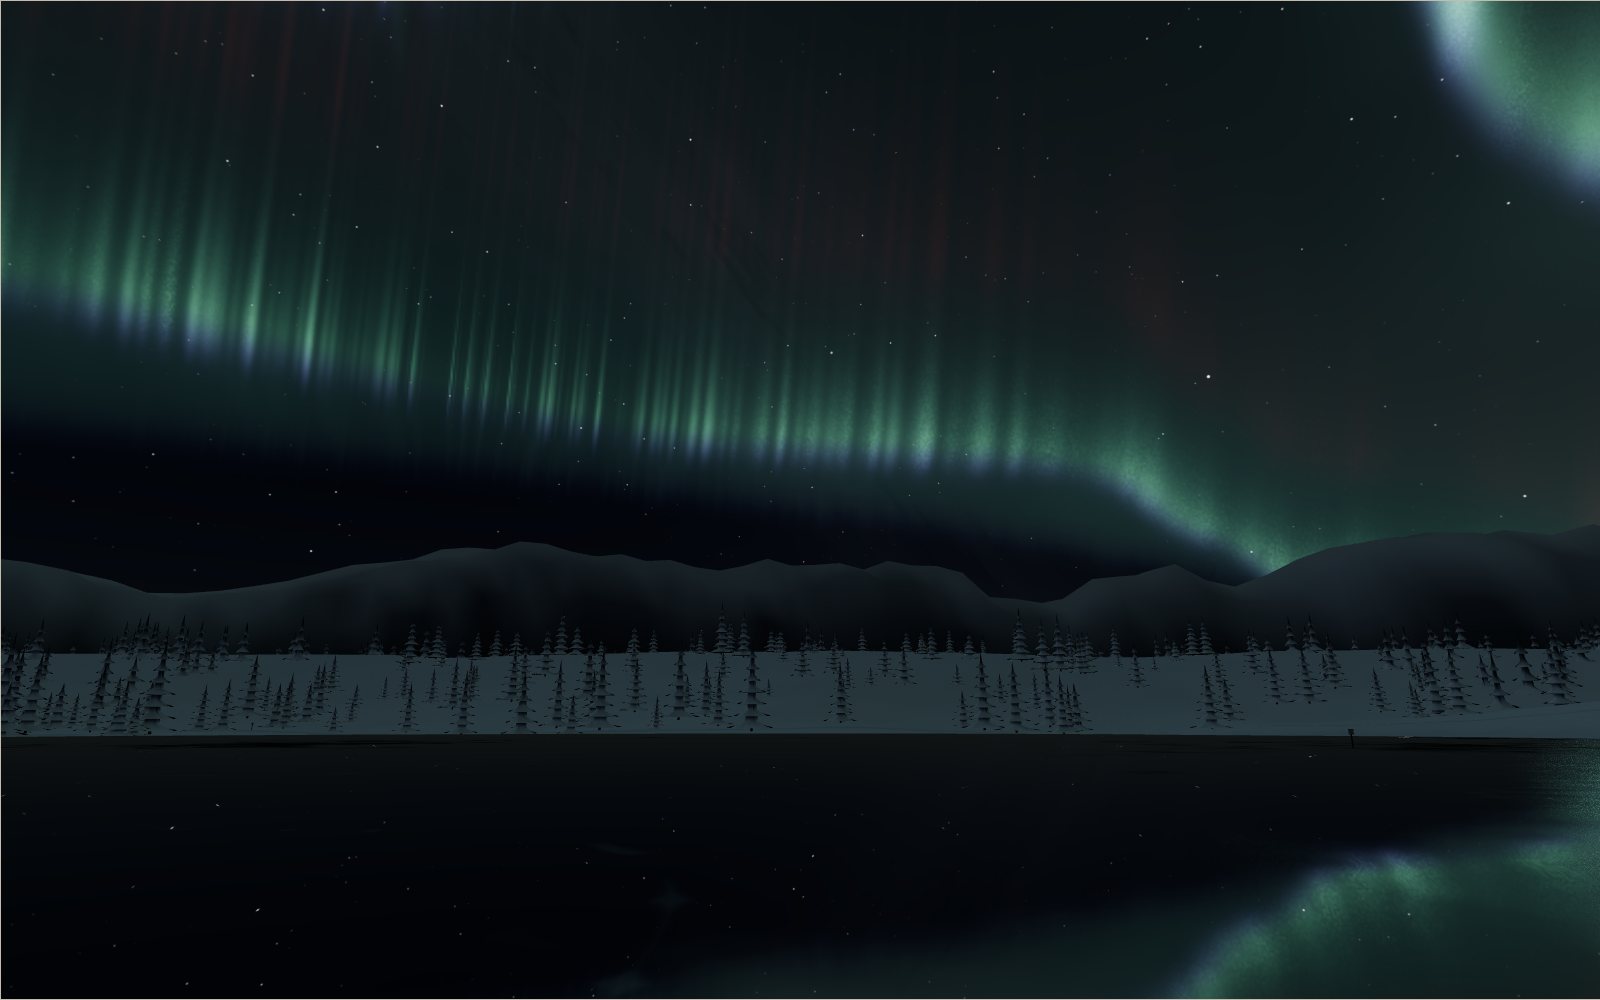
Northern lights over an Arctic village
The green of the northern lights comes from oxygen about 100 km up, and in the biggest storms the red glow above it can be seen as far south as Korea.
This device cannot show the 3D model. You can read the guide steps below as text.
1 / 14 Curtains over the lakeAn Arctic village at Tromsø's latitude, late on a February evening. A substorm is breaking up overhead and the black ice of the lake shows it again upside down. Drag to look up.
Drag to turn. Scroll or pinch to zoom.
What you are standing in
Photos of the northern lights usually show a bright green curtain over a dark landscape, often with a lake or a fjord that repeats it upside down. This exhibit puts you inside that photo. You stand on the shore of a frozen lake in a small Arctic village at night, with log cabins behind you, spruce forest to the west, a hill with a lookout tower to the east and a small observatory beyond the lake. Above all of it is a sky that works out the aurora from the same numbers scientists use to describe it.
The valley is about 700 m across. The village sits on a flat terrace in the middle: twelve cabins with lit windows, a wooden chapel with a clock, a sauna and a jetty that runs out onto the ice. The lake to the north is black ice with drifts of snow. A packed sled trail loops round the lake and through the forest. The hill is 34 m high, and a 9 m tower on top lets you see the whole sky at once. At the observatory stand a magnetometer hut, an all-sky camera under a glass dome and a board with two screens that show what they measure.
You can change what the sky does. Storm strength (the Kp index), the electron energy, the hour, the date, the place, the cloud, the Moon and the camera shutter are all in the controls. Each one changes the aurora the way the real thing changes, and a readout on the left of the stage says why: your geomagnetic latitude, where the edge of the aurora oval is, how high the green and red light reach and where the Sun is. A small map above the readout shows the oval from above the pole, with your place marked.
The first ten seconds
The exhibit opens late on a February evening at the latitude of Tromsø in northern Norway, at Kp 3+, just before magnetic midnight. A substorm is breaking up: the curtains brighten, fold and send rays up into the sky, and the bare ice of the lake shows them again. Drag to look up. The green light starts about 100 km above you, and on a clear night like this it is bright enough to cast a faint green tint on the snow.
Where the light comes from
An aurora is light given off by the air when fast electrons hit it. NOAA's Space Weather Prediction Center puts it plainly: electrons are accelerated in the night-side tail of Earth's magnetic field and closer to Earth along auroral field lines, they follow the field down into the upper atmosphere near the poles, and there they collide with oxygen and nitrogen. The atoms and molecules take up energy in the collisions and give it back as light, much as the gas in a neon sign does. Protons make an aurora too, but it is faint and diffuse and usually hard to see.
The field lines decide where this can happen. Near the equator they run high above the ground and close far out in space; near the poles they dip steeply into the atmosphere. The electrons that light the aurora come down along field lines that reach out into the night-side tail, and those field lines meet the ground in a band round each magnetic pole. NOAA gives the range: the aurora typically forms 80 to 500 km above Earth's surface, and the best place to see it is under a band between about 60° and 75° latitude, where it can be seen on more than half of the nights in a year.
The Sun supplies the energy, but not directly. The solar wind, a thin stream of charged particles from the Sun, presses on the magnetic field and stretches it into a long tail on the night side. Energy builds up there and is let go in bursts. When a coronal mass ejection, a large cloud of plasma thrown out by the Sun, hits Earth, the field is disturbed far more and the aurora grows brighter and moves toward the equator.
Why green, and why red
Most of the colour comes from atomic oxygen. NOAA's Science On a Sphere notes describe the most common colour as a pale yellowish green at one precise wavelength, 557.7 nm, and another common colour as a red glow at 630.0 nm, also from oxygen. The lower edges of rays can be a bluish purple at 427.8 nm from nitrogen ions. NASA's aurora page gives the heights: green roughly between 100 and 200 km, red above 200 km, blue from nitrogen between 100 and 200 km, and a pink or reddish purple glow from nitrogen below about 100 km.
Why should the same atom give green low down and red high up? An oxygen atom that has been knocked into the state that gives the green line usually gives its photon within about a second. The state that gives the red line lasts much longer, about 110 seconds on average. In the thin air above 200 km an excited atom can wait that long without hitting anything, so the red light gets out. Lower down, collisions are so frequent that the atom loses its energy to a neighbour first, and the red light never appears. Modellers of the 630.0 nm emission call this quenching. The result is that height sorts the colours: red on top, green in the middle, and the faster nitrogen emissions at the bottom edge.
The exhibit builds each curtain from four layers that follow these rules. In the shader every view ray is followed up through the atmosphere on a curved Earth, from 85 km to the top of the red layer. At each height the ray meets the curtain pattern and adds the light of whichever layers are bright there. That is why the bottom of a curtain is sharp and green and its top fades into red.
A colour for every height
Turn on the height ruler and the exhibit sets the aurora against things you know. A person is 1.7 m tall. An airliner cruises at about 11 km. The summit of Everest is a little under 9 km. The green light starts near 100 km, about nine airliner heights and about 59,000 times the height of the mannequin on the shore. The International Space Station orbits at about 410 km, inside the height range of the red layer, so astronauts often look down on the green and across at the red.
The ruler stands at least 450 km away from you, along the direction of the aurora, so that 100 km and 400 km fit into one view. Because the Earth curves away, the labels do not stack evenly: from far away, a height of 400 km appears only a few times higher above the horizon than 100 km does.
Electron energy decides the height
How deep an electron gets depends on its energy. A fast electron travels further through the thickening air before it has given all its energy away. Studies of electron precipitation put the peak of ionisation near 110 km for electrons of 10 keV and near 250 km for electrons below 0.1 keV. Electrons of around 100 keV reach down to about 80 km. The exhibit uses a smooth curve through values like these: 0.1 keV stops near 235 km, 1 keV near 145 km, 3 keV near 125 km, 10 keV near 110 km, 30 keV near 96 km and 100 keV near 80 km.
The electron energy slider shows what follows from that. With soft electrons, below about 1 keV, the light comes from high up, where the red line survives, and the aurora turns red. With hard electrons, 20 keV and more, the curtains reach below 100 km and grow a pink lower edge from nitrogen. Most bright curtains come from electrons of a few keV, and that is where the slider starts.
The oval: a ring, not a cap
People often picture the aurora as a glow over the North Pole. Seen from space it is a ring. NOAA describes two ovals, one round each magnetic pole, and in quiet times the ring is a few hundred kilometres wide and lies far from the geographic pole. The North Pole itself is usually inside the ring, under a polar cap with little aurora. That is why the best places to watch are towns like Tromsø, Kiruna, Fairbanks and Yellowknife, not the pole.
The ring is not centred on the geographic pole but on the geomagnetic pole, which the IGRF model of Earth's field placed at about 80.8° N, 72.6° W in 2025, over the Canadian Arctic toward Greenland. That is about 1,000 km from the North Pole. The ring is also lopsided: it reaches further toward the equator on the night side than on the day side. Early satellites photographed it as a near circle offset from the pole, and Holzworth and Meng showed in 1975 that an offset circle with small corrections describes it well.
The small map on the stage draws the oval the exhibit is using, seen from above the pole, with magnetic midnight at the bottom. Move the hour and the Earth turns under the oval, which stays fixed with respect to the Sun. Move Kp and the ring grows.
Why a storm pushes the oval toward the equator
The oval is where field lines from the night-side tail reach the ground. When the solar wind presses harder, and especially when the magnetic field it carries points southward, more of Earth's field is opened up and dragged into the tail. The region of open field lines over each pole, the polar cap, grows, and the oval round it grows with it. Holzworth and Meng found in satellite photographs that the oval's size tracks the southward part of the solar wind's field. Carbary, using ultraviolet images from NASA's Polar satellite, found a rule of thumb for the brightest part of the oval: it moves about 1° of magnetic latitude toward the equator for each step up in Kp.
That is why a strong storm is not always good news for Arctic towns. At Kp 7 the oval's edge in this model comes down to about 53° at midnight. Tromsø, at 67.5°, then sits poleward of the brightest aurora, and the curtains appear in the southern sky. The tour shows this: look south over the village.
Kp, the storm number
The Kp index measures how disturbed Earth's magnetic field is. It is worked out every three hours from magnetometer records at 13 observatories at subauroral latitudes, and it runs from 0 to 9 in thirds: 0, 0+, 1-, 1, 1+ and so on up to 9, 28 steps in all. NOAA uses it for the geomagnetic storm scale. Kp 5 is a minor storm (G1), Kp 6 moderate (G2), Kp 7 strong (G3), Kp 8 severe (G4) and Kp 9 extreme (G5). NOAA expects a G5 storm about four times in an 11-year cycle.
The same table gives the aurora a rough reach. At Kp 5 the aurora is commonly visible at high latitudes, such as northern Michigan and Maine. At Kp 6 it has been seen as low as New York and Idaho, typically 55° geomagnetic latitude; at Kp 7 as low as Illinois and Oregon, typically 50°; at Kp 8 as low as Alabama and northern California, typically 45°; and at Kp 9 as low as Florida and southern Texas, typically 40°.
The exhibit's Kp slider moves in the same thirds. Its label shows the published form, so 3+ means three and a third.
How the model places the oval
The edge of the oval in this exhibit comes from one study. Gussenhoven, Hardy and Heinemann used the electron detectors on the DMSP F2 and F4 weather satellites, which cross the auroral zone many times a day, and found where the diffuse aurora ends on its equator side. For every hour of magnetic local time they fitted a straight line, Λ = Λ0 + α·Kp, where Λ is the corrected geomagnetic latitude of the edge. Near magnetic midnight (00 to 01 MLT) the fit is 66.1° − 1.99° × Kp; at 11 to 12 MLT, near noon, it is 70.1° − 1.25° × Kp. The edge moves about 2° toward the equator for each step in Kp at night, and less on the day side.
| Kp | Edge at magnetic midnight | Red top can just clear the horizon down to | NOAA scale, typically seen as low as |
|---|---|---|---|
| 0 | 66.9° | 51.2° | |
| 3 | 60.9° | 42.9° | |
| 5 | 56.8° | 37.6° | 60° |
| 6 | 54.8° | 35.0° | 55° |
| 7 | 52.7° | 32.4° | 50° |
| 8 | 50.7° | 29.8° | 45° |
| 9 | 48.7° | 27.2° | 40° |
The exhibit blends the hourly lines smoothly and fills two gaps in the table (02 to 04 MLT and 13 to 15 MLT) by drawing a straight line between the neighbouring hours. Their sample reaches about Kp 6, so the lines for Kp 7, 8 and 9 are an extrapolation. The table above puts the model next to NOAA's descriptions: NOAA's "typically seen as low as" latitudes fall between the edge being overhead and the farthest point from which the red top could just show above the horizon.
The width of the bright band is a rule of thumb of our own, not a fit: about 8° at midnight in quiet times, widening by 0.4° for each step in Kp, and about 7° near noon. The brightness of the band is largest before midnight and smallest around noon. NOAA's own 30-minute aurora forecast uses a different model, OVATION Prime, driven by solar wind measurements rather than by Kp.
Your geomagnetic latitude
Because the oval is centred on the geomagnetic pole, geographic latitude is a poor guide. Tromsø, at 69.7° N, lies at about 67.5° geomagnetic latitude. Fairbanks, at 64.8° N, is at about 65.6°, because Alaska is on the side of the pole toward which the geomagnetic pole leans. Seoul, at 37.6° N, is at only about 28.9°, because East Asia is on the far side. A city in Europe or North America at the same geographic latitude as Seoul would have a better chance.
Open Me and pick a city, use your location or type a latitude and longitude. The exhibit works out your geomagnetic latitude from the IGRF dipole and tells you two Kp values: the Kp at which the oval's edge comes overhead at magnetic midnight, and the Kp at which some red light from the top of the aurora could clear your horizon. The Cities list in the aurora book does the same for 40 places, from Tromsø and Longyearbyen to Singapore. Nothing you type leaves your device.
Seeing an aurora from far away
You do not have to be under the oval to see it. Light from a curtain 100 km up can be seen from a long way off, low on the horizon, the way a mountain range is seen from far away. The Earth curves away, so there is a limit. For a glow at height h, the farthest point on the ground from which it can just touch the horizon is an angle θ along the Earth's surface with cos θ = R / (R + h), where R is Earth's radius, 6,371 km. For 110 km that gives about 10.6° of latitude, roughly 1,200 km. For 400 km it gives about 19.8°.
This is why the red top matters to people far from the oval. In a big storm the oval comes toward the equator and the red layer reaches higher, up to 475 km in this model at Kp 9. From a city 20° away the green curtains are below the horizon, but the red top is just above it.
In practice you need more than the geometry: hills, haze, city lights and the faintness of the light near the horizon all stand in the way. That is why NOAA's typical lines sit well poleward of the geometric limit in the table above.
Korea and the storm of May 2024
On 10 May 2024 a series of coronal mass ejections reached Earth and set off a G5 storm, the first since 2003. NASA called it the strongest solar storm to reach Earth in 20 years and noted reports of aurora as low as 26° magnetic latitude. In this model, at Kp 9 the red top could just clear the horizon down to 27.2°, close to that report.
The Korea Astronomy and Space Science Institute (KASI) reported what was seen from Korea. The all-sky camera of its upper-atmosphere observing system (TIMOS) at Bohyunsan Observatory, which watches through a red 630.0 nm filter, recorded red light to the north during the storm. KASI's wide-field telescopes in Mongolia and in the United States photographed red aurora too. On the early morning of 12 May, amateur astronomers from the Yongin Children's Observatory photographed red aurora from Hwacheon in Gangwon province. KASI noted that the Bohyunsan all-sky camera had also caught red aurora on 30 October 2003, during the Halloween storms. Researchers at KASI later described large changes in the ionosphere over Korea during the same storm: at night the total electron content rose and strong scintillation occurred, and on the following day it fell more than 70% below normal.
The exhibit's tour puts you in Seoul at Kp 9 near magnetic midnight. Only a thin red glow shows over the northern ridges, and the lake reflects it. That is about all that can be expected from Korea, and it needs one of the largest storms of a solar cycle.
One night: arcs, breakup, patches
NOAA describes a typical night. In the evening the aurora forms arcs that stretch from horizon to horizon. Late in the evening, near midnight, the arcs begin to twist and sway, as if a wind were blowing the curtains. At some point they may expand to fill the whole sky, moving fast and growing very bright: the peak of an auroral substorm. In the early morning the forms turn cloud-like, and these diffuse patches often blink on and off for hours.
Syun-Ichi Akasofu described this sequence in 1964 from all-sky camera films, and called it the auroral substorm. Energy stored in the magnetic tail is released, and the breakup usually starts near magnetic midnight. The pulsating patches toward morning come from electrons scattered out of the magnetosphere by waves called chorus; Nishimura and colleagues showed in 2010 that the patches and the waves turn on and off together.
The exhibit runs a cycle like this whenever you are on the night side at Kp 3 or more: a slow brightening for about 40 seconds, a breakup of about 20 seconds in which the rays move faster and the band spreads poleward, then a recovery. Between 03 and 09 magnetic local time the curtains give way to blinking patches.
The magnetometer and the all-sky camera
During a breakup a strong electric current, the westward electrojet, flows about 100 km overhead along the aurora. A magnetometer on the ground feels it as a drop in the northward component of the field. The board at the observatory draws the last 60 seconds of such a trace. In a breakup at Kp 4 or 5 it falls by several hundred nanotesla, compared with Earth's total field of about 50,000 nT. The Kp index itself is built from traces like these at observatories further from the poles.
Beside it stands an all-sky camera: a fisheye lens under a glass dome that photographs the whole sky from horizon to horizon in one frame, with north up and east on the left, because you look up at it. The screen shows the same sky shader you see around you, drawn as a fisheye.
Polar night and the midnight sun
North of the Arctic Circle the Sun stays below the horizon all day for part of the winter. The exhibit works out the Sun's position from NOAA's solar equations, and counts a day as polar night when the Sun's centre stays more than 0.833° below the horizon at noon. That angle allows for the bending of light in the air and for the Sun's radius. In Tromsø this gives 48 days, from 29 November to 15 January. In Longyearbyen on Svalbard it gives 111 days.
On the Arctic Circle itself there is no polar night. At Rovaniemi, right by the line, the top of the Sun still shows on the shortest day, because the air lifts its image by about half a degree. Polar night needs a latitude a little further north.
Darkness is what makes the aurora visible. In summer at auroral latitudes the midnight sun prevents viewing. The exhibit fades the aurora as the Sun rises toward the horizon, and at twilight it lights the tops of tall rays in sunlight: nitrogen ions that are lit by the Sun glow violet, which is why some photographs show purple tops on green curtains.
Eye and camera
A photo of an aurora often looks brighter and more colourful than the sky did. NASA's aurora infographic says it directly: auroras do not often appear this bright to the naked eye, but cameras capture even dim auroras in detail. A camera adds up light for as long as the shutter is open, two seconds, ten seconds, thirty seconds. The eye cannot. In very dim light the eye relies on rod cells, which do not tell colours apart, so a faint aurora can look like a grey cloud until it brightens.
The shutter control works in two ways. In live view it sets how bright the scene appears, as a camera's screen would show it. When you press Take photo in photo mode, the exhibit renders the frames that would fall inside the exposure, with the aurora moving between them, and adds them up. At 1/30 s the photo is dark. At 10 s the curtains are bright and smooth. At 30 s the fast parts smear into a soft glow and the snow is overexposed. Set the shutter to Eye to see roughly what the eye sees: faint parts lose their colour.
The southern lights
The southern oval lies round the south geomagnetic pole, over the Southern Ocean and Antarctica. Most of the field lines that end in the northern oval end in the southern one, so a storm lights both. They are not exact mirror images. Laundal and Østgaard used two satellites to photograph both ovals at once and found that one can be brighter than the other, depending on the season and on the direction of the field carried by the solar wind.
Korea runs two research stations in Antarctica. King Sejong Station, at 62.2° S on King George Island, lies at about 53° geomagnetic latitude and sees the aurora to the south in storms. Jang Bogo Station, at 74.6° S on the Ross Sea side, lies at about 77° geomagnetic, close to the poleward side of the oval. In the exhibit, choose them in Place and look south.
STEVE, dunes and other new shapes
In 2016 aurora watchers in Canada photographed a narrow mauve ribbon running east to west, south of the normal aurora, and called it Steve. Satellites passed over it and found a very fast flow of hot plasma underneath, with none of the electron precipitation that makes an ordinary aurora. Scientists gave it the backronym Strong Thermal Emission Velocity Enhancement. Gallardo-Lacourt and colleagues argued that its light is a glow from the heated upper atmosphere rather than an aurora at all. NASA's tips for finding it: STEVE appears about 5 to 10 degrees closer to the equator than the normal aurora, it is a very narrow arc aligned east to west, it can last 20 minutes to an hour, and it is sometimes accompanied by short green stripes called the picket fence.
In 2020 Finnish citizen scientists and researchers described another new form, the dunes: parallel green stripes about 100 km up, like ripples in sand, shaped by waves in the atmosphere at that height.
The exhibit makes STEVE after a substorm on the night side when Kp is 5 or more, about 2.3° on the equator side of the oval's edge, with the picket fence underneath it in the biggest storms.
Can you hear the aurora?
For a long time people in the north have reported hearing the aurora: crackles, hisses or claps during strong displays. Silverman and Tuan reviewed the reports in 1973. The question is still argued. Sound from 100 km up would be far too faint and would arrive minutes late, so any real sound would have to be made near the ground. Some researchers link it to electrical effects in the lower atmosphere during geomagnetic disturbances. The hidden find in the forest plays a sound like the ones described. It is an illustration, not a recording.
The 11-year cycle
The Sun's activity rises and falls over about 11 years, and the number of sunspots counts it. On 15 October 2024 NASA, NOAA and the international Solar Cycle Prediction Panel announced that the Sun had reached the maximum period of solar cycle 25, which could continue for about a year. The largest flare of the cycle up to then, an X9.0, had erupted on 3 October 2024. Big storms are more likely in the years around a maximum, but they can also come in other years.
The yardstick for an extreme event is still the storm of September 1859, called the Carrington event after the astronomer who saw the flare. Aurora was reported at low latitudes around the world, and Cliver and Dietrich used it to discuss the limits of extreme space weather.
Aurora on other planets
Any planet with an atmosphere and a magnetic field can have aurora. Hubble photographs Jupiter's in ultraviolet. ESA describes them as covering areas bigger than the whole Earth, hundreds of times more energetic than Earth's, and never ceasing. Jupiter has a source that Earth lacks: its volcanic moon Io throws charged particles into space, and where field lines from Io reach Jupiter they leave a bright footprint near the main oval. The Juno spacecraft has photographed these footprints closely.
Saturn's aurora is also mostly ultraviolet, because the atmospheres of the giant planets are mostly hydrogen. Hubble watched its northern aurora for seven months in 2017 and saw two peaks in brightness, at dawn and just before midnight. Mars has no global magnetic field, so it has no oval. NASA's MAVEN spacecraft found diffuse aurora over much of the planet after a solar storm.
In the exhibit, the Planet slider in space shows Jupiter, Saturn and Mars with their aurora in false colour, and Earth beside each at the same scale.
How the sky is drawn
The sky is one shader, run for every pixel at half resolution and then spread over the screen, with the stars and the Moon added at full resolution. For each pixel the shader follows the view ray up through the atmosphere on a curved Earth. It takes up to 64 heights between 82 km and the top of the red layer, closer together near the bottom where the curtains are sharpest. At each height it finds where the ray is, measured along the arc and toward the magnetic pole, and looks up the curtain pattern there.
Curtains follow the magnetic field, and the field is not vertical. For a dipole the inclination I of the field at geomagnetic latitude λ obeys tan I = 2 tan λ. At Tromsø's 67.5° that gives an inclination of about 78°, so a field line climbing from 100 km to 300 km moves about 40 km toward the equator. The shader shifts the pattern by that amount at each height, and the rays lean together. Seen from directly below, parallel rays seem to meet at one point, the magnetic zenith, about 12° from the true zenith toward the equator at Tromsø: that is the corona.
Thin curtains seen from the side are thinner than the gap between two sampled heights. Each sheet is therefore widened to the gap and dimmed by the same factor, so it keeps its total light without sparkling. The lake ice reads the same picture back for its reflection where that direction is on the screen, and works it out again with fewer steps where it is not.
Clouds, the Moon and village lights
Clouds sit about 2.5 km up, far below the aurora, so they hide it completely where they are thick. From below they often glow faintly green, lit by the aurora above. The Cloud control adds a layer of drifting cloud, and light snow begins to fall when cloud covers more than half the sky.
The Moon's phase is a control, and its position follows from the Sun's for that phase, so a full Moon stands high in the winter night and a crescent stays near the Sun. A bright Moon lights the snow and the sky and hides the faintest aurora. The village adds a little warm light near the horizon.
How the model differs from reality
- The oval's edge follows the DMSP fit for the diffuse aurora edge. Bright discrete arcs can sit anywhere inside the band; the exhibit places one just poleward of you when you are under the oval, and near the side facing you otherwise.
- The band's width is a rule of thumb, and the fit beyond about Kp 6 is an extrapolation. In real great storms the oval can come further toward the equator than the straight lines suggest.
- Kp sets everything here. Real auroras respond to the solar wind's speed, density and magnetic field directly, minute by minute, and two storms with the same Kp can look different.
- The geomagnetic latitude comes from a tilted dipole. Real geomagnetic coordinates (corrected geomagnetic latitude) differ from it by a degree or more in some places, most in the South Atlantic.
- The emission layers are smooth curves fitted to the published heights, not a full calculation of energy deposition and chemistry. Brightness is relative: the exhibit does not try to give kilorayleighs.
- The curtains are a pattern of folded sheets and rays that drift. Their shapes are invented to look like photographs; their heights, colours, tilt along the field lines and position follow the model.
- The scenery stays the same wherever you go. Only the sky, the Sun, the Moon and the stars change with the place.
- The Moon's position follows the Sun along the ecliptic for the phase you choose; it is not a full lunar ephemeris.
Moving around the valley
Walk with WASD or the arrow keys, or click the ground. On a phone, use the circle at the bottom left or tap the ground. Drag to look around; looking straight up is allowed. The buttons at the bottom right switch between walking, running, a sled, a drone at 45 m and the view from space. Keys 1 to 5 do the same. M opens the map of the valley, T the challenges, B the aurora book, F the hidden finds and P the photo mode.
The tower on the hill is reached by its stairs on the south side. The sled is fastest on the dashed trail round the lake. In space, drag to turn the planet and scroll to zoom.
The guided tour
The tour has 14 steps. It starts with the breakup over the lake, then shows the colours by height, makes a red aurora, pushes the oval south past Tromsø, stands you under a corona, reflects the sky in the ice, visits the observatory, compares eye and camera, finds a polar night, looks from Seoul at Kp 9, goes to King Sejong Station and to Svalbard at noon, and ends in space with Earth and Jupiter.
Challenges and hidden finds
There are 11 challenges. Some are questions whose answers come from the model, such as the Kp Seoul needs. Others you solve by making it happen: a red aurora, a polar night, a 10 second photo, standing under a corona, a substorm on the magnetometer, an aurora at noon. The Set up button takes you to a good starting point without solving anything.
The aurora book has 44 entries: colours, shapes and events, sky and camera, views from space and places where you have seen the aurora. There are 18 hidden finds round the valley, and seven of them are reversal cards that begin "In fact". Progress is kept on this device.
Questions
Why is the aurora green?
Most aurora is green because of atomic oxygen 100 to 200 km up. Electrons knock oxygen atoms into a state that gives light at 557.7 nm within about a second, and at those heights there is plenty of oxygen to hit.
Why are some auroras red?
Oxygen also gives a red line at 630.0 nm, but only high up, above about 200 km. The state that gives it lasts about 110 seconds, and lower down a collision takes the energy away before the light comes out. Soft electrons, which stop high, and big storms, which push the light higher, both make red aurora.
How high is the aurora?
NOAA gives 80 to 500 km. The lower edge of most curtains is near 100 km. The green part reaches up to about 200 km and the red above that. The space station, at about 410 km, flies at the height of the red tops.
What does Kp mean?
Kp is a three-hourly index of how disturbed Earth's magnetic field is, worked out from 13 observatories. It runs from 0 to 9 in thirds. Kp 5 and above count as a geomagnetic storm on NOAA's scale.
Can I see the aurora from Korea?
Only in the largest storms, and usually only as a red glow low in the north that cameras catch better than eyes. Seoul lies near 28.9° geomagnetic latitude. In May 2024, during a G5 storm, red aurora was photographed from Hwacheon, and the Bohyunsan Observatory all-sky camera recorded red light. The same camera caught red aurora in October 2003.
What Kp does Seoul need?
In this model the red top first clears Seoul's horizon at about Kp 9-, and only low in the north. The oval itself never comes overhead.
Is the North Pole the best place to see it?
No. The aurora forms a ring round the geomagnetic pole, and the North Pole is usually inside the ring. Places between about 60° and 75° latitude, under the ring, see it most often.
Do the northern and southern lights happen at the same time?
Often. The two ovals are joined by the same field lines, so a storm lights both. They are not exact mirror images, and one can be brighter than the other.
When is the best time of night?
Near magnetic midnight, when substorm breakups usually start. In Tromsø that is a little before local midnight. Toward morning the aurora often turns into blinking patches.
Why do photos look different from what I see?
A camera adds up light over seconds; the eye cannot. In dim light the eye uses rod cells, which see no colour, so a faint aurora may look grey while a photo of it is green.
Can you see the aurora in summer?
At auroral latitudes in summer the sky does not get dark enough. The aurora is there, but the midnight sun hides it.
What is polar night?
A time in winter when the Sun stays below the horizon all day. In Tromsø it lasts about 48 days. On the Arctic Circle itself there is none, because the air bends sunlight over the horizon.
Is STEVE an aurora?
Probably not. STEVE is a narrow mauve ribbon on the equator side of the aurora. Satellites found a fast flow of hot plasma under it and no electron precipitation of the kind that makes aurora.
Can you hear the aurora?
People have reported crackles and claps for centuries. Whether any of them come from the aurora is still argued; if they do, they must be made near the ground.
Do other planets have aurora?
Yes. Jupiter and Saturn have bright ultraviolet ovals, Jupiter's covering areas bigger than the whole Earth. Mars has patchy aurora with no oval because it has no global magnetic field.
Why does the aurora move?
The field lines it follows shift as currents in near-Earth space change, and the electrons arrive in sheets that fold and drift. In a substorm breakup the changes take seconds.
Terms
- Aurora oval: the ring round each geomagnetic pole where the aurora usually forms.
- Geomagnetic latitude: latitude measured from the geomagnetic poles instead of the geographic ones.
- Kp index: a three-hourly measure of geomagnetic disturbance from 0 to 9, in thirds.
- Magnetic local time (MLT): time of day measured from the geomagnetic meridian facing the Sun; magnetic midnight is opposite.
- Substorm: a release of energy stored in the magnetic tail, seen as a brightening and breakup of the aurora.
- Quenching: loss of an excited atom's energy in a collision before it can give off light.
- Magnetometer: an instrument that records changes in the magnetic field.
- All-sky camera: a camera with a fisheye lens that photographs the whole sky.
Sources
- NOAA Space Weather Prediction Center, Aurora: https://www.swpc.noaa.gov/phenomena/aurora
- NOAA Space Weather Prediction Center, NOAA Space Weather Scales: https://www.swpc.noaa.gov/noaa-scales-explanation
- NOAA Space Weather Prediction Center, Tips on Viewing the Aurora: https://www.swpc.noaa.gov/content/tips-viewing-aurora
- NOAA Space Weather Prediction Center, Planetary K-index: https://www.swpc.noaa.gov/products/planetary-k-index
- NOAA Space Weather Prediction Center, Aurora 30-Minute Forecast: https://www.swpc.noaa.gov/products/aurora-30-minute-forecast
- NOAA Space Weather Prediction Center, Solar Cycle Progression: https://www.swpc.noaa.gov/products/solar-cycle-progression
- NOAA Space Weather Prediction Center, Joint Solar Maximum Announcement from NASA and NOAA (2024): https://www.swpc.noaa.gov/news/joint-solar-maximum-announcement-nasa-and-noaa
- NASA, Auroras: https://science.nasa.gov/sun/auroras/
- NASA, NASA, NOAA: Sun Reaches Maximum Phase in 11-Year Solar Cycle (2024): https://science.nasa.gov/science-research/heliophysics/nasa-noaa-sun-reaches-maximum-phase-in-11-year-solar-cycle/
- NASA, How NASA Tracked the Most Intense Solar Storm in Decades (2024): https://science.nasa.gov/science-research/heliophysics/how-nasa-tracked-the-most-intense-solar-storm-in-decades/
- NASA, NASA Needs Your Help to Find Steve and Here's How (2018): https://www.nasa.gov/science-research/heliophysics/nasa-needs-your-help-to-find-steve-and-heres-how
- NASA Earth Observatory, Purple Haze Aurora (space station altitude): https://science.nasa.gov/earth/earth-observatory/purple-haze-aurora/
- NASA Scientific Visualization Studio, Aurora: Illuminating the Sun-Earth Connection (infographic): https://svs.gsfc.nasa.gov/vis/a000000/a004900/a004934/Aurora_Infographic.pdf
- NOAA Science On a Sphere, Aurora: https://sos.noaa.gov/catalog/datasets/aurora/
- NOAA National Centers for Environmental Information, Wandering of the Geomagnetic Poles: https://www.ngdc.noaa.gov/geomag/GeomagneticPoles.shtml
- NOAA Global Monitoring Laboratory, General Solar Position Calculations: https://gml.noaa.gov/grad/solcalc/solareqns.PDF
- Korea Astronomy and Space Science Institute, aurora photographed by KASI telescopes and in Korea (13 May 2024): https://www.kasi.re.kr/kor/publication/post/newsMaterial/30045
- Lee, W. K. et al., Ionospheric responses to the May 2024 G5 geomagnetic storm over Korea, Journal of Space Technology and Applications (2024): https://doi.org/10.52912/jsta.2024.4.3.210
- Gussenhoven, M. S., Hardy, D. A., Heinemann, N., Systematics of the equatorward diffuse auroral boundary, Journal of Geophysical Research (1983): https://doi.org/10.1029/JA088iA07p05692
- Holzworth, R. H., Meng, C.-I., Mathematical representation of the auroral oval, Geophysical Research Letters (1975): https://doi.org/10.1029/GL002i009p00377
- Carbary, J. F., A Kp-based model of auroral boundaries, Space Weather (2005): https://doi.org/10.1029/2005SW000162
- Alken, P. et al., International Geomagnetic Reference Field: the thirteenth generation, Earth, Planets and Space (2021): https://doi.org/10.1186/s40623-020-01288-x
- Matzka, J. et al., The geomagnetic Kp index and derived indices of geomagnetic activity, Space Weather (2021): https://doi.org/10.1029/2020SW002641
- Machol, J. L. et al., Evaluation of OVATION Prime as a forecast model for visible aurorae, Space Weather (2012): https://doi.org/10.1029/2011SW000746
- Fang, X. et al., Electron impact ionization: a new parameterization for 100 eV to 1 MeV electrons, Journal of Geophysical Research (2008): https://doi.org/10.1029/2008JA013384
- Fukizawa, M. et al., Statistical study of electron density enhancements in the ionospheric F region associated with pulsating auroras, Journal of Geophysical Research (2021): https://doi.org/10.1029/2021JA029601
- Solomon, S. C., Hays, P. B., Abreu, V. J., The auroral 6300 Å emission: observations and modeling, Journal of Geophysical Research (1988): https://doi.org/10.1029/JA093iA09p09867
- Akasofu, S.-I., The development of the auroral substorm, Planetary and Space Science (1964): https://doi.org/10.1016/0032-0633(64)90151-5
- Nishimura, Y. et al., Identifying the driver of pulsating aurora, Science (2010): https://doi.org/10.1126/science.1193186
- MacDonald, E. A. et al., New science in plain sight: citizen scientists lead to the discovery of optical structure in the upper atmosphere, Science Advances (2018): https://doi.org/10.1126/sciadv.aaq0030
- Gallardo-Lacourt, B. et al., On the origin of STEVE: particle precipitation or ionospheric skyglow?, Geophysical Research Letters (2018): https://doi.org/10.1029/2018GL078509
- Palmroth, M. et al., Citizen scientists discover a new auroral form: dunes provide insight into the upper atmosphere, AGU Advances (2020): https://doi.org/10.1029/2019AV000133
- Laundal, K. M., Østgaard, N., Asymmetric auroral intensities in the Earth's Northern and Southern hemispheres, Nature (2009): https://doi.org/10.1038/nature08154
- Silverman, S. M., Tuan, T. F., Auroral audibility, Advances in Geophysics (1973): https://doi.org/10.1016/S0065-2687(08)60352-0
- Cliver, E. W., Dietrich, W. F., The 1859 space weather event revisited: limits of extreme activity, Journal of Space Weather and Space Climate (2013): https://doi.org/10.1051/swsc/2013053
- ESA/Hubble, Hubble captures vivid auroras in Jupiter's atmosphere (heic1613, 2016): https://esahubble.org/news/heic1613/
- Mura, A. et al., Juno observations of spot structures and a split tail in Io-induced aurorae on Jupiter, Science (2018): https://doi.org/10.1126/science.aat1450
- ESA/Hubble, Hubble observes energetic lightshow at Saturn's north pole (heic1815, 2018): https://esahubble.org/news/heic1815/
- Schneider, N. M. et al., Discovery of diffuse aurora on Mars, Science (2015): https://doi.org/10.1126/science.aad0313
More exhibits
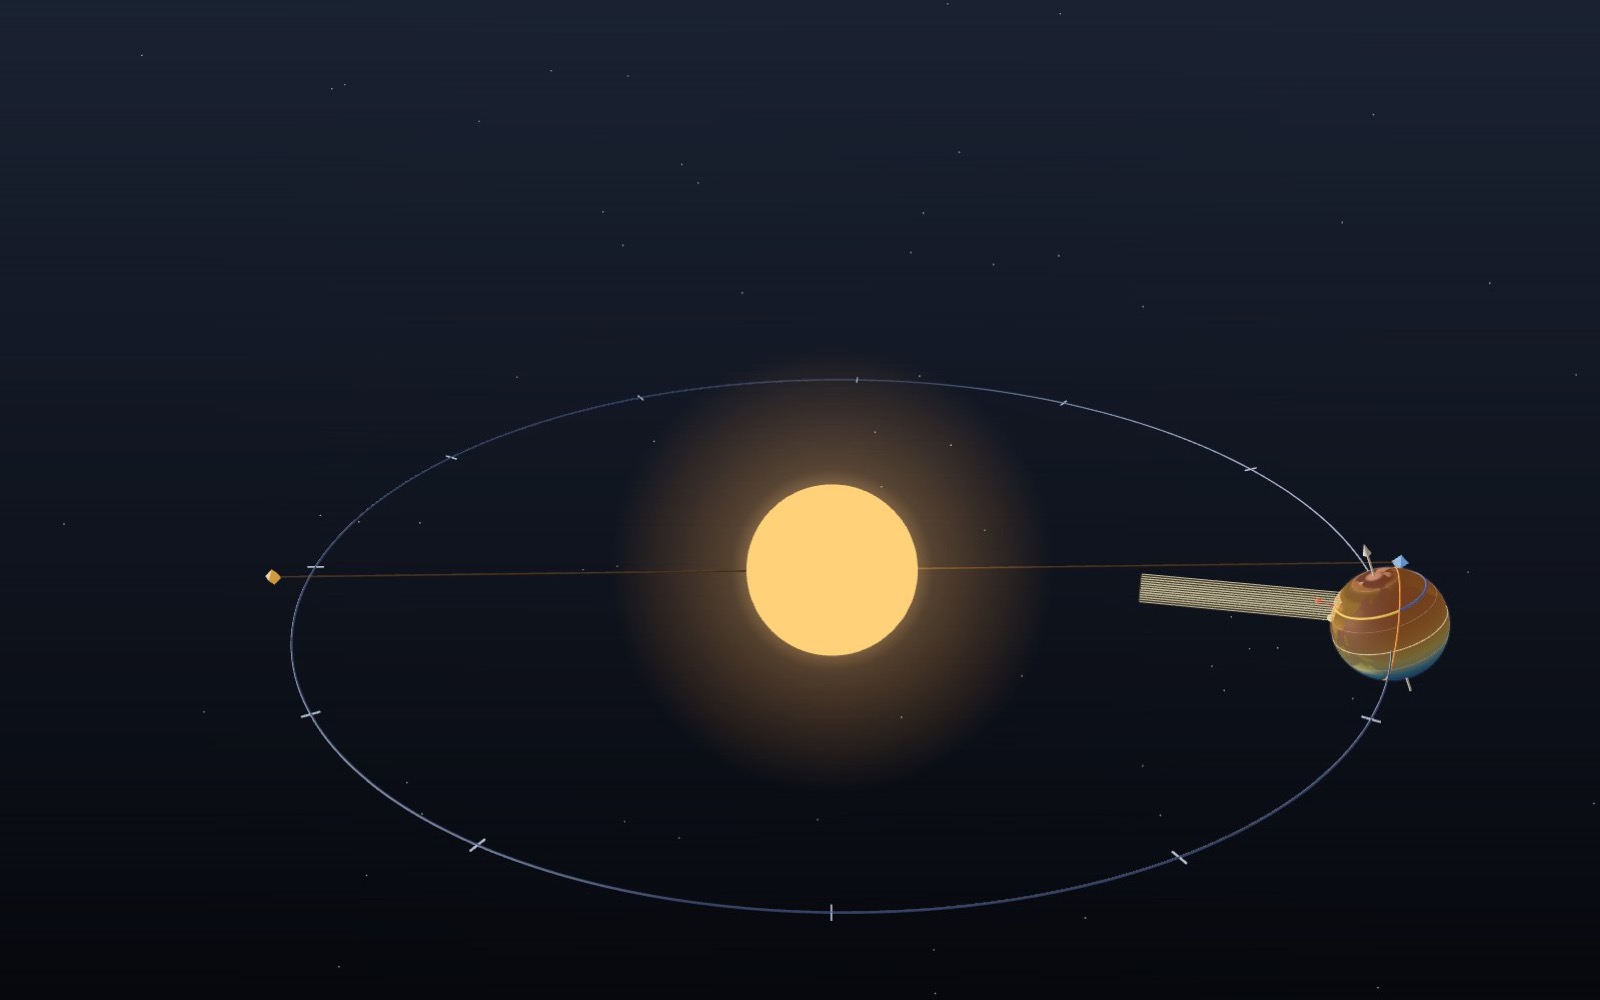
Why we have seasons: tilted Earth, changing daylight
The Earth is closest to the Sun in the first week of January, in the middle of the northern winter.
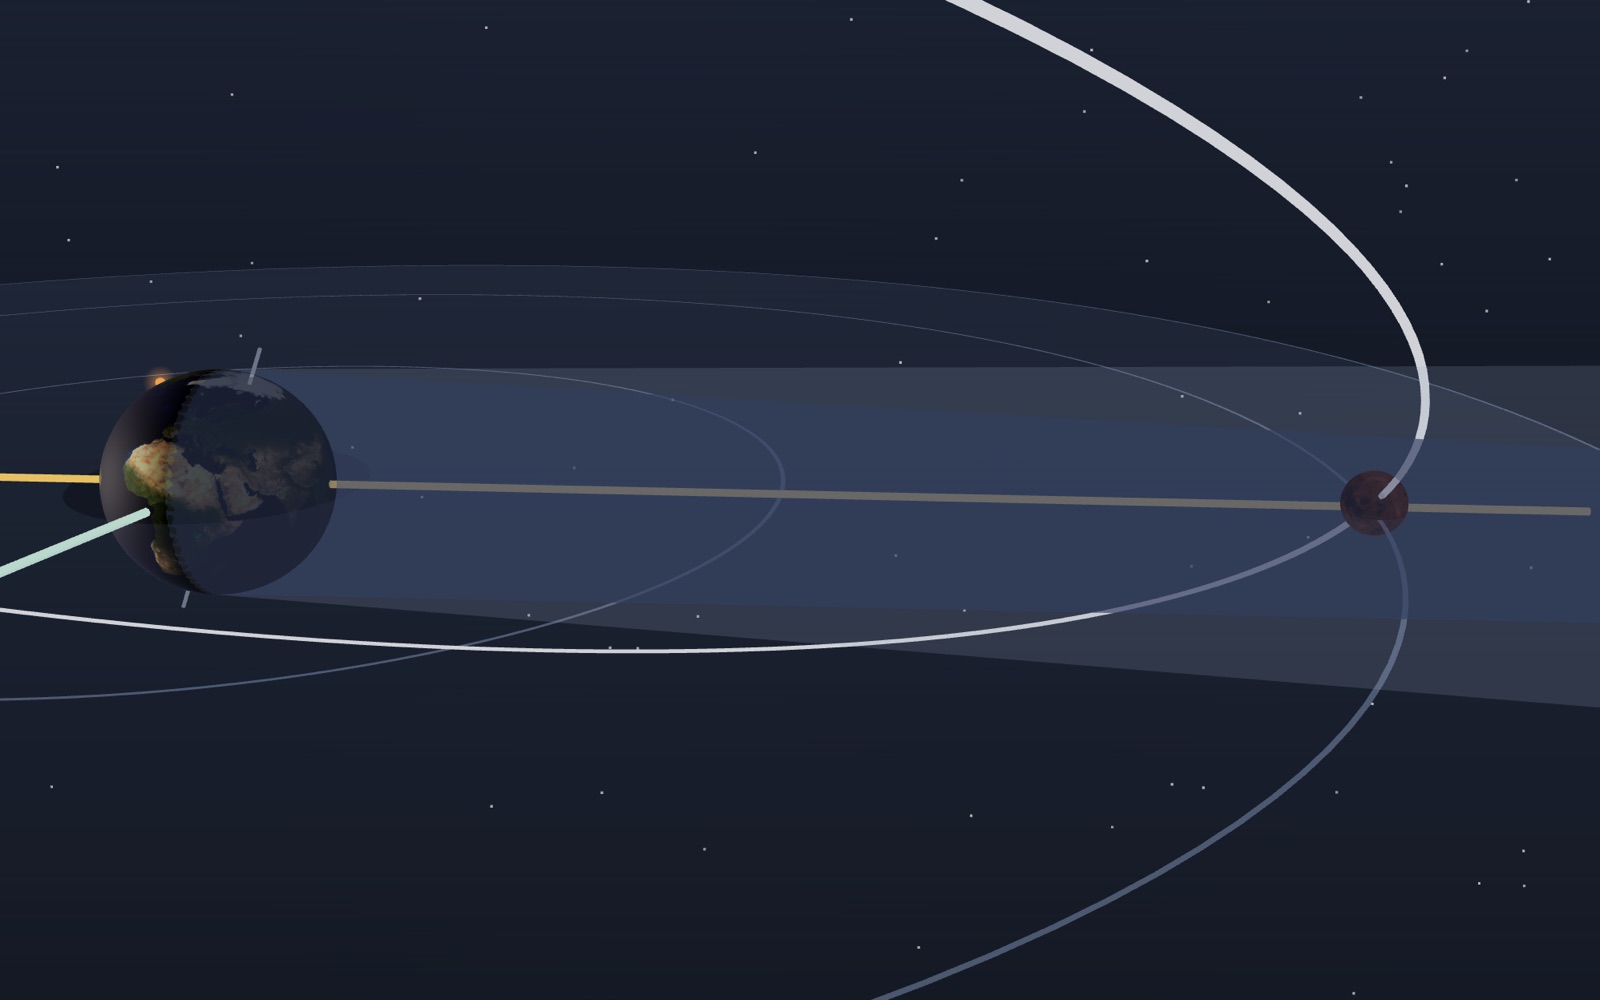
Moon phases: why a crescent is not Earth’s shadow
The Moon passes between the Earth and the Sun every 29.5 days, so why is there no solar eclipse every month?
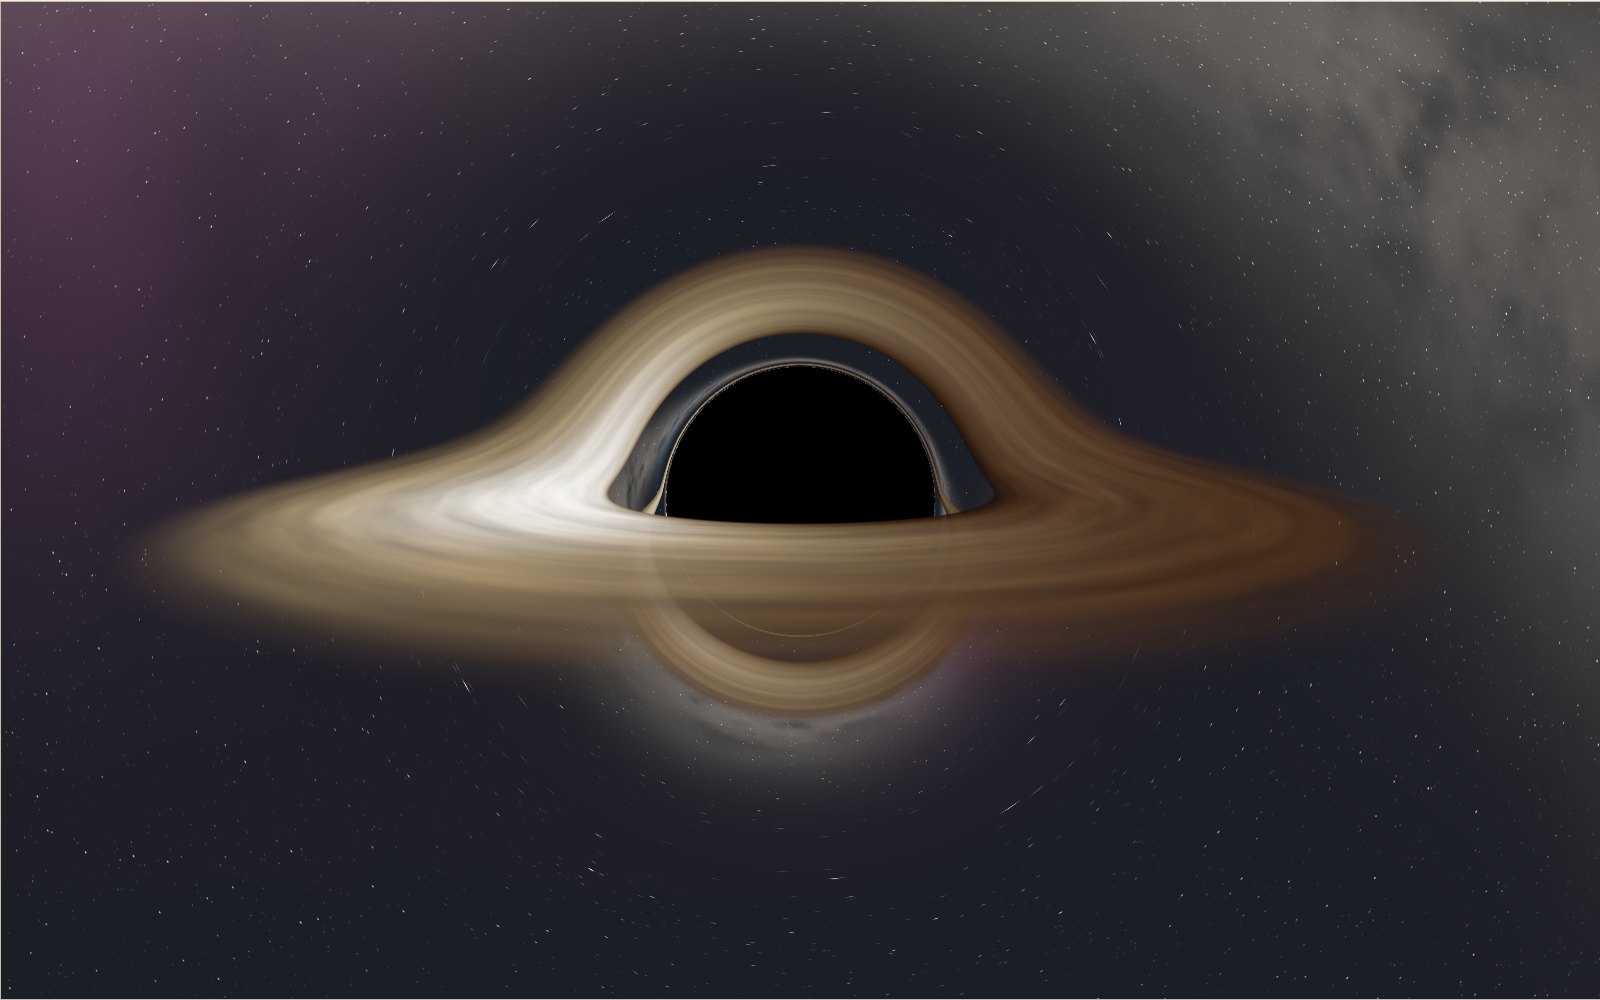
What you would see falling into a black hole
From 40 times the horizon radius a black hole's shadow is only 7.4° wide, yet starlight from directly behind it already forms a ring 28° across.
How big a crater would an asteroid make, and how craters form
The 1.2 km wide Meteor Crater in Arizona was dug by an iron asteroid only a few tens of metres across.
Travelling at the speed of light
Light goes round the equator 7.5 times in a second, yet the same light needs 2.5 million years to reach the Andromeda galaxy.
How tides work
The Moon raises the sea on the side of the Earth facing it, so why is there a second high tide on the side facing away?