FIG. 88Senses
Snowflake growth simulator: grow your own crystal
A snow crystal grown at −15 °C sprouts six branching arms, while one grown at −5 °C becomes a needle 2 mm long.

This device cannot show the 3D model. You can read the guide steps below as text.
1 / 8 A snow crystal growing at −15 °CThe air is at −15 °C and holds as much vapour as it can over water. The model adds ice cell by cell, and six arms with side branches appear. Pick another type from the bar along the bottom, or press Grow again.
Drag to turn. Scroll or pinch to zoom.
Catch one on a dark sleeve
Stand outside on a cold, still day when the snow is light, and let a few flakes land on a dark coat. Some are six-armed stars with branches like ferns. Others are flat hexagons, tiny six-sided pencils, or needles you might mistake for bits of hair. A few look like two plates joined by an axle. They all fell from the same sky, and they are all made of the same frozen water. So why do they look so different?
The short answer is that the shape of a snow crystal records the air it grew in. Two numbers matter most: the temperature, and how much extra water vapour the air holds beyond what ice needs. The model above grows a crystal from those two numbers, one small cell of ice at a time, so you can watch the shape appear and change. The bar along the bottom sets up 22 real crystal types, and the chart in the top corner shows where each one sits on the map of temperature and vapour.
Ice grows straight from vapour
A snow crystal is not frozen rain. It starts as a speck of ice, usually a cloud droplet that froze, floating in air that is below 0 °C and full of water vapour. Water molecules from the air land on the ice and stick. In deposition growth, the crystal gains ice directly from vapour. Liquid droplets can also collide with it and freeze, but that separate process is called riming.
The air in a winter cloud can hold more vapour than ice would allow, because it is saturated with respect to the tiny liquid droplets around it, and liquid water has a higher vapour pressure than ice at the same temperature. That difference is the fuel. Using the vapour-pressure formulas of Murphy and Koop, at −15 °C ice is in balance with 165.3 Pa of vapour, while supercooled water is in balance with 191.3 Pa. Air saturated over the droplets is therefore 15.7% supersaturated over ice:
191.3 / 165.3 − 1 = 0.157
The model expresses the same idea as an excess vapour density, the extra grams of water per cubic metre of air beyond ice saturation. At −15 °C, air saturated over water carries 0.218 g/m³ more vapour than ice saturation. That is the dashed "water saturation" line in the chart, and it peaks between −12 and −15 °C. A handy rule falls out of the numbers: in a cloud of droplets, the supersaturation over ice is close to 1% for every degree below freezing (2.0% at −2 °C, 10.2% at −10 °C, 27.6% at −25 °C).
The Excess vapour slider sets this number directly, from bone dry to 0.35 g/m³, which is more than a natural cloud usually reaches but still possible in the laboratory. The readout shows it three ways: in g/m³, as supersaturation over ice, and as a share of water saturation.
Why the corners outrun the faces
Start with a tiny hexagonal prism of ice. Vapour diffuses toward it from all directions, but it does not arrive evenly. The six corners stick out furthest into the air, so they meet more molecules per second than the middles of the faces. If the vapour supply is generous, the corners grow faster, stick out even more, and catch even more vapour. This runaway is a branching instability, and it is why arms appear.
Something pushes back. A perfectly flat crystal face is a poor place for a molecule to stay, because a lone molecule on a flat terrace has few neighbours to bond with. A new layer only starts when a small island of molecules happens to form, and that takes extra vapour. So flat faces grow slowly, and they tend to stay flat. This is called faceting, and it keeps a crystal hexagonal.
Every snow crystal is a contest between these two effects. In dry air faceting wins and you get plates and prisms. In wet air branching wins, the corners shoot out as arms, and each arm grows side branches for the same reason the corners did. Between the two you find sectored plates, broad branches and stellar plates with flat tips.
Move the Excess vapour slider from 0.02 to 0.3 at −15 °C and the model runs through that whole sequence: a hexagonal plate, a plate with ridges, broad branches, a stellar plate, a stellar dendrite and finally a fernlike dendrite.
Temperature decides plate or column
The second number, temperature, does something stranger. It changes which faces of the crystal grow fast. A hexagonal prism has two broad basal faces (top and bottom) and six narrow prism faces (the sides). Depending on the temperature, the basal faces can grow far faster or far slower than the prism faces, and the crystal grows as a flat plate or a long column.
The pattern was mapped by the Japanese physicist Ukichiro Nakaya, who grew snow crystals in a cold chamber at Hokkaido University in the 1930s and published the results in 1954. The map, now called the snow crystal morphology diagram or Nakaya diagram, has been refined many times, most thoroughly by Kenneth Libbrecht at Caltech. In rough terms:
| Temperature | Habit | With more vapour |
|---|---|---|
| 0 to −3 °C | Thin plates | Plates with simple branches |
| −3 to −10 °C | Columns | Hollow columns, then needles near −5 °C |
| −10 to −22 °C | Plates | Sectored plates, stellar plates, dendrites near −15 °C |
| below −22 °C | Columns and plates mixed | Bullet rosettes, thick plates |
It is surprising that the habit flips twice between 0 and −25 °C, from plates to columns and back to plates. Nobody has a complete theory for why. The leading explanations involve how the very top molecular layer of each face behaves at different temperatures, and that question is still being studied.
Slide Temperature from −2 to −25 °C with the vapour high, and the crystal goes from plate to needle to column to dendrite to thick plate. The red dot in the chart moves across the coloured regions as you do it. You can also tap the chart itself to pick any air.
How the model grows a crystal
The crystal on the stage is drawn from a cellular model published by Clifford Reiter in 2005. The flat plane of the crystal is divided into hexagonal cells, 12,481 of them in a disc 64 cells across from centre to edge. Each cell holds a number for its water vapour. On every step:
- A cell is "receptive" if it is already ice or touches ice.
- Receptive cells keep their vapour and gain a small fixed amount, γ (gamma).
- Every other cell shares its vapour with its six neighbours (diffusion).
- A receptive cell turns to ice when its total reaches 1.
The edge of the disc is held at a background level β (beta), the vapour far from the crystal. Reiter found that this tiny set of rules is enough to grow plates, sectored plates, stellar crystals and fernlike dendrites. When γ is large, every receptive cell fills at nearly the same rate, so faces stay flat. When β is moderate and γ small, the cells at the corners win the vapour supply and arms grow out.
The model maps your temperature and vapour onto β and γ through the Nakaya diagram. A plate uses about β = 0.35 and γ = 0.08, a stellar dendrite about β = 0.6 and γ = 0.008, a fern β = 0.8 and γ = 0.02. Columns are not something a flat cellular model can grow, so when the diagram says "column" the stage grows a hexagonal prism instead, with its length and width growing at a ratio taken from the same diagram. Each cell on the stage stands for about 30 µm, so the full disc is 3.84 mm across, the size of a large real stellar dendrite.
The model runs a few dozen steps per frame and stops each frame after 4 ms, so the page never freezes while it computes. A dendrite at −15 °C takes about 300 steps to reach the edge; a plate at −2 °C takes about 450.
The readout labels all of this as a model. Reiter's rules are not physics in the strict sense. They do not include heat, real diffusion constants, or the true attachment rates of molecules. They are a sketch that reproduces the shapes, and it is a good one, but the stage should be read as a picture of the idea, not a measurement.
Thick ridges and thin plates
Turn the crystal edge-on and you will see it is not uniformly thin. A real stellar dendrite is perhaps 10 to 50 µm thick, thinnest at the tips. The middle of each arm usually carries a ridge, and the centre is thickest of all. The reason is simple: the centre is the oldest part, so its basal faces have been growing the longest.
The stage gives every cell a thickness that grows with its age and adds a raised ridge along each of the six arms. The ridges catch the light as the crystal turns, which is also how they show up in photographs. The thickness in the readout is the centre of the crystal, in micrometres.
A crystal that changes its mind
A falling snow crystal does not stay in one kind of air. It drifts down through layers of different temperature and humidity, and it is pushed up and down by air currents. Each layer adds a new kind of growth on top of what is already there.
The capped column is the clearest example. It grows as a column in air near −6 to −9 °C, then moves into air near −13 to −15 °C, where plates grow. The plates start at the two ends of the column, and the result looks like a cotton reel. Pick Capped column CP1a in the bar to watch it: the yellow line on the chart is the path the crystal takes.
Turn on Falling through the cloud and the model follows a longer path, from the top of a cloud near −20 °C to its base near −3 °C. The core starts as a small thick plate, grows six branched arms at −15 °C, puts flat tips on them in drier air at −11 °C and thickens near −6 °C. The readout gives the height above the freezing level, using a drop of 6.5 °C per kilometre, so −20 °C is about 3.1 km up.
Because every arm of a crystal passes through the same air at the same time, the six arms grow almost the same history. That is why a snow crystal is symmetric even though nothing connects the arms except the plate in the middle. The arms do not communicate. They simply share an experience.
Why six sides
The six-fold symmetry goes all the way down to the molecules. Ordinary ice, called ice Ih ("h" for hexagonal), stacks water molecules in a lattice where each oxygen sits at the centre of four neighbours. Seen down the crystal's main axis, the c axis, the molecules form puckered hexagonal rings that tile the plane. A crystal grows by adding molecules in that same order, so its outline viewed along the c axis has directions separated by 60° and hexagonal interior angles of 120°. The basal faces meet the prism sides at 90°; not every angle in the three-dimensional crystal is 60° or 120°.
Turn on Ice lattice to see a block of 128 oxygen atoms with their 184 hydrogen bonds. The model uses lattice spacings of a = 0.4518 nm across the rings and c = 0.7356 nm along the axis, which put each oxygen 0.276 nm from its neighbours. You can check those numbers against the density of ice. A unit cell holds four molecules in a volume of (√3/2) a²c:
(√3/2) × 0.4518² × 0.7356 = 0.130 nm³
4 × 18.015 g/mol ÷ (6.022 × 10²³ × 1.30 × 10⁻²² cm³) = 0.920 g/cm³
The measured density of ice is 0.917 g/cm³, so the lattice and the bulk material agree to within half a percent. The hydrogen atoms are left out of the picture. They sit along the bonds, one per bond, and their arrangement is disordered.
Johannes Kepler asked why snowflakes have six corners in a short book in 1611. He suspected that packing of small spheres had something to do with it, but the answer had to wait about 300 years, until X-ray crystallography could see the lattice directly.
Can two snowflakes be the same?
Turn on Grow two at once and two crystals grow side by side from the same seed in the same air. The only difference is a small random scatter in the vapour each cell receives, set by Uneven air. Even with that scatter at 20%, the readout usually counts hundreds of cells that are ice in one crystal and not the other, out of several thousand. Turn the scatter to zero and the two become identical, because a computer can give them exactly the same air. Nature cannot.
Kenneth Libbrecht, who has grown and photographed snow crystals for decades, gives a careful answer to the old question. At the level of molecules, no two crystals are alike. About one water molecule in 5,000 contains a deuterium atom and about one in 500 contains oxygen-18. A typical small snow crystal holds about 10¹⁸ molecules, so roughly 10¹⁵ of them are of the rarer kinds, scattered at random. With some 10²⁴ crystals falling each year, the chance of two matching is indistinguishable from zero.
At the level you can see with a microscope, it depends on the crystal. Simple hexagonal prisms are common and small, and many of them look essentially alike. Complex stellar crystals are a different story. Libbrecht compares them to books on a shelf: 15 books can be arranged in more than a trillion ways (15! = 1,307,674,368,000), and 100 books in just under 10¹⁵⁸ ways. A complex snowflake has a hundred or so features that could each have grown a little differently, so the number of possible crystals is in that range, and two complex snowflakes have almost certainly never looked exactly alike.
Put 10¹⁵⁸ next to the 10²⁴ crystals a year. Even over the 4.5 billion years of Earth's history, about 4.5 × 10³³ crystals, the number of possible designs is larger by more than 10¹²⁰.
Graupel, hail, sleet and frost
Several kinds of frozen precipitation are easy to confuse with snow, and the bar includes them for comparison.
- Rimed crystal and graupel. Winter clouds are full of supercooled droplets, liquid water below 0 °C. When a snow crystal falls through them, droplets hit it and freeze on the spot. A few give a bumpy coat (rime); a lot bury the crystal completely and make graupel, soft white pellets that the US National Weather Service describes as 2 to 5 mm across.
- Hail is not a snow crystal at all. It forms inside thunderstorm updrafts, where frozen drops grow by collecting liquid water that freezes onto them. Layers of clear and cloudy ice record changes in temperature and water content along the way. The National Weather Service defines hail as ice more than 5 mm in diameter. On the stage it is cut open, shown at the same scale as the snow crystal beside it.
- Ice pellets (called sleet in the US) are snowflakes that melted in a warm layer and froze again in cold air near the ground. They are clear and round and have no crystal shape.
- Hoar frost grows exactly like a snow crystal, straight from vapour, but on a cold surface instead of in the air. That is why frost also shows plates, needles and fernlike shapes, sorted by the same temperatures.
- Diamond dust is a fall of tiny plates and columns in clear, very cold air. There is little vapour at −25 °C, so they never grow large.
How crystal types are named
The names in the bar come from the classification of Choji Magono and Chung Woo Lee, published in 1966, which sorted natural snow crystals into about 80 types with short codes. N is for needles, C for columns, P for plates, CP for columns combined with plates, and R for rimed crystals. P1a is a simple hexagonal plate, P1e an ordinary dendrite, C1f a hollow column, CP1a a capped column. The codes are still widely used by people who study falling snow.
Libbrecht's field guide uses friendlier names, such as stellar dendrites, sectored plates and capped columns. Most crystals that reach the ground, though, are neither tidy stars nor neat columns. They are irregular, broken or stuck together. Pick Irregular I and the model turns the uneven air all the way up.
Where the model is simplified
- The pattern grows in two dimensions. Real crystals grow in three, and their top and bottom faces can develop their own ridges and hollows.
- Thickness is assigned by a rule (age and a ridge bump), not calculated.
- The habit map is a hand fit to the Nakaya diagram. It puts the boundaries in about the right places but does not reproduce every detail found in the laboratory.
- Hollow columns are drawn with simple cone-shaped hollows; real ones vary.
- The model has no heat flow, no wind and no electric fields, all of which can affect real growth.
- Rime droplets are placed at random. Real riming depends on droplet size and the crystal's fall speed.
A short history
- 1611. Johannes Kepler writes On the Six-Cornered Snowflake, the first scientific essay on snow crystals.
- 1635. René Descartes describes snow crystals, including capped columns, as well as can be done by eye.
- 1665. Robert Hooke's Micrographia shows the first drawings through a microscope.
- 1931. Wilson Bentley (1865 to 1931), a Vermont farmer who photographed snowflakes for decades, publishes Snow Crystals.
- 1954. Ukichiro Nakaya publishes Snow Crystals: Natural and Artificial, with the first systematic map of shape against temperature and vapour.
- 1966. Magono and Lee publish their meteorological classification.
- 2005. Clifford Reiter publishes the cellular model used on this stage.
Reading the diagram without confusing the units
The values −2 °C, −5 °C and −15 °C identify useful examples, not three exact boundaries that every crystal crosses. Libbrecht's Caltech primer places plates and stars near −2 °C, slender columns and needles near −5 °C, and plates and stars again near −15 °C. A morphology diagram describes growth while the surroundings are held roughly steady. It does not say that an existing plate instantly turns into a needle when it enters another temperature band. New material grows on the old shape, as the capped column demonstrates.
Humidity needs equally careful reading. Ordinary weather reports usually give relative humidity with respect to liquid water. Snow-growth diagrams often use supersaturation relative to ice instead. At −15 °C, the earlier pressure example gives 100% relative humidity over water but about 15.7% supersaturation over ice. Neither number means that the cloud is 15.7% liquid water by volume. They compare a vapour pressure with an equilibrium vapour pressure.
The stage's vertical axis is different again: excess vapour in g/m³. Divide that excess by the ice-saturated vapour density to obtain the fractional supersaturation. The same slider value at a colder temperature therefore does not represent the same percentage. When comparing shapes across temperature, read Of water saturation as well as Excess vapour. The dashed line is a reference for a liquid-droplet cloud, not an unbreakable upper limit for a laboratory chamber.
How long does a millimetre of growth take?
Libbrecht's laboratory photographs provide a scale that the animation cannot supply. On his Caltech designer-snowflake page, one star is photographed after about 10 minutes of growth and again about 5 minutes later. In the later image its diameter is roughly 2.5 mm. A separate sequence produces a star about 4.5 mm across by moving a needle from −5 °C to −15 °C and then cycling between approximately −15 °C and −12 °C. These are controlled chamber examples, not a universal timetable for snowfall.
For a calculation, assume that a crystal increases in diameter from 0.5 mm to 2.5 mm over 10 minutes. Those endpoints and the interval are chosen for this example; they are not measurements extracted from those photographs. The mean diameter growth rate is (2.5 − 0.5) / 10 = 0.2 mm/min. Each tip moves outward at half that rate, 0.1 mm/min, or about 1.7 µm/s. Confusing radius growth with diameter growth would double the inferred speed.
Now assume a constant downward speed of 0.5 m/s relative to the ground and no updraft. In 10 minutes the crystal would descend 0.5 × 600 = 300 m. A rising air current could reduce that descent or reverse it, giving the crystal longer in a favourable layer. Neither this fall speed nor the growth rate is fixed in a real cloud. Size and shape alter drag, and the vapour supply changes along the path. The stage's Growth speed changes model steps per second; it does not calibrate those steps to minutes of atmospheric growth.
What laboratory snowflakes establish
A photograph records the final shape, whereas a chamber experiment can change one condition and watch the response. In Libbrecht's experiments, dendritic spikes near −15 °C give way to slower-growing sectored plates near −12 °C. That directly supports interpreting a change along an arm as a record of changed growth conditions. It does not let an observer reconstruct a unique cloud itinerary from a photograph: different combinations of temperature and vapour can leave similar features.
Caltech's account of his 2011 research describes a sharpening instability. As an edge becomes thinner, attachment can become faster, making the edge thinner still. This connects a molecular surface process with a thin plate large enough to photograph. It is related to, but not interchangeable with, the diffusion advantage of a protruding corner described earlier. Both surface attachment and the transport of vapour matter. The article illustrates a capped column about 1.5 mm long whose plates have split into thinner plates, a detail the stage does not calculate.
The claim that complex snowflakes differ also needs a limit. The book-ordering calculation is an illustration of how quickly possibilities multiply, not a measured probability distribution for snow crystals. Shapes are constrained by crystal symmetry, and possible patterns are not equally likely. A finite photograph collection cannot prove that no matching pair has ever existed. The practical statement is that richly branched natural crystals have many independently variable details, while simple prisms can be indistinguishable at the resolution of a microscope. State the observation scale before calling two crystals identical.
Comparisons to try on the stage
Begin with Falling through the cloud off and leave Grow two at once off. Set Temperature to −15 °C and compare Excess vapour at 0.03 and 0.21 g/m³. Keep the temperature fixed while the shape changes. This separates the effect of vapour supply from the plate-versus-column tendency. Use Grow again after changing the conditions if you want a fresh starting crystal rather than an inherited structure.
For a temperature comparison, choose Needle N1a in the type bar, then Stellar dendrite P1e. Their presets use −5 °C and −15 °C respectively. They also change excess vapour, so this pair is a comparison of two growth environments, not a controlled temperature-only experiment. The numerical readout makes that distinction visible. Rotate the needle to see its length instead of judging it only from one end.
Finally enable Grow two at once and compare Uneven air at 0% and 20%. The readout counts differing occupied cells, not molecular differences or a statistical probability of a match in nature. Turn on Ice lattice separately to inspect the structure behind the six-fold pattern. Six arms belong to the overall growth directions; each oxygen's four neighbours describe local bonding. Counting four bonds and six arms is not a contradiction, because they describe different scales.
Questions
Why are snowflakes six-sided?
Because ice is. The water molecules in ordinary ice sit in a hexagonal lattice, and a crystal grows by adding molecules in that order. Its faces meet at 60° and 120°, and each corner of the first hexagon becomes an arm.
Is it true that no two snowflakes are alike?
For complex crystals, almost certainly yes. They have about a hundred features that each could have grown differently, which gives far more possible designs than crystals that have ever fallen. Simple hexagonal prisms can look alike in a microscope, and molecule by molecule no two crystals are identical.
What temperature makes the classic star-shaped snowflake?
Around −15 °C, in air close to saturation over water. That is where plate growth is strongest and the excess vapour is near its peak, so the corners branch freely.
Why are the six arms so similar if they don't touch?
They grow at the same time through the same air. Each arm meets the same changes in temperature and humidity at the same moment, so they record nearly the same history. Small differences in the air around each arm make them slightly different, which is what most real snowflakes show.
Are snowflakes frozen raindrops?
No. A snow crystal grows from water vapour directly into ice. Frozen raindrops are ice pellets, which are clear and round. Graupel is a snow crystal coated with frozen cloud droplets.
What is the difference between graupel and hail?
Graupel is a snow crystal buried in rime, soft and white, usually 2 to 5 mm across. Hail grows in thunderstorm updrafts by collecting liquid water, is hard and often layered, and is more than 5 mm across by definition.
Why are some snowflakes needles or columns?
Between about −3 and −10 °C the top and bottom faces of an ice crystal grow faster than the sides. The crystal grows long instead of wide. Near −5 °C with plenty of vapour it becomes a needle.
How big is a snow crystal?
Most are a few millimetres or less. Large stellar dendrites can reach 5 mm or more. A typical small crystal holds about 10¹⁸ water molecules, which is about 0.03 mg of ice (10¹⁸ × 18.015 ÷ 6.022 × 10²³ = 3.0 × 10⁻⁵ g). Big fluffy snowflakes are clumps of many crystals stuck together.
Is the model on this page a real simulation?
It is a simplified model. The basal pattern comes from Reiter's cellular automaton, which reproduces the shapes with a few local rules. The choice of plate or column follows the Nakaya diagram by a hand fit. It is labelled as a model on the stage.
Can I convert model steps into real cloud minutes?
No. Growth speed changes the animation rate, while the model lacks calibrated molecular attachment rates and heat transport. Real laboratory examples take minutes to grow millimetre-scale crystals, but a model step has no assigned atmospheric duration.
Are −2 °C, −5 °C and −15 °C exact shape boundaries?
No. They mark representative plate, needle and dendrite conditions. Humidity and growth history matter too, and existing material remains when a crystal enters a new temperature layer.
Terms
- Snow crystal: a single crystal of ice grown from vapour. A snowflake can be one crystal or a clump of many.
- Supersaturation: how much more vapour the air holds than ice would allow, as a percentage.
- Excess vapour density: the same thing in grams of water per cubic metre of air.
- Water saturation: air saturated over liquid water. Below 0 °C it is supersaturated over ice.
- Basal face: the broad top or bottom face of a hexagonal ice crystal.
- Prism face: one of the six side faces.
- c axis: the six-fold axis of the crystal, through the basal faces.
- Habit: the overall shape a crystal takes (plate, column, needle).
- Dendrite: a crystal with branched arms.
- Faceting: the tendency of flat faces to grow slowly and stay flat.
- Rime: supercooled droplets frozen onto a crystal.
- Ice Ih: ordinary hexagonal ice.
Sources
Kenneth G. Libbrecht, Caltech: "Is it really true that no two snowflakes are alike?" https://www.its.caltech.edu/~atomic/snowcrystals/alike/alike.htm (checked 2026-10-17)
Kenneth G. Libbrecht, SnowCrystals.com: "A Guide to Snowflakes." https://www.snowcrystals.com/guide/guide.html (checked 2026-10-17)
Kenneth G. Libbrecht, Caltech: "Historic Snowflakes: early observations." https://www.its.caltech.edu/~atomic/snowcrystals/earlyobs/earlyobs.htm (checked 2026-10-17)
Kenneth G. Libbrecht, Caltech: "Physical Properties of Ice." https://www.its.caltech.edu/~atomic/snowcrystals/ice/ice.htm (checked 2026-10-17)
Kenneth G. Libbrecht: Snow Crystals, arXiv:1910.06389 (2019). https://arxiv.org/abs/1910.06389 (checked 2026-10-17)
Clifford A. Reiter: "A local cellular model for snow crystal growth," Chaos, Solitons & Fractals 23 (2005). https://doi.org/10.1016/j.chaos.2004.06.071 (checked 2026-10-17)
Choji Magono and Chung Woo Lee: "Meteorological Classification of Natural Snow Crystals," Journal of the Faculty of Science, Hokkaido University (1966), HUSCAP. https://hdl.handle.net/2115/8672 (checked 2026-10-17)
NOAA JetStream: "Types of Weather Phenomena," hail, graupel and ice pellets. https://www.noaa.gov/jetstream/synoptic/types-of-weather-phenomena (checked 2026-10-22)
US National Weather Service Amarillo: "Winter Precipitation Types," melting and refreezing layers. https://www.weather.gov/ama/preciptypes (checked 2026-10-22)
US National Weather Service glossary: "Hail." https://forecast.weather.gov/glossary.php?word=hail (checked 2026-10-17)
US National Weather Service glossary: "Snow Pellets." https://forecast.weather.gov/glossary.php?word=snow+pellets (checked 2026-10-17)
Caltech: "Snowflake Science" (2011), edge-sharpening experiments. https://www.caltech.edu/about/news/snowflake-science-2023 (checked 2026-10-22)
Kenneth G. Libbrecht, Caltech: "A Snow Crystal Primer," morphology diagram and humidity. https://www.its.caltech.edu/~atomic/snowcrystals/primer/primer-old.htm (checked 2026-10-22)
Kenneth G. Libbrecht, Caltech: "Designer Snowflakes, Part One," timed chamber photographs. https://www.its.caltech.edu/~atomic/snowcrystals/designer1/designer1.htm (checked 2026-10-22)
Kenneth G. Libbrecht: "The physics of snow crystals," Reports on Progress in Physics 68 (2005), CaltechAUTHORS record and research review. https://authors.library.caltech.edu/records/70qmc-09861 (checked 2026-10-22)
More exhibits
How tides work
The Moon raises the sea on the side of the Earth facing it, so why is there a second high tide on the side facing away?
Coral bleaching causes: why warmer water turns reefs white
Corals get most of their food from algae living in their tissue, and when the sea stays more than 1 °C above its usual summer high for weeks, they lose those algae and turn white.
Why do ships float?
A 1,900-tonne steel ship floats, yet the same 1,900 tonnes of steel pressed into a cube goes straight to the bottom.
Swim to the bottom of the Mariana Trench in a 3D ocean
By 20 m down, almost all the red in sunlight has gone, and the Challenger Deep is another 10,900 m below that.
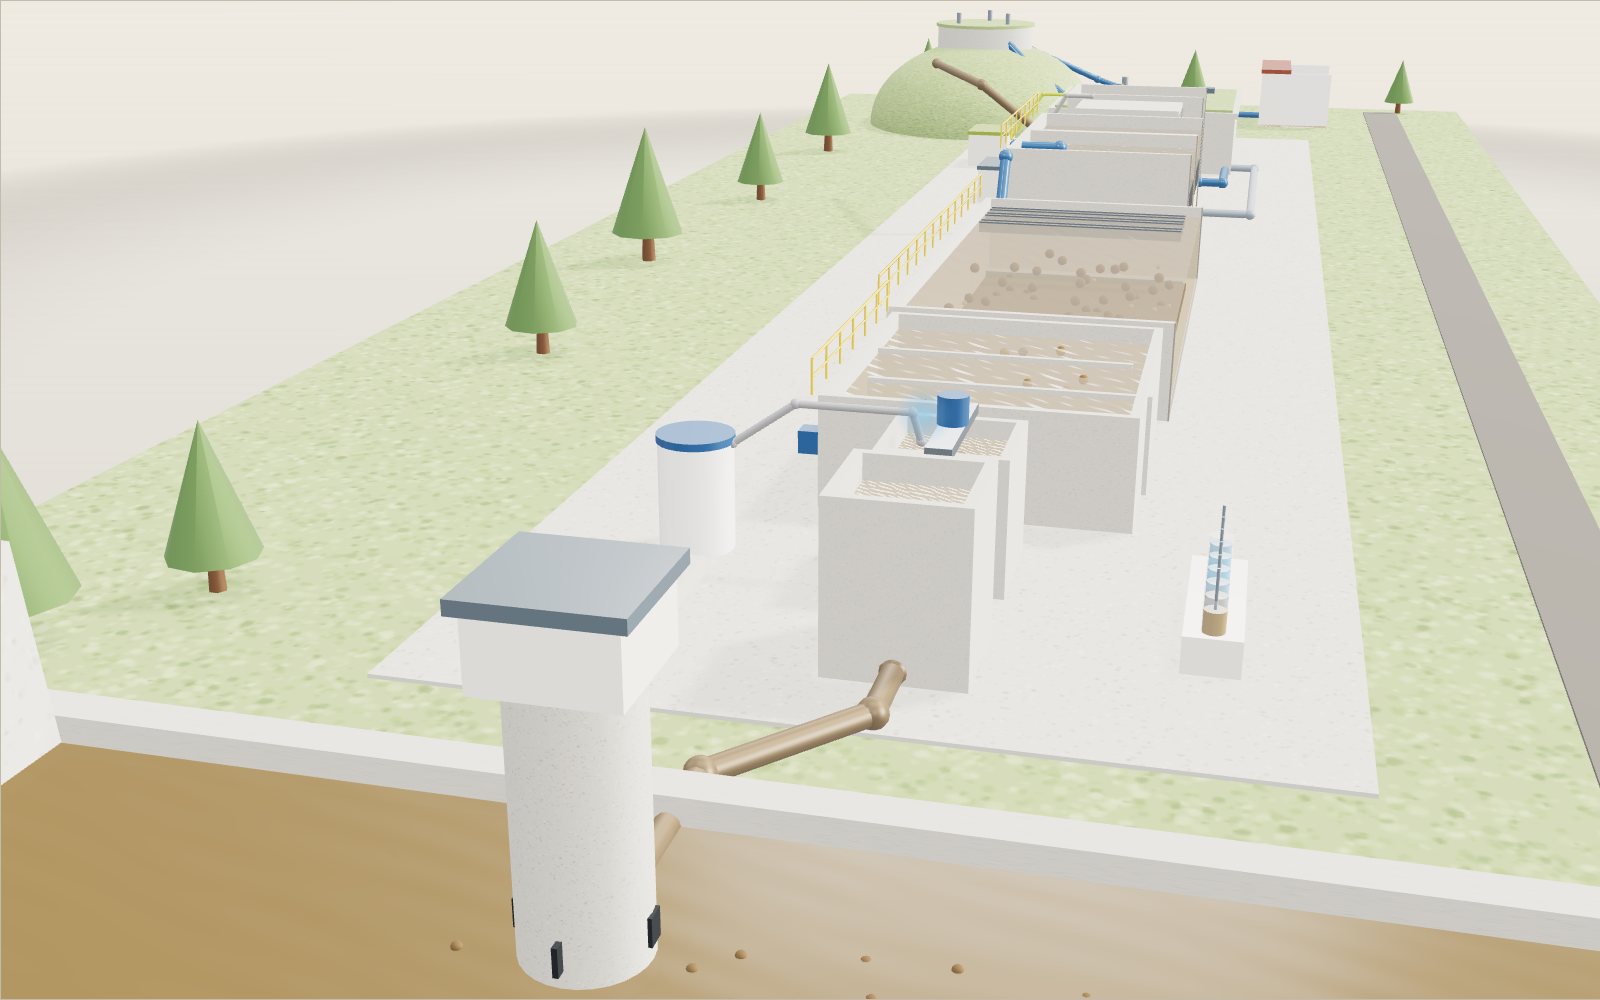
How a water treatment plant turns muddy water clear
A grain of clay two micrometres across would take eleven days to sink through a settling basin, but stuck into a floc by a coagulant it reaches the floor in about two hours.
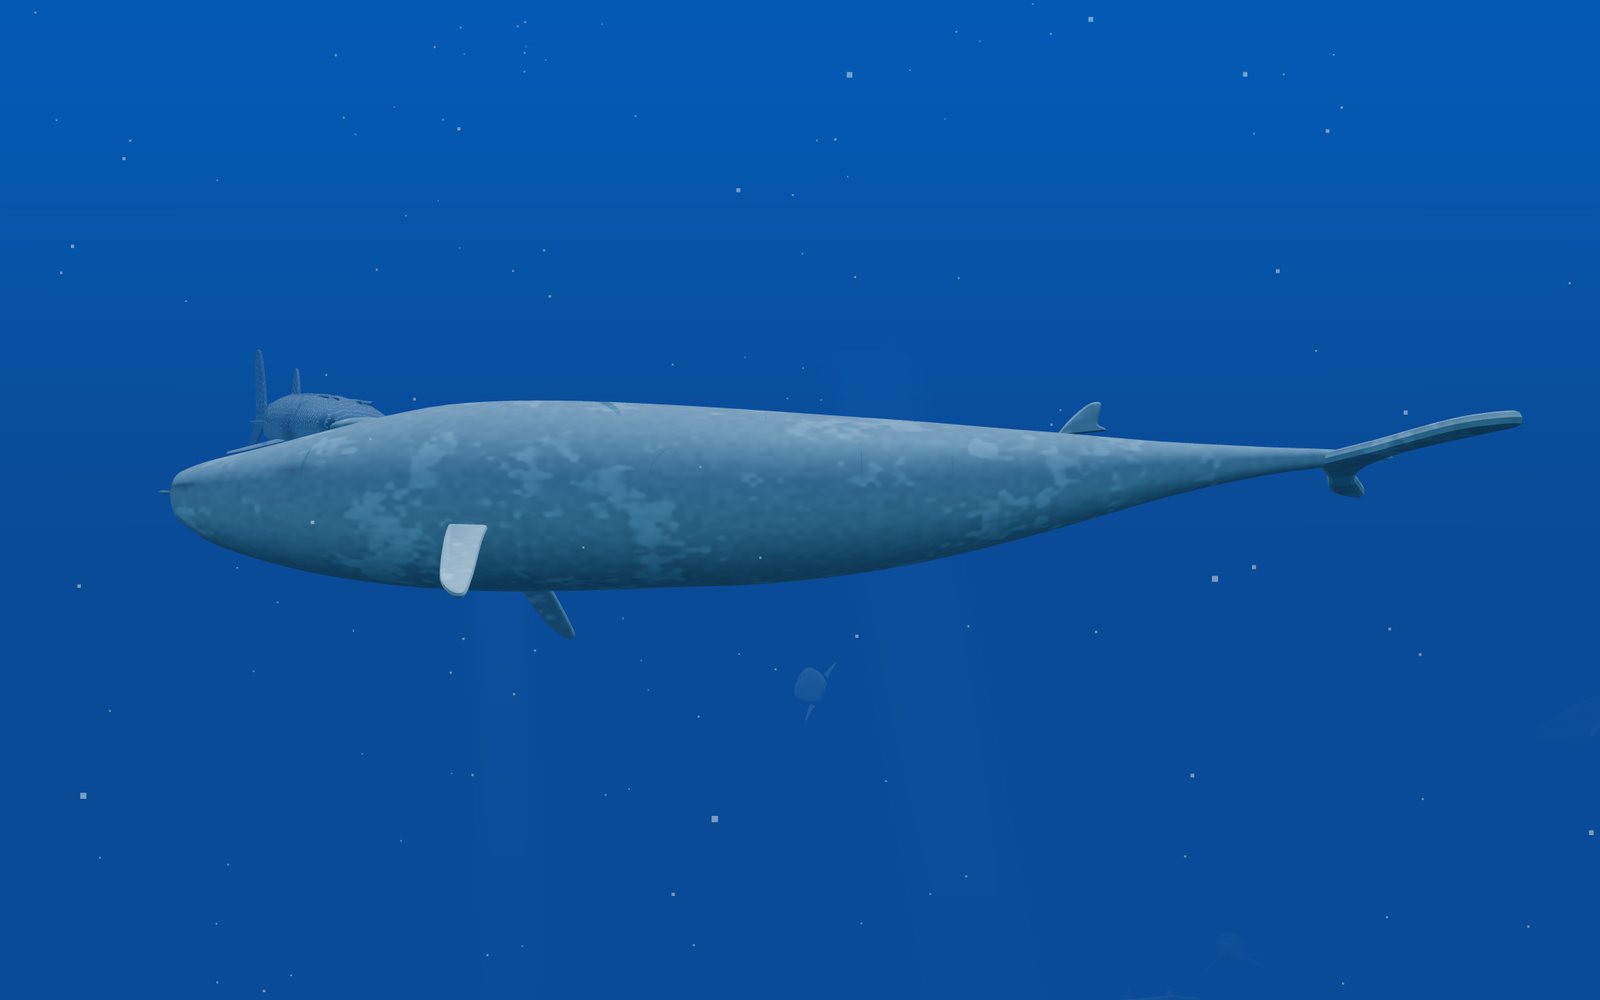
Giants of the sea: megalodon and the blue whale
Swim beside 48 sea giants at their real size, from a 28 m blue whale to megalodon, Livyatan and Mosasaurus, in eight seas from today back to the Triassic.