FIG. 60How It Works
How a water treatment plant turns muddy water clear
A grain of clay two micrometres across would take eleven days to sink through a settling basin, but stuck into a floc by a coagulant it reaches the floor in about two hours.
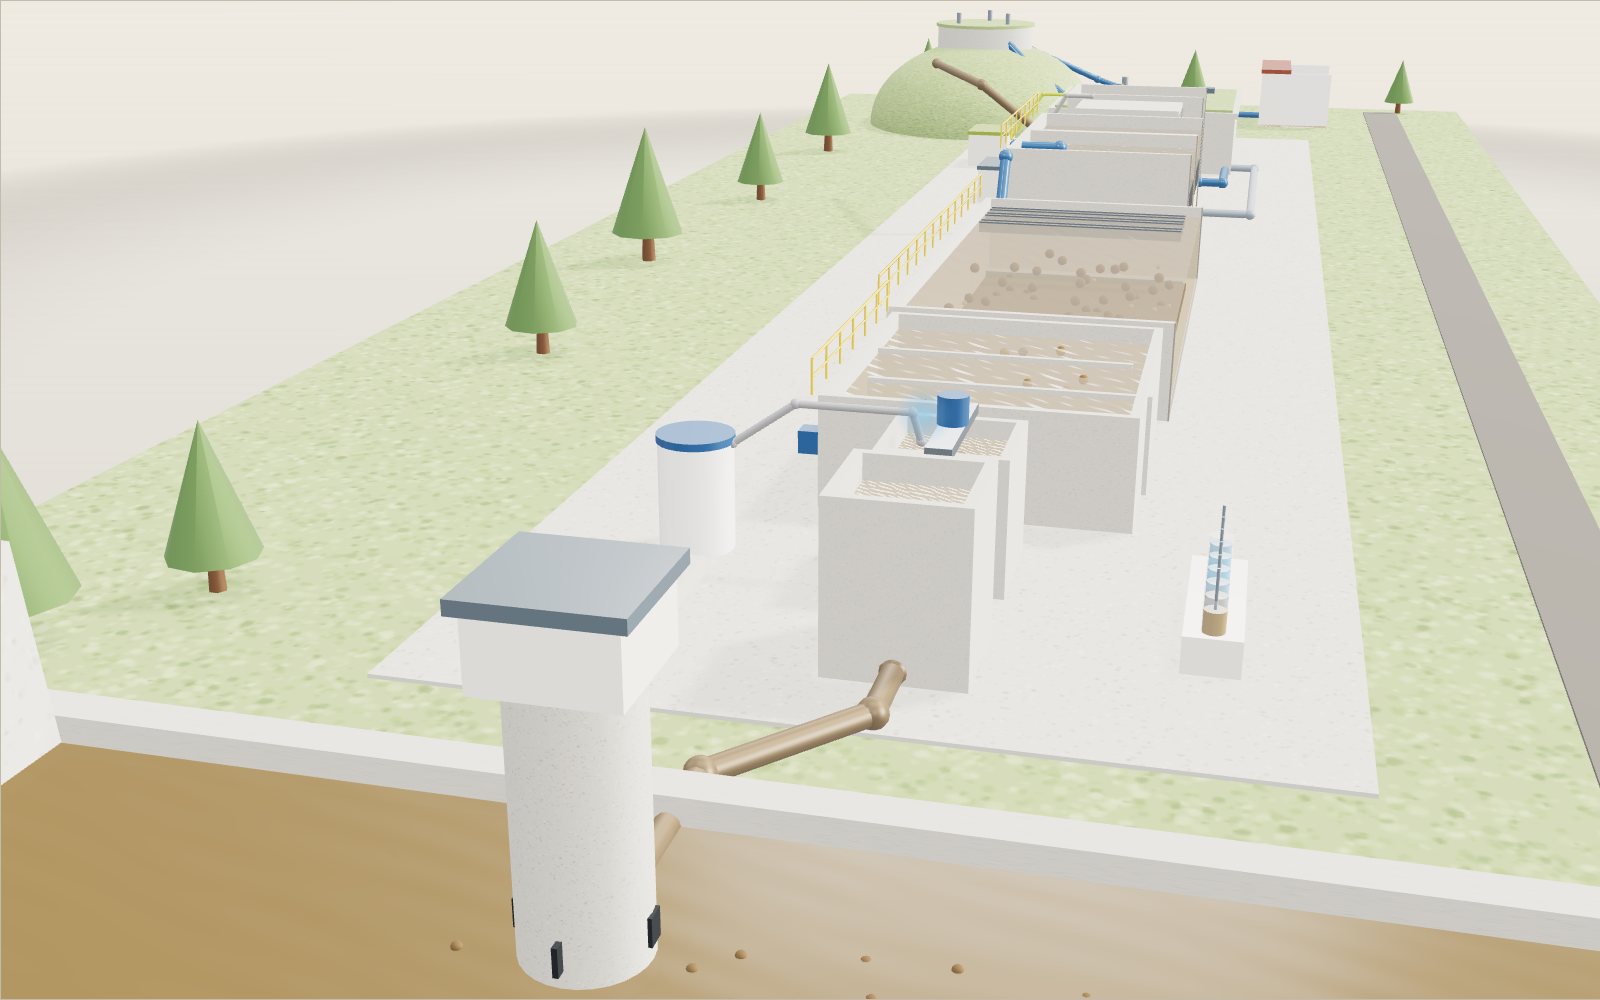
This device cannot show the 3D model. You can read the guide steps below as text.
1 / 11 You are the dropYou start as one drop in a muddy river behind the dam and get pulled into the intake tower. Use the bar on the stage to go inside each stage of the plant, or click a building. The readout follows turbidity and bacteria from river to tap; the numbers are model values and the limits drawn are the Korean ones.
Drag to turn. Scroll or pinch to zoom.
What the model shows
A water treatment plant makes muddy water clear by gathering fine particles into larger flocs, settling them and filtering what remains. Disinfection then reduces the risk from microbes. In Korea, tap water must be at 0.5 NTU or less. Clear appearance alone does not show that water is safe to drink.
Fill a glass from the kitchen tap and the water is clear, cold and faintly smells of chlorine. A day or two earlier it was part of a brown river. Between the river and the glass it went through a treatment plant that spent most of its effort on one problem: clay grains so small that they will not sink by themselves.
The model lays a whole plant out on one table, from left to right. A dam holds back a reservoir, and an intake tower in the river draws water off below the surface. A pipe takes it to the receiving well, then to a rapid-mix tank where coagulant is dosed, then through three flocculation bays with paddles, a long settling basin, two rapid sand filters, an ozone contactor, an activated carbon filter and a baffled clearwell where chlorine is added. A pump lifts the water to a service reservoir on a hill, and a pipe brings it down to a kitchen tap.
It opens with you as one drop in a muddy river below the dam. The camera rides behind the drop as the intake tower pulls it in, then rises over the whole plant. The tag above the drop shows the turbidity and the bacteria count it would carry at that point, and the chart in the readout shows the same two numbers for every stage. The microscope inset shows a patch of the water 400 micrometres across.
The bar on the stage takes you inside each stage: Intake (the screen in front of the intake opening, a section about 2 m across), Floc (1 mm of water where clay grains meet the coagulant and clump into flocs at their true size), Settle (a section of the basin with sludge building up on the floor), Filter (a section of the sand and anthracite bed, about 1 m deep), Disinfect (20 µm of water where bacteria, viruses and Cryptosporidium oocysts meet chlorine, ozone and UV) and Tap (one glass). Clicking a building on the board does the same.
The controls change the river and the plant: river turbidity (1 to 1,000 NTU), coagulant dose (0 to 150 mg/L), clay grain size, pH, filter rate, chlorine dose, ozone and carbon, UV light and backwash. The raw water figures (10 NTU and 1,000 bacteria per millilitre by default) are model values, as are most plant settings; the readout says so. The limits drawn on the chart are the real Korean ones.
Why clay will not settle on its own
River water looks muddy because of particles of clay and silt, most of them a few micrometres across. Turbidity, measured in NTU (nephelometric turbidity units), is a measure of how much light these particles scatter. Korean rules allow tap water no more than 0.5 NTU, which looks perfectly clear in a glass.
Leave a jar of muddy water on a shelf and the sand drops out in seconds, but the cloudiness stays for days. The reason is Stokes's law. A small sphere sinking through water reaches a steady speed
v = g × Δρ × d² / (18 × μ)
where g is gravity, Δρ is how much denser the particle is than water, d is its diameter and μ is the viscosity of water (about 1.0 mPa·s at 20 °C). The diameter is squared. A grain ten times smaller sinks a hundred times more slowly.
For a mineral grain (2,650 kg/m³) in water at 20 °C, the model gives:
| Grain diameter | Sinking speed | Time to fall 3.5 m |
|---|---|---|
| 0.5 µm | 0.0008 m/h | 180 days |
| 2 µm | 0.013 m/h | 11 days |
| 10 µm | 0.32 m/h | 11 hours |
| 20 µm | 1.3 m/h | 2.7 hours |
| 100 µm | 32 m/h | 6.5 minutes |
A settling basin that holds the water for two or three hours can catch sand and coarse silt, but the fine clay that makes the water cloudy would pass straight through. To remove it, the plant has to make the particles bigger.
How a coagulant makes grains stick
Clay grains in water carry a negative surface charge. Two grains that drift close push each other away, so they never touch, and the cloud stays stable. This is why the jar on the shelf stays murky.
At the rapid-mix tank the plant doses a coagulant, an aluminium or iron salt; Korean plants commonly use polyaluminium chloride. The positively charged aluminium species cancel the charge on the grains, and some of the aluminium also forms a sticky hydroxide that sweeps grains together. The water is stirred hard for about a minute so the chemical reaches every grain before it reacts away.
The right dose depends on the water, and plants find it with a jar test: a row of beakers with different doses, stirred the same way, compared after settling. Too little coagulant leaves many grains still charged. Too much can give them a positive charge, and they start pushing each other apart again. The model uses an example jar-test curve with the best dose at 25 mg/L.
Flocs grow in gentle stirring
After the rapid mix, the destabilised grains need to meet each other many times. The flocculation basin stirs the water with slow paddles, and the paddles in each bay turn more slowly than in the last. Early on, gentle mixing helps small grains collide. Later, the flocs are large and fragile, and fast paddles would tear them apart.
A floc is not a solid ball. It is a loose, branched cluster that holds a lot of water, so the bigger it grows, the closer its average density gets to that of water. The model treats flocs as fractal clusters with a fractal dimension of 2.2. A floc grown from 2 µm grains to 120 µm is only 62 kg/m³ denser than water, compared with 1,650 kg/m³ for a single grain. Even so, because of the squared diameter, it sinks at 1.76 m/h, about 140 times faster than the grains it is made of.
The microscope inset shows the change. At a dose of 0 the field is full of separate grains jiggling about. Raise the dose and the grains gather into clumps; at 25 mg/L nearly all of them are inside flocs.
The settling basin and Stokes's law
The settling basin is a long tank where the water moves so slowly that it barely seems to move. An ideal basin, a model usually credited to the American engineer Allen Hazen, gives a simple rule. Water enters at one end and leaves at the other, so every particle spends the same time crossing the basin. The time is the depth divided by the overflow rate, the flow divided by the surface area. In the model the overflow rate is 1.5 m/h and the depth 3.5 m, so the water spends 2.3 hours in the basin.
A particle that sinks faster than the overflow rate reaches the floor before the outlet, wherever it started. A slower particle is caught only if it started low enough. The share caught is its sinking speed divided by the overflow rate. You can see this in the cutaway: every particle moves across at the same speed, and each falls at its own Stokes speed scaled to the overflow rate.
Here is what the model gives for the 2 µm river clay at different coagulant doses (filtered water figures come from the next stage):
| Coagulant dose | Floc size | Sinking speed | Caught in basin | After settling | After filters |
|---|---|---|---|---|---|
| 0 mg/L | 2 µm | 0.013 m/h | 0.9 % | 9.9 NTU | 5.0 NTU |
| 5 mg/L | 55 µm | 0.68 m/h | 21 % | 7.9 NTU | 1.4 NTU |
| 10 mg/L | 88 µm | 1.2 m/h | 59 % | 4.1 NTU | 0.38 NTU |
| 25 mg/L | 120 µm | 1.76 m/h | 100 % | 1.0 NTU | 0.050 NTU |
| 60 mg/L | 72 µm | 0.95 m/h | 38 % | 6.2 NTU | 0.80 NTU |
The grain size slider shows the other side of the same law. Keep the dose at 25 mg/L and make the river clay finer. With 1 µm grains the flocs reach only 60 µm, sink at 0.44 m/h and the basin catches 29 % of the turbidity; with 0.5 µm grains it catches 7 %. Very fine colloids are one reason real plants sometimes add polymer flocculant aids or choose a different coagulant.
Filters catch what the basin missed
Settled water still holds about 1 NTU in the model, mostly small flocs. It flows down through a rapid filter, a bed of coarse anthracite on top of finer sand on top of gravel, sitting on an underdrain with nozzles. Korean rules define rapid filtration as running at 120 m or more per day, which is 5 m/h.
A filter is not a sieve. The gaps between sand grains are far larger than the particles, and the particles are caught because they hit the grains deep inside the bed and stick. That is why coagulation matters here as well: destabilised particles stick much better. The model gives the filter a log removal of 0.3 without coagulant and 1.3 with full coagulation, so 1 NTU comes out as 0.05 NTU. Korean rules require that 95 % of monthly samples of filtered water are at or below 0.3 NTU and that no sample is above 1 NTU.
Anthracite is lighter than sand, so the coarse layer stays on top after washing. The bed slowly clogs and the water level above it rises. Then the cell is taken offline and backwashed: water, often with air first, is pushed up through the bed so that it expands and the grains rub each other clean, and the dirty water spills into the troughs. Switch on Backwash to see the right-hand cell lift and the troughs fill with brown water.
Ozone and activated carbon, briefly
Many large Korean plants add advanced treatment after the filters. Ozone is bubbled through the water in a covered contactor. It is a strong oxidant that breaks down compounds such as geosmin and 2-MIB, which give an earthy taste when algae bloom, and it also kills microbes. The water then passes through a deep bed of granular activated carbon, whose huge internal surface adsorbs organic matter that is left. In the model these steps take off one more log of bacteria; switch them off and the water takes the bypass pipe at the front.
Chlorine works by concentration times time
Disinfection is the last barrier. Bacteria such as E. coli die within seconds in a small amount of free chlorine, but viruses and protozoan cysts such as Giardia need much more exposure. Regulators measure that exposure as CT: the disinfectant concentration left at the outlet (mg/L) multiplied by the contact time (minutes). In the US Surface Water Treatment Rule, which uses the same idea, the treatment must remove or inactivate at least 99.9 % of Giardia cysts and 99.99 % of viruses, and filtration and disinfection add up towards that target.
The time that counts is not the average time but T10, the time in which the first 10 % of the water gets through. A plain tank lets some water shoot straight across; that is why the clearwell has baffle walls that force the water to snake back and forth. The model uses T10 = 30 minutes and assumes the water uses up 0.3 mg/L of chlorine at once. A dose of 1.0 mg/L leaves 0.7 mg/L, so CT = 0.7 × 30 = 21 mg·min/L. Korean rules express the result as an inactivation ratio, the CT achieved divided by the CT required for the temperature and pH, and it must be at least 1.
From the clearwell to your tap
Pumps lift the water to a service reservoir on high ground, which evens out demand through the day and gives the pressure that pushes water to houses by gravity. On the way, chlorine keeps reacting with the pipe walls and what is left in the water. The model lets it decay at 4 % per hour for 24 hours. Korean rules require at least 0.1 mg/L of free chlorine at the tap, so a little disinfectant is still there if something gets into the pipes, and no more than 4.0 mg/L.
Drag the chlorine slider and watch the last point on the bacteria chart. At 1.0 mg/L, 0.27 mg/L reaches the tap. At 0.6 mg/L it is 0.12 mg/L, just enough. At 0.5 mg/L only 0.08 mg/L arrives, and the model lets bacteria regrow in the pipes, an example of why the minimum exists.
Muddier water needs more coagulant, and the right pH
In the model the best coagulant dose grows with the river's turbidity, as (turbidity / 10 NTU)^0.45 × 25 mg/L: about 41 mg/L at 30 NTU, 70 mg/L at 100 NTU and 115 mg/L at 300 NTU. The exponent is a model value that copies the usual shape of jar-test results, where doubling the turbidity does not double the dose. Too little coagulant leaves most grains single; far too much coats them with charge of the other sign and they push apart again, which is why the floc size falls past the best dose.
pH matters as much as the dose. Aluminium coagulants work best in a window around neutral; in the model the share of grains that join flocs falls to about 64 % at pH 6 or 8 and 37 % at pH 5.5 or 8.5. Real plants run jar tests at several pH values for this reason, and correct the pH with acid or alkali when the river changes.
After heavy rain a river can carry far more silt than usual. On the stage, 300 NTU at the normal 25 mg/L leaves about 230 NTU after the basin and 39 NTU after the filters. With about 115 mg/L the flocs come back, the basin leaves 5.5 NTU and the filters bring it to 0.27 NTU at 5 m/h, just inside the 0.3 NTU limit. Push the filters to 8 m/h and the same water comes out at 0.51 NTU: storm water usually needs slower filtering as well as more coagulant.
When the filter fills
A filter bed catches particles in the spaces between its grains, so it slowly fills. The Filter load row counts this in the model: it rises faster when more turbidity reaches the filter and when the filter runs faster. While the load is under 100 % nothing changes at the outlet. Above it, particles start to break through and the filtered turbidity climbs quickly; in the model it is about 13 times higher at 130 %. Operators watch the head loss and the filtered turbidity and backwash before that happens, pushing air and water up through the bed so it lifts and the dirt washes into the troughs.
Three microbes, three barriers
The Disinfect view shows why plants use more than one barrier. Ordinary bacteria die quickly in chlorine. Viruses need more: US rules count a 4-log virus kill at a CT of 6 mg·min/L at 10 °C. Cryptosporidium oocysts have a wall that normal chlorine doses barely touch, so they are removed mostly by coagulation and filtration and inactivated by UV, which needs about 22 mJ/cm² for 4 logs.
pH changes chlorine too. Free chlorine is a mix of hypochlorous acid (HOCl, green dots) and hypochlorite ion (OCl⁻, pale blue dots). The split depends on pH, with half of each at about pH 7.5: at pH 7 about 78 % is HOCl, at pH 8.5 only about 10 %. HOCl is by far the stronger disinfectant, so in the model the same chlorine kills viruses much more slowly in alkaline water. At pH 8.5 and 0.8 mg/L the virus kill drops from 6 logs or more to about 1.3; raising the dose to 2.0 mg/L brings it back above 4 logs, and so does bringing the pH back to 7.
The readout's last row gives the disinfection logs for bacteria, viruses and Cryptosporidium. The whole-plant figure the challenges use for Cryptosporidium adds the removal by settling and filtering, which the model ties to the turbidity removal.
A day of your water
Seoul supplied 3,084,211 m³ of water a day on average in 2025, 307 litres per person, counting shops and offices as well as homes. The model plant makes 100,000 m³ a day, about 1,157 litres a second, so 307 litres take it about a quarter of a second, and its day of water covers about 326,000 people at that rate. At Seoul's average household price of 600.5 won per m³ in 2025, a litre of tap water costs about 0.6 won before sewerage charges.
What the model leaves out
The plant is drawn at a small scale and the parts are not to scale with one another. A real settling basin is 50 to 100 metres long and several metres deep, and a medium-size plant has a dozen or more filter cells. Particle sizes on screen follow the logarithm of the real size, because a 2 µm grain and a 120 µm floc could not both be seen at true scale.
The sums are simplified on purpose. Real river water carries a wide spread of particle sizes, not one, and floc growth depends on mixing energy, temperature, pH and the chemistry of the water, not only on the dose. Real basins are not ideal; currents and wind lower their performance. The filter removal and bacteria counts are example values chosen to show the trend. The regrowth in the pipes is a cartoon of a real risk, not a measurement. Plants also adjust pH, sometimes add a pre-chlorination step and deal with the sludge, which the model only shows as a brown layer on the basin floor.
The newer controls rest on further model values: the best dose grows as (turbidity / 10 NTU)^0.45, the pH window is a bell curve centred on pH 7 with a width of 1.5 units, the filter removal scales with the square root of 5 m/h over the filter rate, the filter load rises with the 0.4 power of the settled turbidity and break-through grows 40 times as fast as the overload, ozone adds 1 log for bacteria, 2 for viruses and 0.5 for Cryptosporidium, UV is set at 40 mJ/cm², and viruses and oocysts follow half and nine tenths of the turbidity log removal through the plant. The smell lines over the glass start at 1.0 mg/L at the tap, a model threshold: the WHO notes that some people can taste chlorine at levels as low as 0.3 mg/L, and the limit of 4.0 mg/L is far above that. The close-up views are not to one scale: each caption gives its own.
Worked example: sizing a plant that makes 100,000 m³ a day
The exhibit gives rates and depths but not the size of the tanks. Here is a rough sizing for a mid-sized city plant, 100,000 m³ of water a day. The flow is an assumption, and so are the tank counts; the rates are the ones used in the model.
- Flow. 100,000 m³/day is 4,167 m³/h, or 1.16 m³/s.
- Settling basin. With an overflow rate of 1.5 m/h the total surface area is 4,167 ÷ 1.5 = 2,778 m². At 3.5 m deep that is 9,722 m³, and the water stays 9,722 ÷ 4,167 = 2.3 hours, the figure shown in the exhibit. In practice this area is split into several basins, so one can be emptied for cleaning.
- What if the flow doubles? On a storm day a plant may have to push twice the water through the same basins. The overflow rate becomes 3.0 m/h. The 25 mg/L flocs sink at 1.76 m/h, so the ideal-basin rule says only 1.76 ÷ 3.0 = 59 % of them are caught, and the water stays 1.2 hours instead of 2.3. The filters then take a much heavier load of flocs, which is why operators cut flow or raise the dose when the river turns muddy.
- Coagulant. 25 mg/L is 25 g per m³, so 100,000 m³ takes 2,500 kg of product a day, a little over 100 kg every hour. The best dose is found with a jar test and changes with every storm, so the pump rate is adjusted often.
- Filters. At the minimum rapid-filtration rate of 5 m/h the filter area is 4,167 ÷ 5 = 833 m². A plant cannot wash all cells at once. With 12 cells of 70 m² each, one cell is always out for backwashing in the worst case, leaving 11 × 70 = 770 m², and the rate on the others rises to 4,167 ÷ 770 = 5.4 m/h.
- Clearwell. If baffling gives T10 = 30 minutes and the baffles are good enough that T10 is half the mean residence time (assumed), the tank must hold 60 minutes of flow, 4,167 m³. A tank with no baffles would have a T10 far below its mean time, and would need to be much bigger for the same CT.
- Chlorine. A dose of 1.0 mg/L is 1.0 g per m³, so 100 kg of chlorine a day, of which the 0.3 mg/L chlorine demand uses 30 kg at once.
The last line is the one people forget when they see CT = 21 mg·min/L. The CT depends on temperature. In its profiling guidance, the US EPA lists a CT of 127.9 min·mg/L for 3-log inactivation of Giardia at 6 °C, pH 6.7 and 1.0 mg/L of chlorine. Run the same clearwell in a winter river and the 21 mg·min/L of this example would be about 16 % of what that table asks. In cold weather the plant has to raise the residual, lengthen the contact time, or use another barrier.
Chlorine, ozone, UV and membranes compared
Each barrier is good at something and weak at something else, which is why a surface water plant stacks several of them.
| Barrier | Strong against | Weak or limited | What it leaves behind |
|---|---|---|---|
| Free chlorine | Bacteria, most viruses; keeps a residual in the pipes | Not effective against Cryptosporidium oocysts (WHO); depends on turbidity, pH, temperature | Chlorine residual; disinfection by-products such as trihalomethanes |
| Ozone | Strong oxidant: taste and odour compounds, many microbes | Leaves no residual to protect the water in the pipes | No lasting residual |
| Ultraviolet light | Cryptosporidium and Giardia at low doses | Viruses need a much higher dose; the water must be clear enough for light to pass | No residual |
| Membrane filtration | Physical barrier for particles and protozoa; turbidity below 0.1 NTU in WHO's table | Fouling, energy, and cost; does not remove dissolved chemicals unless it is nanofiltration or reverse osmosis | None |
The UV numbers show the pattern. The EPA's UV dose table gives 12 mJ/cm² for 3-log (99.9 %) inactivation of Cryptosporidium and 11 mJ/cm² for Giardia, but 143 mJ/cm² for 3-log inactivation of viruses, almost twelve times as much. A dose in mJ/cm² is the lamp intensity in mW/cm² times the seconds of exposure, so a reactor giving 2 mW/cm² for 6 seconds delivers 12 mJ/cm². That is why the EPA's UV toolkit says a plant can use UV for the protozoa and chlorine for the viruses, with the chlorine added downstream of the UV.
Disinfectants also react with the organic matter in the water to make by-products. The EPA limits total trihalomethanes to 0.080 mg/L and five haloacetic acids to 0.060 mg/L, and sets a maximum residual of 4.0 mg/L for chlorine and for chloramines. The by-product limits are one reason plants remove organic matter with coagulation and carbon before they add chlorine, rather than simply adding more.
Four real cases
Soho, London, 1854. In September 1854 about 600 people died of cholera in a week around Broad Street. The dominant belief was that cholera travelled in foul air. John Snow mapped the cases and argued that water from the Broad Street pump carried the disease; the pump handle was removed, and the epidemic ended, though it was already declining as people left the area. Snow also compared houses supplied by two water companies, one drawing from a sewage-polluted stretch of the Thames and one from further upstream. The case is taught because it shows that the question "where did this water come from?" can be answered with a map and a count, at a time when germ theory was still an unproven minority view.
Jersey City, 1908. Filtration of the early 1900s cut turbidity, but the EPA's history of drinking water treatment says that disinfectants such as chlorine did the most to reduce waterborne disease outbreaks in those years. Jersey City, New Jersey, used chlorine as a primary disinfectant for the first time in 1908. That is the practice behind the chlorine dose slider.
Flint, Michigan, 2014 to 2015. In April 2014 the city changed its source to the Flint River, and a plant that had not been fully operating for almost 50 years had to treat it. A peer-reviewed review of the crisis notes that the utility had no corrosion-control plan, and that enough pilot testing and corrosion study had not been done before the switch. In 2015, Marc Edwards and colleagues sampled 120 homes: 20 % were over the 15 µg/L lead action level, and the 90th percentile was 30 µg/L. The water was treated like any other river water. What was missing was corrosion control, the chemistry that keeps old lead pipes from shedding lead into the water. The city went back to its earlier supplier on 16 October 2015. The exhibit stops at the tap, but this case shows that a plant's job continues in the pipes.
Korean cities, advanced treatment. The Incheon Waterworks Headquarters says it began converting its plants to advanced treatment (ozone oxidation plus granular activated carbon) with the Bupyeong plant in 2016, finished the Gongchon plant in 2021, and plans to finish the Susan plant by 2026. It also notes that the Ministry of Environment added chironomid (midge) larvae to the drinking water monitoring items in October 2023, because activated carbon beds that are poorly maintained can be colonised by them. Advanced treatment fixes the taste and odour problem and brings its own maintenance work.
Water quality numbers from three sources
The three sets of numbers are written for different purposes. The WHO publishes guideline values for governments to adapt. The EPA writes legal limits (MCL) and treatment techniques (TT). Korea writes limits into ordinances. They are not always the same quantity, so compare them with care.
| Item | Korea | US EPA | WHO |
|---|---|---|---|
| Turbidity at the tap | 0.5 NTU | No tap limit; filtered water at most 1 NTU, and 0.3 NTU or less in 95 % of samples for conventional filtration (TT) | Keep below 1 NTU for effective disinfection |
| Free chlorine residual | 0.1 mg/L or more at the tap; 4.0 mg/L maximum | 4.0 mg/L maximum as Cl₂ (MRDL) | 0.2 to 0.5 mg/L recommended for centrally treated water at delivery |
| Lead | Set in the Rules (not tabulated here) | Goal zero; action level 0.015 mg/L | 0.01 mg/L |
| Total trihalomethanes | Set in the Rules (not tabulated here) | 0.080 mg/L | Guideline values per compound |
| Giardia and viruses | Inactivation ratio of 1 or more | 99.9 % and 99.99 % removal or inactivation | Health-based targets by log reduction |
The model charts only the turbidity and chlorine rows, because those are the quantities that the three sliders change.
Common misunderstandings
- "More coagulant always clears more water." The jar-test curve says otherwise. In the model, 60 mg/L gives flocs of 72 µm that sink at 0.95 m/h and leave 0.80 NTU after the filters, worse than 25 mg/L at 0.050 NTU.
- "Clear water is safe water." Turbidity measures how much light particles scatter. A glass can be crystal clear and still hold dissolved lead or microbes too small to scatter much light. This is why the chart shows bacteria and turbidity as separate lines, and why the Flint samples were measured for lead, not clarity.
- "A filter is a fine sieve." The pores are far larger than most of the particles it removes. The grains catch them by contact deep in the bed, which is why a filter works better after coagulation.
- "Chlorine kills everything." WHO notes that chlorine is not effective against Cryptosporidium oocysts. Plants rely on filtration, and sometimes UV or ozone, for those.
- "The water is fine once it leaves the plant." The residual at the tap, 0.27 mg/L in the model's default, is there because the pipes are also part of the system.
Try it on the screen
- Set the Coagulant dose to 0. The microscope shows separate grains, and the chart ends at about 5.0 NTU after the filters, the 0.5 NTU limit missed by a factor of ten.
- Raise the dose slowly until the number after the filters first falls under 0.3 NTU. The table above says it must happen between 10 and 25 mg/L.
- Push the dose to 60. The flocs shrink to 72 µm and the result gets worse. Return to 25.
- With the dose at 25, move Clay grain size down to 0.5 µm. The basin catches only 7 % of the turbidity.
- Switch off Ozone and carbon and watch the water take the bypass pipe. Switch it on again.
- Turn on Backwash and look at the right-hand cell while the troughs fill.
- Set the Chlorine dose to 0.5 mg/L and follow the last point of the bacteria chart. At 0.6 mg/L it just passes, at 0.5 mg/L it fails.
- Turn on See inside at the clearwell and follow the baffles with The drop. Use Part names if you lose track.
- Press Floc in the stage bar, set the dose to 0, then back to 25, and watch the grains gather into flocs. Then move pH to 6 and to 8.5.
- Set River turbidity to 300 NTU and press Settle. Raise the dose until the readout is back within the limits, then try Filter rate at 8 m/h.
- In Filter, leave the stage running and watch Filter load climb. Backwash before it reaches 100 %.
- In Disinfect, set pH to 8.5: the green dots give way to pale blue ones and fewer viruses turn grey. Then turn on UV light and watch the orange oocysts.
- Under Try it yourself, start the challenges; the badge on the stage counts the solved ones. My water turns your daily water use into seconds of plant time.
Questions
Why is tap water treated with chlorine if it has already been filtered?
Filtration removes most microbes along with the particles, but not all of them, and it gives no protection once the water leaves the plant. Chlorine kills what got through and leaves a residual that guards the water in the pipes. Korean rules ask for at least 0.1 mg/L of free chlorine at the tap.
What does NTU mean, and is 0.5 NTU clean?
NTU stands for nephelometric turbidity unit. An instrument shines light through the sample and measures how much is scattered to the side by particles. Water at 0.5 NTU looks completely clear; a haze becomes visible in a glass at around 4 to 5 NTU. Korean tap water must not exceed 0.5 NTU.
What is a coagulant, and is it left in the water?
A coagulant is a salt of aluminium or iron, such as polyaluminium chloride, that cancels the charge on fine particles so they stick together. Almost all of it ends up in the flocs, which settle out or are caught by the filters and leave the plant as sludge. Korean drinking water standards also set a limit for aluminium.
What is Stokes's law?
It gives the steady speed of a small sphere sinking slowly through a fluid: v = gΔρd²/(18μ). Speed rises with the square of the diameter, so doubling the size makes a particle sink four times faster. It holds when the flow around the particle is slow and smooth, roughly when the Reynolds number is below 1.
Why does the filter need backwashing?
As particles stick inside the bed, the gaps fill and the water has more and more trouble getting through, and eventually particles start to break loose into the filtered water. Pushing clean water upward through the bed expands it and scrubs the grains, and the dirt is carried off to the wash-water troughs.
What is CT?
CT is the residual disinfectant concentration in mg/L multiplied by the contact time in minutes. The same CT can be reached with more chlorine for less time or less chlorine for longer. Tables published by regulators give the CT needed for a given kill at a given temperature and pH.
What do ozone and activated carbon add?
Ozone oxidises taste and odour compounds and helps disinfect; activated carbon adsorbs organic compounds that are left, including some that would otherwise react with chlorine. Together they mainly improve taste and smell and reduce disinfection by-products.
Can ultraviolet light replace chlorine?
Not on its own for most plants. UV inactivates Cryptosporidium and Giardia at low doses (12 and 11 mJ/cm² for 3-log in the EPA's table), but viruses need about 143 mJ/cm², and UV leaves no residual in the pipes. Plants that use UV for the protozoa usually keep a small chlorine or chloramine dose downstream.
Why did Flint's water carry lead if a treatment plant was working?
Lead came from the old service lines and plumbing, not from the river. When the source changed in April 2014 the utility had no corrosion-control plan, so the water was able to take lead off the pipe walls. A plant can deliver clear, disinfected water and still deliver lead if the water chemistry attacks the pipes.
Why is a bigger coagulant dose not better?
Past the best dose, the grains take on a positive charge and repel each other again, and the flocs that form are smaller. In the model, 60 mg/L gives 72 µm flocs and 0.80 NTU after the filters, against 120 µm and 0.050 NTU at 25 mg/L.
Why does pH change how well chlorine works?
Free chlorine in water is split between hypochlorous acid (HOCl) and the hypochlorite ion (OCl⁻), with half of each at about pH 7.5. HOCl is much the stronger disinfectant, so the same dose works faster in slightly acidic or neutral water than in alkaline water. In the model the virus kill at 0.8 mg/L falls from 6 logs or more at pH 7 to about 1.3 at pH 8.5.
Why does Cryptosporidium get a challenge of its own?
Its oocysts have a tough wall that normal chlorine doses hardly affect. Plants rely on good coagulation and filtration to remove them and on UV to inactivate the ones that remain. The 1993 Milwaukee outbreak, which made an estimated 403,000 people ill, happened while one plant's filtered-water turbidity was rising.
What did John Snow prove in 1854?
He showed by mapping cases and comparing houses served by two water companies that cholera followed the water supply rather than foul air. He did not identify the bacterium, and the epidemic in Soho was already declining when the pump handle was removed. The case is remembered for the method more than for the handle.
Terms
- Turbidity: cloudiness of water caused by suspended particles, measured in NTU.
- Coagulation: neutralising the charge on fine particles with a chemical so they can stick together.
- Flocculation: gentle stirring that lets destabilised particles collide and grow into flocs.
- Floc: a loose cluster of particles and coagulant, large enough to settle.
- Overflow rate: flow through a settling basin divided by its surface area; particles sinking faster than this are fully caught.
- Rapid filtration: filtering coagulated and settled water through sand and anthracite at 120 m per day or more.
- Backwashing: cleaning a filter by pushing water (and often air) up through the bed.
- CT: disinfectant concentration times contact time, in mg·min/L.
- T10: the time in which 10 % of the water has passed through a tank, used as the contact time.
- Free residual chlorine: chlorine left in the water as hypochlorous acid and hypochlorite, able to kill microbes.
- Log removal: removal expressed as a power of ten; 2 log is 99 %, 3 log is 99.9 %.
Sources
- Korean Law Information Center, Rules on Drinking Water Quality Standards and Inspection (먹는물 수질기준 및 검사 등에 관한 규칙), Annex 1 (turbidity 0.5 NTU for tap water, 100 CFU/mL bacteria, free chlorine 4.0 mg/L). Ministry of Environment ordinance. https://www.law.go.kr/%EB%B2%95%EB%A0%B9/%EB%A8%B9%EB%8A%94%EB%AC%BC%EC%88%98%EC%A7%88%EA%B8%B0%EC%A4%80%EB%B0%8F%EA%B2%80%EC%82%AC%EB%93%B1%EC%97%90%EA%B4%80%ED%95%9C%EA%B7%9C%EC%B9%99 (checked 16 October 2026)
- Korean Law Information Center, Enforcement Rule of the Water Supply and Waterworks Installation Act (수도법 시행규칙), Article 22-2 (0.1 mg/L free chlorine at the tap) and Annex 5-3 (filtered water 0.3 NTU in 95 % of samples, 1 NTU maximum, inactivation ratio of 1 or more). https://www.law.go.kr/%EB%B2%95%EB%A0%B9/%EC%88%98%EB%8F%84%EB%B2%95%EC%8B%9C%ED%96%89%EA%B7%9C%EC%B9%99 (checked 16 October 2026)
- Korean Law Information Center, Regulation on Water Treatment Standards (정수처리기준 등에 관한 규정), Ministry of Environment notice (definitions of rapid filtration and inactivation ratio). https://www.law.go.kr/LSW/admRulLsInfoP.do?admRulSeq=2000000016601 (checked 16 October 2026)
- US Environmental Protection Agency, Surface Water Treatment Rules. https://www.epa.gov/dwreginfo/surface-water-treatment-rules (checked 16 October 2026)
- US Environmental Protection Agency, Surface Water Treatment Rule fact sheet (3-log Giardia, 4-log virus, CT). https://www.epa.gov/sites/default/files/documents/SWTR_Fact_Sheet.pdf (checked 16 October 2026)
- World Health Organization, Guidelines for drinking-water quality, fourth edition incorporating the first and second addenda. https://iris.who.int/handle/10665/352532 (checked 16 October 2026)
- World Health Organization, Drinking-water fact sheet. https://www.who.int/news-room/fact-sheets/detail/drinking-water (checked 16 October 2026)
- US Environmental Protection Agency, Development of Bench-Scale Settling Apparatus: Settling Velocity Data for Design and Operation of Wet-Weather Flow Solids-Liquid Separation Processes, interim report, NEPIS (Stokes' law, vs = g(ρs − ρ)d²/(18μ); the document text loads in the NEPIS viewer). https://nepis.epa.gov/Exe/ZyPURL.cgi?Dockey=P1000P9E.TXT (checked 17 October 2026)
- Environmental Protection Agency (Ireland), Water Treatment Manual: Filtration, 2020 (rapid gravity filters with anthracite over sand on graded gravel and nozzle underdrains; backwash with air scour followed by water). https://www.epa.ie/publications/compliance--enforcement/drinking-water/advice--guidance/EPA-Water-Filtration-Manual.pdf (checked 17 October 2026)
- Tulchinsky TH, John Snow, Cholera, the Broad Street Pump; Waterborne Diseases Then and Now, in Case Studies in Public Health, Academic Press, 2018 (about 600 deaths in a week in September 1854; the epidemic was already declining when the handle was removed). https://pmc.ncbi.nlm.nih.gov/articles/PMC7150208 (checked 22 October 2026)
- Flint Water Crisis: What Happened and Why?, peer-reviewed review on PubMed Central (April 2014 source switch, no corrosion-control plan, 120 samples with 20 % over 15 µg/L and a 90th percentile of 30 µg/L, switch back on 16 October 2015). https://pmc.ncbi.nlm.nih.gov/articles/PMC5353852 (checked 22 October 2026)
- US Environmental Protection Agency, The History of Drinking Water Treatment, EPA-816-F-00-006, February 2000 (chlorine as primary disinfectant in Jersey City in 1908). https://archive.epa.gov/water/archive/web/pdf/2001_11_15_consumer_hist.pdf (checked 22 October 2026)
- US Environmental Protection Agency, National Primary Drinking Water Regulations (lead action level 0.015 mg/L, chlorine and chloramine MRDL 4.0 mg/L, TTHM 0.080 mg/L, HAA5 0.060 mg/L, turbidity 0.3 NTU in 95 % of samples and never above 1 NTU). https://www.epa.gov/ground-water-and-drinking-water/national-primary-drinking-water-regulations (checked 22 October 2026)
- US Environmental Protection Agency, Disinfection Profiling and Benchmarking: Technical Guidance (CT of 127.9 min·mg/L at 6 °C, pH 6.7 and 1.0 mg/L chlorine; Table B-9 UV doses for Cryptosporidium, Giardia and virus). https://www.epa.gov/system/files/documents/2022-02/disprof_bench_3rules_final_508.pdf (checked 22 October 2026)
- US Environmental Protection Agency, Ultraviolet (UV) Treatment Toolkit, EPA 815-B-21-007, May 2022 (UV for protozoa, chlorine downstream for viruses). https://www.epa.gov/system/files/documents/2022-05/uv-toolkit-815-B-21-007_0.pdf (checked 22 October 2026)
- US Environmental Protection Agency, Stage 1 and Stage 2 Disinfectants and Disinfection Byproducts Rules (by-products form when disinfectants meet natural organic matter). https://www.epa.gov/dwreginfo/stage-1-and-stage-2-disinfectants-and-disinfection-byproducts-rules (checked 22 October 2026)
- World Health Organization, Guidelines for Drinking-water Quality, fourth edition incorporating the first addendum, 2017 (chlorine not effective against Cryptosporidium oocysts; turbidity below 1 NTU for effective disinfection; 0.2 to 0.5 mg/L residual at delivery; filtration and membrane tables). https://www.who.int/docs/default-source/food-safety/arsenic/9789241549950-eng.pdf (checked 22 October 2026)
- World Health Organization, Guidelines for drinking-water quality, Table 8.17, guideline values for chemicals from pipes and fittings (lead 0.01 mg/L), NCBI Bookshelf. https://www.ncbi.nlm.nih.gov/books/NBK579467/table/ch8.tab17 (checked 22 October 2026)
- Incheon Metropolitan City, Waterworks Headquarters, press release 27 November 2024 (conversion to advanced treatment from 2016, 2021 and 2026; chironomid larvae added to monitoring items in October 2023). https://www.incheon.go.kr/IC010205/view?repSeq=DOM_0000000011255884&curPage=112 (checked 22 October 2026)
- Seoul Arisu Headquarters, Water supply statistics (capacity 4.8 million m³ a day, 3,084,211 m³ a day and 307 litres per person supplied in 2025, household price 600.5 won per m³ in 2025, distribution main pressure 1.5 to 4.0 kg/cm²). https://arisu.seoul.go.kr/home/sub?menukey=7324 (checked 27 October 2026)
- Seoul Arisu Headquarters, Water Supply Museum (Ttukdo plant finished in August 1908, slow-sand-filtered water from 1 September 1908, 12,500 m³ for 125,000 people). https://arisu.seoul.go.kr/home/sub?menukey=7507 (checked 27 October 2026)
- Environmental Protection Agency (Ireland), Water Treatment Manuals: Coagulation, Flocculation and Clarification (the jar test as probably the most important routine test, its use when rain changes the raw water). https://www.epa.ie/publications/compliance--enforcement/drinking-water/advice--guidance/EPA_water_treatment_mgt_coag_flocc_clar2.pdf (checked 27 October 2026)
- Hall EL, Dietrich AM, A Brief History of Drinking Water, Rhode Island Water Resources Board (Paisley 1804, Louisville coagulation with rapid sand filtration in the mid-1890s, ozone in Nice in 1906). https://wrb.ri.gov/data_education/Education_Drinking_Water_History.pdf (checked 27 October 2026)
- Institution of Civil Engineers, London's water supply and the introduction of sand filtration (James Simpson's one-acre filter at Chelsea by 1829). https://www.ice.org.uk/what-is-civil-engineering/infrastructure-projects/london-s-water-supply-and-the-introduction-of-sand-filtration (checked 27 October 2026)
- Lebout H, Fifty Years of Ozonation at Nice, Advances in Chemistry 21, 1959. https://doi.org/10.1021/ba-1959-0021.ch059 (checked 27 October 2026)
- Town of Boonton, Boonton 1890 to 1910 (chlorination plant at the Boonton Reservoir on line on 26 September 1908, about 40 million gallons a day). https://www.boonton.org/237/Boonton-1890---1910 (checked 27 October 2026)
- Mac Kenzie WR et al., A massive outbreak in Milwaukee of Cryptosporidium infection transmitted through the public water supply, New England Journal of Medicine 331, 1994. https://doi.org/10.1056/NEJM199407213310304 (checked 27 October 2026)
- New York City Department of Environmental Protection, press release 13-104, 8 October 2013 (Catskill/Delaware UV facility, 56 units, 11,760 lamps, more than 2 billion gallons a day). https://www.nyc.gov/html/dep/html/press_releases/13-104pr.shtml (checked 27 October 2026)
- du Pisani PL, Direct reclamation of potable water at Windhoek's Goreangab reclamation plant, Desalination 188, 2006. https://www.sciencedirect.com/science/article/pii/S0011916406000269 (checked 27 October 2026)
- PUB, Singapore's National Water Agency, NEWater (microfiltration or ultrafiltration, reverse osmosis, UV). https://www.pub.gov.sg/Public/WaterLoop/OurWaterStory/NEWater (checked 27 October 2026)
- World Health Organization, Safe drinking-water from desalination, 2011. https://www.who.int/publications/i/item/WHO-HSE-WSH-11.03 (checked 27 October 2026)
- World Health Organization, Boil water, technical brief, 2015. https://www.who.int/publications/i/item/WHO-FWC-WSH-15.02 (checked 27 October 2026)
- Eawag, SODIS: how to apply the method (at least 6 hours in full sunlight). https://www.sodis.ch/methode/anwendung/index_EN.html (checked 27 October 2026)
- US Environmental Protection Agency, Chloramines in drinking water (used by utilities since the 1930s, longer-lasting disinfection in the pipes). https://www.epa.gov/dwreginfo/chloramines-drinking-water (checked 27 October 2026)
- Model values added in this version (best dose exponent 0.45, pH window width 1.5, filter rate 5 m/h, filter load and break-through rates, ozone and UV log values, 100,000 m³ a day plant, smell threshold 1.0 mg/L) are listed under What the model leaves out and were worked through by hand.
- Model values (10 NTU and 1,000 CFU/mL raw water, best dose 25 mg/L, floc fractal dimension 2.2, overflow rate 1.5 m/h, basin depth 3.5 m, T10 30 minutes, chlorine demand 0.3 mg/L, decay 4 % per hour) were worked through by hand.
Course 8 of 8
Buildings and the cityMore exhibits
What is under the street
Korean road rules put a water main at least 1.2 metres under the road and a main sewer at least 3 metres down, so four kinds of pipe and cable all lie within the top 2 metres.
How tides work
The Moon raises the sea on the side of the Earth facing it, so why is there a second high tide on the side facing away?
Why do ships float?
A 1,900-tonne steel ship floats, yet the same 1,900 tonnes of steel pressed into a cube goes straight to the bottom.
Swim to the bottom of the Mariana Trench in a 3D ocean
By 20 m down, almost all the red in sunlight has gone, and the Challenger Deep is another 10,900 m below that.
Coral bleaching causes: why warmer water turns reefs white
Corals get most of their food from algae living in their tissue, and when the sea stays more than 1 °C above its usual summer high for weeks, they lose those algae and turn white.

Snowflake growth simulator: grow your own crystal
A snow crystal grown at −15 °C sprouts six branching arms, while one grown at −5 °C becomes a needle 2 mm long.
Giants of the sea: megalodon and the blue whale
Swim beside 48 sea giants at their real size, from a 28 m blue whale to megalodon, Livyatan and Mosasaurus, in eight seas from today back to the Triassic.

How a QR code is read
Cover 30 % of a QR code with your hand and a phone still reads it. Cover one corner and it does not.
How a 3D printer works, layer by layer
A 20 mm cube printed in 0.2 mm layers is exactly 100 layers, each drawn by a nozzle 0.4 mm wide.
Walk down the Grand Canyon rock layers
Walk 1,360 m down the Bright Angel Trail through 13 rock layers, from a 270-million-year-old sea floor on the rim to 1.75-billion-year-old schist by the river.
How lightning and thunder work
A lightning channel heats the air to about five times the temperature of the Sun’s surface, and its thunder needs about 3 seconds to cover each kilometre to you.

How a steam locomotive works
Mallard's driving wheels are 2.03 m across, taller than most people, and at its record 126 mph they turned almost nine times a second.