FIG. 69How It Works
How photosynthesis works
A leaf in full sun pulls carbon dioxide out of air that holds only about 426 parts per million of it, and builds sugar from it.
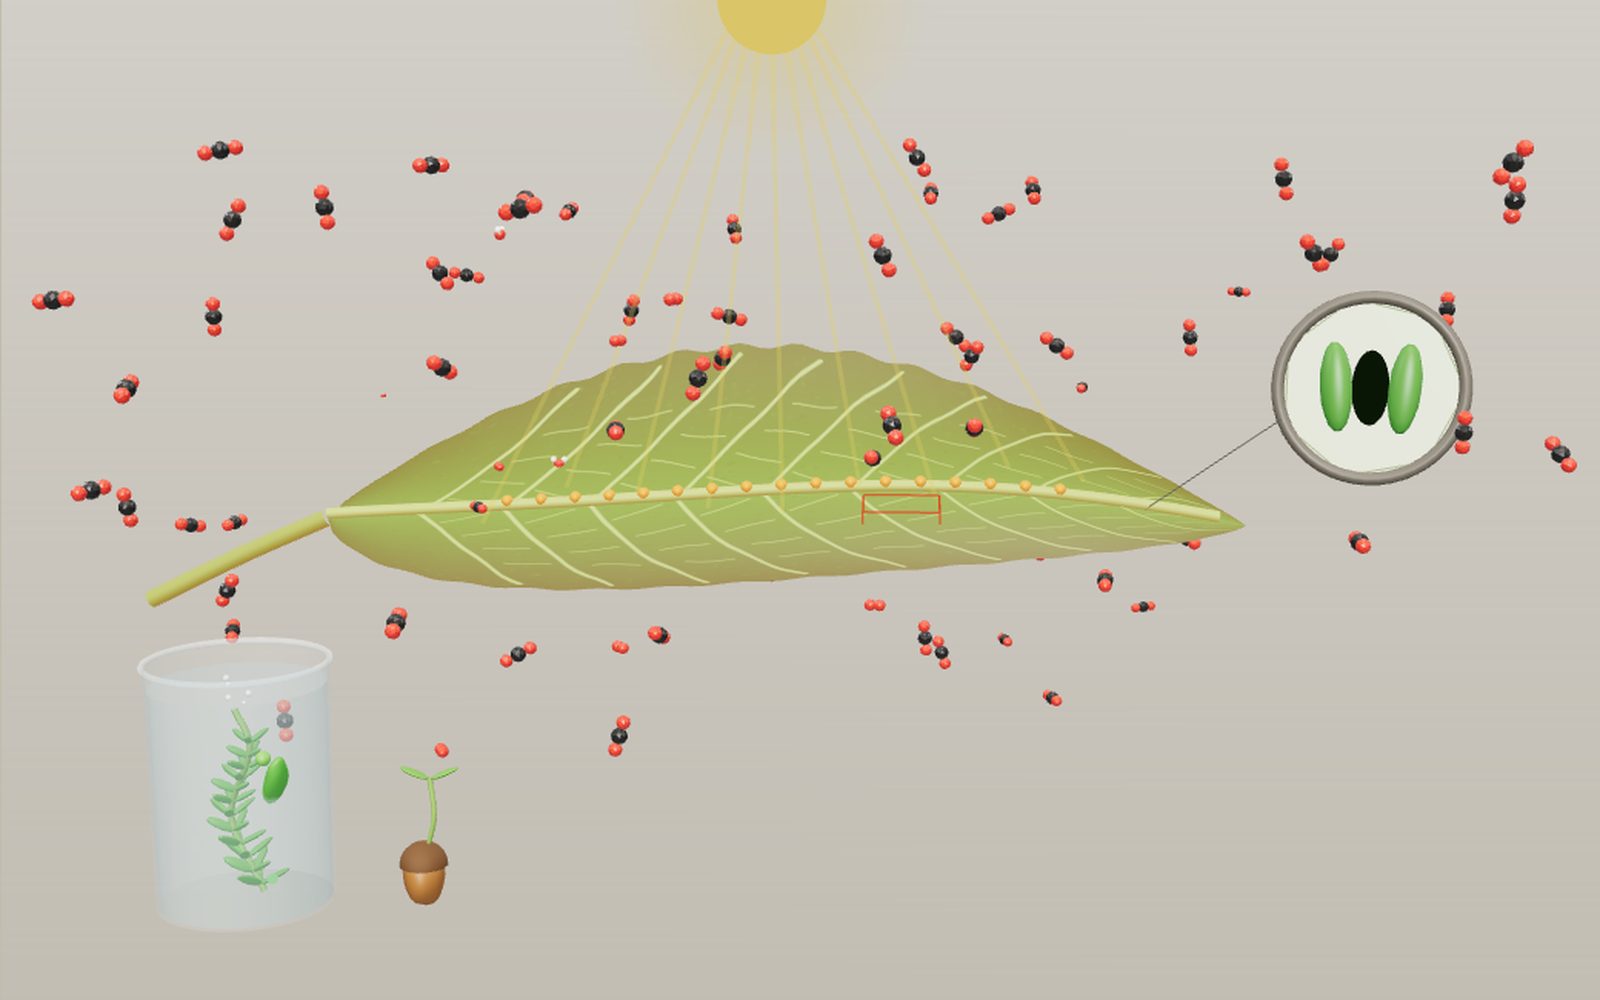
This device cannot show the 3D model. You can read the guide steps below as text.
1 / 8 A leaf in sunlightThis leaf is the starting point. Drag the sun to tilt the light, and watch the air: CO₂ molecules drift in, O₂ leaves, and the pondweed in the beaker bubbles. The red box marks the block we cut out next.
Drag to turn. Scroll or pinch to zoom.
Where does the wood of a tree come from?
A seed weighs less than a gram, and the oak that grows from it can weigh many tonnes. Most of that mass did not come out of the soil. It came out of the air, as carbon dioxide, and it was turned into sugar inside green leaves using the energy of light. The same process makes the oxygen we breathe. OpenStax's biology textbook puts the reach of it plainly: photosynthesis powers 99 percent of Earth's ecosystems.
The overall reaction fits on one line: six molecules of carbon dioxide and six of water become one sugar and six molecules of oxygen. That line hides a long chain of steps, spread across sizes from a whole leaf down to single proteins a few billionths of a metre across. This exhibit walks down that chain. It starts with a leaf, cuts a block out of it, opens one chloroplast and then stands on a patch of thylakoid membrane where light is turned into chemical energy. Three sliders change the light, the carbon dioxide and the temperature, and a curve in the corner shows how the rate responds.
A leaf is built to catch light and let air in
A leaf has two jobs that pull against each other. It has to spread green cells out to the light, and it has to let air reach those cells, while losing as little water as possible. Its layers sort out that problem.
The top is covered by a waxy cuticle, which slows water loss, and under it is the epidermis, usually one layer of clear cells. Below that stand the palisade cells, tall columns packed side by side. OpenStax's chapter on leaves describes them as column-shaped, tightly packed cells in one to three layers, and they hold most of the leaf's chloroplasts. In the model each column is drawn see-through so the chloroplasts inside show as dark green beads.
Under the palisade layer the cells change. The spongy mesophyll is made of loose, irregular cells with air between them. Those air spaces are the leaf's lungs: gas that comes in through the underside spreads through them to every cell. A vein runs through the middle of the block, with xylem bringing water up from the roots and phloem carrying sugar away.
Stomata trade water for carbon dioxide
The underside of the leaf is dotted with stomata, small pores each held between two guard cells. When the guard cells fill with water and swell, they bow apart and the pore opens. When they go limp, it closes. Guard cells are the only cells of the epidermis that have chloroplasts.
An open pore is a bargain with a cost. Carbon dioxide can only get in if the pore is open, but water vapour gets out the same way, because the air inside a leaf is nearly saturated and the air outside usually is not. According to OpenStax, up to 90 percent of the water a plant takes up through its roots may be lost this way, as transpiration. Guard cells respond to light, to the leaf's water status and to carbon dioxide, so a plant can shut its stomata on a hot, dry afternoon and accept less photosynthesis in return for keeping its water.
In the model, the Stomata slider moves the guard cells. Dark grey and red molecules of CO₂ drift in through the pores, and blue and white water molecules drift out. Close the pores and both flows fall to zero. The Water loss figure rises with the opening and with temperature, because warm air can hold more water and so dries the leaf faster.
Inside a chloroplast
Each green bead in a palisade cell is a chloroplast. It has a double envelope around a watery interior called the stroma. Floating in the stroma is a third set of membranes, the thylakoids, flattened sacs that stack into piles called grana and are joined by single sheets. The space inside each sac is the lumen.
That arrangement splits the work in two. The light reactions happen in the thylakoid membranes and make two energy carriers, ATP and NADPH. The Calvin cycle happens in the stroma and uses them to build sugar from carbon dioxide. The last scale in the exhibit shows both at once: the membrane runs across the middle, with the stroma above it and the lumen below.
Photosystem II takes electrons from water
Light arrives as photons. Chlorophyll absorbs red and blue light well and reflects green, which is why leaves look green. Plants use wavelengths from about 400 to 700 nm, which plant physiologists call photosynthetically active radiation.
The photons are caught by antenna complexes. OpenStax gives each light-harvesting complex 300 to 400 chlorophyll molecules, plus carotenoids. The energy of an absorbed photon is passed from pigment to pigment until, after about a millionth of a second, it reaches a reaction centre. In photosystem II that centre is a pair of chlorophylls called P680, and the energy pushes one of its electrons out to an acceptor.
P680 now needs an electron back, and it gets one from water. On the lumen side of photosystem II sits a cluster of four manganese atoms, one calcium atom and five oxygen atoms. Umena and colleagues mapped it at 1.9 Å resolution in 2011 and found four water molecules bound to it. The cluster takes electrons from water one at a time. Splitting two water molecules gives four electrons, four protons and one molecule of O₂. OpenStax notes that about 10 percent of that oxygen is used by the leaf's own mitochondria, and the rest escapes to the air.
In the model, yellow streaks are photons and cyan beads are electrons. Each time four electrons leave photosystem II, an O₂ molecule floats away from the cluster and the O₂ counter goes up by one.
From plastoquinone to NADPH
The electron does not stay put. It is handed to plastoquinone (yellow beads), a small molecule that moves inside the membrane to the cytochrome b6f complex. As electrons pass through b6f, it moves protons from the stroma into the lumen. On the far side, plastocyanin (a blue copper protein) picks the electron up and carries it along the lumen surface to photosystem I.
By now the electron has lost much of its energy, so photosystem I needs a second photon. Its reaction centre, P700, lifts the electron again and passes it to ferredoxin on the stroma side. The enzyme ferredoxin-NADP⁺ reductase (FNR) then puts two electrons onto NADP⁺, making NADPH. In the model a purple NADPH molecule leaves FNR every second electron and heads for the Calvin cycle.
The proton gradient runs ATP synthase
Two things have filled the lumen with protons: the water splitting at photosystem II and the pumping at b6f. The lumen becomes acidic and the stroma less so, and the protons can only flow back through one door. That door is ATP synthase, the same rotary machine shown in the ATP synthase exhibit, sitting with its head on the stroma side.
Seelert and colleagues imaged the chloroplast version by atomic force microscopy in 2000 and found that its rotor ring has 14 subunits. Each proton that crosses moves the ring one subunit, so 14 protons turn it once, and one turn releases 3 ATP from the head. That is 14 ÷ 3 ≈ 4.67 protons per ATP. The red beads in the lumen grow more numerous as the light reactions speed up, and you can watch them file through the ring.
Rubisco and the Calvin cycle
The stroma holds the enzyme that does the actual fixing: ribulose-1,5-bisphosphate carboxylase/oxygenase, usually shortened to Rubisco. It joins one CO₂ to a five-carbon sugar called RuBP. The six-carbon result splits at once into two molecules of 3-PGA, which has three carbons. OpenStax divides the cycle into fixation, reduction and regeneration.
In reduction, ATP and NADPH turn 3-PGA into G3P, a three-carbon sugar phosphate. In regeneration, most of the G3P is rearranged back into RuBP so the cycle can keep going, which costs more ATP. Because only one carbon is added per turn, it takes three turns to gain one spare G3P to export. Over those three turns the cycle uses 9 ATP and 6 NADPH. Six turns' worth make one glucose.
The loop in the model is drawn clockwise with Rubisco at the top. Beads change colour as they go round: blue for 3-PGA, orange for G3P, green for RuBP. A CO₂ molecule arrives at Rubisco each time a bead passes it, ATP and NADPH fly in from the membrane below, and every third fixation sends one hexagon of sugar off to the right.
Checking the numbers
The bookkeeping in the exhibit is tied together by one number, the CO₂ fixed per second on screen. Everything else follows from the sources.
- Per CO₂ fixed the Calvin cycle uses 9 ÷ 3 = 3 ATP and 6 ÷ 3 = 2 NADPH.
- Each NADPH carries 2 electrons, so 2 NADPH need 4 electrons. Four electrons come from splitting two waters, which releases one O₂. So one O₂ leaves for every CO₂ fixed, as the overall equation says.
- Each electron passes through both photosystems, one photon at each. Four electrons therefore need 8 photons per O₂ in this simple linear scheme.
- 3 ATP per CO₂ at 14 protons per 3 ATP means 14 protons through ATP synthase for every CO₂.
You can check this against the counters. After a while, ATP made is close to three times CO₂ fixed, NADPH made close to twice, and O₂ out close to equal. They drift by one or two because each counter ticks at a different moment in the animation.
The rate curve is a model, not a measured leaf. The light response is a non-rectangular hyperbola, a standard textbook shape. The gross rate P solves θP² − (αI + Pc)P + αIPc = 0, where I is the light, α = 0.11 is the starting slope, θ = 0.8 sets how sharp the bend is, and Pc is a ceiling set by carbon dioxide and temperature. The ceiling rises with CO₂ as 100 × (C − 50) ÷ (C − 50 + 300), and it is multiplied by a lopsided bell curve with its peak at 25 °C. Respiration, 3 units at 25 °C and doubling every 10 °C, is subtracted to give the net rate. Rates are in model units on a scale where 100 is the ceiling.
Worked through, the model gives these values. At the model default of 426 ppm and 25 °C, the net rate is −3 in the dark (the leaf only respires), 16.8 at a light of 200, and 49.4 at 2000. The curve reaches 90 percent of its ceiling at a light of about 1274. Raise the CO₂ to 1000 ppm and the top of the curve climbs to 62.8, while the 90 percent point moves out to about 1636. The best temperature in the model is 24.5 °C. The 426 ppm default comes from NOAA's Mauna Loa record, which gives a monthly mean of 426.07 ppm for September 2026.
Why light, carbon dioxide and temperature each set a limit
The curve has two parts. In dim light it climbs in a nearly straight line: every extra photon is used, and nothing else is in short supply. In bright light it flattens, because the Calvin cycle cannot keep up. Rubisco is slow and needs carbon dioxide, and more light will not give it more. The readout names the factor that is holding the rate back.
That is why the sliders act differently. Raising CO₂ hardly changes the dim-light part of the curve but lifts its top, so a leaf in a greenhouse with added CO₂ gains most in bright light. Temperature mainly changes the enzymes, so it squeezes or stretches the whole top of the curve. Closing the stomata lowers the CO₂ inside the leaf (shown as CO₂ inside), which pulls the ceiling down even when the air outside is unchanged. The dashed line is always the default leaf, for comparison.
What the model leaves out
The model is drawn for clarity, not to scale between levels, and the proteins are smooth blobs rather than measured structures. Several real processes are missing.
- Rubisco also reacts with oxygen. That side reaction, photorespiration, wastes carbon and gets worse as leaves warm up. The model only hints at it through the shape of the temperature curve.
- Plants also run cyclic electron flow around photosystem I, which makes extra ATP without NADPH. The model shows only the linear route, so its ATP and NADPH numbers match the Calvin cycle exactly.
- C4 plants and CAM plants such as cacti concentrate CO₂ before Rubisco sees it. OpenStax describes how cacti take up CO₂ at night and keep their stomata shut by day. Their curves look quite different.
- Real optimum temperatures vary between species and shift as plants acclimate to the temperature they grow in, as Yamori and colleagues show in their 2014 review. The 25 °C peak here is a round number chosen for the model.
- Water loss is shown in model units, scaled from the stomatal opening and from the drying power of air at 50 percent humidity, using the FAO formula for saturation vapour pressure.
A short history
Melvin Calvin received the 1961 Nobel Prize in Chemistry for his research on the carbon dioxide assimilation in plants, the work that traced how carbon moves through the cycle now named after him. Many textbooks call it the Calvin-Benson cycle, to include another scientist who worked on it. Peter Mitchell's chemiosmotic theory, which explains how a proton gradient drives ATP synthesis in both mitochondria and chloroplasts, earned the 1978 Nobel Prize in Chemistry. In 1988 Johann Deisenhofer, Robert Huber and Hartmut Michel shared the chemistry prize for determining the three-dimensional structure of a photosynthetic reaction centre, the first membrane protein to be solved atom by atom. The structure of the water-splitting cluster in photosystem II followed in 2011.
Counting photons and stored energy
The eight-photon figure describes an ideal electron-transfer budget, not the fraction of sunlight that becomes a crop. Four electrons must each be excited twice to supply two NADPH. Dividing one fixed CO₂ by eight absorbed photons gives a limiting quantum yield of 0.125 CO₂ per photon. If a hypothetical leaf instead needs ten absorbed photons per fixed CO₂, the yield becomes 0.100. These are worked examples. The second number is not a universal measured requirement: additional ATP production, photorespiration and other losses change the requirement with conditions.
For a hypothetical light beam delivering 800 micromoles of absorbed photons per square metre per second, the eight-photon budget would permit 100 micromoles of CO₂ fixation per square metre per second. A ten-photon budget would permit 80. Neither result predicts the exhibit's Net rate, because its vertical axis is in model units and includes a separate respiration term. The photon flux and the carbon flux also have different meanings even though both use micromoles. Counting photons cannot by itself tell us the energy efficiency: blue photons carry more energy than red photons.
Zhu, Long and Ort's 2008 review estimated maximum solar-to-biomass conversion efficiencies of 4.6% for C3 plants and 6% for C4 plants at 30 °C and 380 ppm CO₂. The concentration belongs to that paper's assumptions, not to present air. These percentages use the full incident solar spectrum as the denominator. They must not be compared directly with a yield per absorbed photon or with an efficiency calculated from visible light alone. Much sunlight lies outside the conventional photosynthetically active band; reflection and metabolic costs reduce the remainder.
As an energy-accounting exercise, suppose a crop intercepts 1000 MJ of total solar energy over a chosen area and period. An assumed conversion efficiency of 1% stores 10 MJ in biomass; 2% stores 20 MJ. These percentages are illustrative field-performance assumptions, not measurements for every crop. They include neither an automatic promise of edible yield nor a claim that all intercepted light reaches a working leaf. Roots and stems also contain stored chemical energy. A short, well-lit leaf measurement and a season-long harvest answer different questions.
Where compensation differs from saturation
At the light compensation point, gross photosynthetic carbon uptake exactly balances respiratory carbon loss, so net exchange is zero. Below it the plant can still be photosynthesizing, but respiration wins the balance. At saturation, increasing light produces little extra carbon uptake. These are different places on the curve, not two names for the first bend.
With CO₂ in the air at 426 ppm, Leaf temperature at 25 °C and Stomata open at 100%, the code gives a compensation light level of about 27.6 micromoles of photons per square metre per second. This value comes from solving the exhibit's net-rate equation for zero. It is a calculation for this model, not a published threshold for oak leaves. The control uses whole-number light settings, so 28 is a practical setting close to the crossing. At zero light the net rate is −3 model units; crossing zero does not mean that respiration stopped.
The 90% mark uses gross photosynthesis relative to its calculated ceiling. It occurs near 1274 at these settings. The rate there has not reached a mathematically flat plateau, and the graph's displayed net rate has respiration subtracted. Using a different percentage would give a different saturation marker. That is why a numerical saturation value should always state its criterion.
A leaf acclimated to shade can have a lower respiration rate and reach net carbon gain under dimmer conditions. A sun leaf may support a higher maximum rate. The exhibit does not switch between measured sun-leaf and shade-leaf parameter sets. Nor does its smooth response include damage from excessive light. In a real canopy, upper leaves can receive more light than they can process while leaves below remain light-limited. Antenna-size research examines whether sharing light more evenly could improve whole-canopy production rather than merely increasing absorption at the top.
C3 leaves, maize and a cactus
The names C3 and C4 refer to the carbon counts in the first stable products of their respective initial fixation pathways. In a C3 leaf, Rubisco adds CO₂ directly to RuBP and the immediate stable products are three-carbon 3-PGA. Wheat and rice use this pathway. Rubisco also reacts with oxygen. That oxygenation starts photorespiration, a recovery pathway which consumes energy and releases some previously fixed carbon. It is not the same process as mitochondrial respiration in the dark.
Maize and sugarcane are C4 plants. Their initial capture uses PEP carboxylase in mesophyll cells, producing four-carbon compounds. Those compounds carry carbon to bundle-sheath cells, where CO₂ is released near Rubisco. The Calvin cycle still operates; C4 metabolism supplies it with a more concentrated CO₂ source. Maintaining this pump costs extra energy, so C4 is not an unconditional improvement under every temperature or light level. Its advantage is particularly useful where heat and low internal CO₂ would otherwise favour photorespiration.
Many cacti use CAM. They take up much of their external CO₂ at night and temporarily store the carbon in organic acids. During the day, acid breakdown supplies CO₂ while stomata can remain more tightly closed. C4 commonly separates the initial capture and the Calvin cycle between cell types; CAM separates much of the work between night and day. These distinctions explain why putting a cactus into a model of an ordinary daytime C3 leaf would be misleading.
Rubisco's carboxylation capacity is therefore only part of the problem. Substrate delivery matters too. Closing stomata can limit carbon uptake even when enzymes are intact, and supplying more external CO₂ may help only if enough reaches the chloroplast. The Leaf type control offers a C3 sun leaf, a C3 shade leaf and a maize-like C4 leaf, and all three are model curves. The C4 setting saturates its CO₂ response near today's air, has a compensation point close to zero and a warmer optimum, and starts with a lower slope to stand for the pump's extra ATP. It does not compute Rubisco turnover, oxygenation or the pump itself. The shade leaf follows Boardman's review of sun and shade plants: less capacity and less respiration, so it breaks even in dim light and saturates early. There is no CAM setting, and none of the three can be used to rank actual crop yields.
What green leaves do not tell you
A green appearance does not demonstrate that green photons cannot power photosynthesis. Isolated chlorophyll absorbs blue and red bands strongly, but a leaf is a thick, scattering structure containing many chloroplasts. Some green light escapes; some travels farther through the tissue before being absorbed. The absorption spectrum of a pigment solution and the action spectrum of a whole leaf are not interchangeable measurements.
Liu and van Iersel's 2021 study tested lettuce under different light spectra and photon fluxes. At low intensity, green light had a lower incident-light quantum yield because absorption was lower. At high intensity, its quantum yield was among the highest, consistent with a more even distribution of excitation through the leaf. This is a conditional result, not a recommendation that green-only lamps always grow better crops. The Light colour control follows the pattern loosely. It changes only the initial slope of the curve (green lowest, then blue, white and red), so the colours differ most in dim light and nearly meet in bright light. Those factors are model values, and the exhibit does not simulate depth-dependent absorption.
The soil misconception requires a different distinction. Carbon in new wood mainly comes from atmospheric CO₂, but a freshly weighed tree also contains considerable water. Water enters through roots, and mineral nutrients from soil remain essential even though they are not the main source of dry organic carbon. A pot losing little soil while its plant gains mass argues against soil being the bulk source; it does not, by itself, identify every source of the gain. Comparing dry mass and tracking carbon are stronger tests than weighing a wet plant alone.
Likewise, the sugar symbol on screen is a bookkeeping symbol, not a claim that a chloroplast ejects a finished glucose molecule after every fixation. The Calvin cycle exports a three-carbon product after several turns, and further metabolism makes sugars and other material. Visible bubbles would identify released gas, not the carbon source of the growing stem.
Bubbles from pondweed and light at an angle
Schools measure photosynthesis with a water plant. The Royal Society of Biology's Practical Biology protocol puts a cut length of Elodea or Cabomba in water under a lamp and counts the bubbles that rise from the cut end over 1 minute, then repeats the count and takes a mean. It also names the assumptions: the bubbles are taken to be only oxygen, oxygen production is taken to be proportional to the rate, and the bubbles are taken to be the same size. Light from a small lamp falls with the square of the distance, so moving the lamp twice as far away leaves about a quarter of the light.
The beaker on the stage runs the same experiment inside the model. Its count per minute is the model's net rate multiplied by a fixed factor, so it shows direction and proportion rather than a number you would see in a classroom. The pondweed is treated as a C3 water plant, so the Stomata open control does not change it.
The sun can be dragged. Light arriving at an angle spreads over more leaf, and the light per square metre of leaf falls with the cosine of the angle from straight overhead. At 60 degrees a leaf receives half of what it would get with the sun directly above it. The readout shows both numbers: Light is the strength of the source, and On the leaf is what the rate curve uses.
Try it on the screen
- Leave the controls at their starting values and drag the sun down towards the horizon. On the leaf falls with the cosine of the angle while Light stays the same, the rays thin out and the pondweed slows. Its bubbles per minute are model values.
- Move Light to 0. The line under the title switches to giving out CO₂, the molecule flows reverse and the pondweed stops. Raise the light slowly until Net rate crosses 0. That is the compensation point, about 28 µmol/m²/s at 426 ppm and 25 °C in this model.
- Set Light to 2000 and compare the dot with the 90% marker. Then raise CO₂ in the air to 1000. The cloud of CO₂ around the leaf thickens and the upper curve rises, because the carbon ceiling has changed and the lamp has not.
- Raise Leaf temperature to 40. Water loss climbs, the leaf yellows and droops, and the rate falls. Narrow Stomata open and watch the magnified stoma close: the leaf loses less water, and CO₂ inside drops.
- Switch Leaf type to C4 and Light colour to green. Then use Scale to go down to the thylakoid membrane and follow the electrons from photosystem II to NADPH. The counters for ATP, NADPH and CO₂ fixed keep the 3 to 2 to 1 budget described above; they are not independent measurements.
Questions
Where does the oxygen from photosynthesis come from?
It comes from water, not from carbon dioxide. Photosystem II takes electrons from water, and splitting two water molecules releases one O₂. Carbon from CO₂ is incorporated into organic molecules. The overall equation is not an atom-by-atom account of oxygen exchange with water.
Why are leaves green?
Chlorophyll absorbs red and blue light strongly and reflects or transmits green. This does not mean that green light is useless. Absorbed green light can drive photosynthesis deeper inside a leaf, especially under strong illumination.
What is the difference between the light reactions and the Calvin cycle?
The light reactions run in the thylakoid membrane and turn light into ATP and NADPH, releasing oxygen. The Calvin cycle runs in the stroma and uses that ATP and NADPH to fix CO₂ into sugar. The old name "dark reactions" is misleading, because the cycle runs in daylight when ATP and NADPH are being made.
Why does the rate stop rising in bright light?
Above a certain light level the Calvin cycle becomes the bottleneck. Rubisco can only fix carbon dioxide so fast, and it needs CO₂ to arrive through the stomata. More light then makes no difference, but more CO₂ or a better temperature can.
Why do plants close their stomata?
To save water. An open stoma lets CO₂ in but also lets water vapour out, and up to 90 percent of the water a plant takes up can be lost this way. On a hot, dry day closing the pores protects the plant at the cost of photosynthesis.
How many photons does it take to make one O₂?
In the simple linear scheme, eight. Four electrons are needed to release one O₂ from two waters, and each electron is boosted twice, once at photosystem II and once at photosystem I.
Is the chloroplast's ATP synthase the same as the one in mitochondria?
It works the same way and has the same parts, but its rotor ring in leaf chloroplasts has 14 subunits, more than the ring in animal mitochondria. A larger ring means more protons per ATP. The ATP synthase exhibit lets you change the ring size.
Can green light drive photosynthesis?
Yes. Green photons absorbed inside a leaf contribute to photosynthesis. Lower absorption at the surface can allow them to reach deeper chloroplasts; the benefit depends on intensity and leaf structure.
Do C4 plants avoid the Calvin cycle?
No. They concentrate CO₂ before supplying it to Rubisco and the Calvin cycle. The extra carbon-concentrating pathway has an energy cost.
Is the compensation point where photosynthesis starts?
No. It is where photosynthetic uptake balances respiratory release. Below it, photosynthesis can continue even though net carbon exchange is negative.
Terms
- Stoma (plural stomata): a pore in the leaf surface between two guard cells.
- Mesophyll: the inner tissue of a leaf, in a palisade layer and a spongy layer.
- Chloroplast: the organelle where photosynthesis happens.
- Thylakoid: a flattened membrane sac inside a chloroplast; a stack of them is a granum.
- Stroma: the fluid around the thylakoids, where the Calvin cycle runs.
- Lumen: the space inside a thylakoid, where protons collect.
- Photosystem: a protein complex with an antenna of pigments and a reaction centre that uses light to move an electron.
- NADPH: an electron carrier made by the light reactions and used to reduce carbon in the Calvin cycle.
- Rubisco: the enzyme that joins CO₂ to RuBP.
- G3P: glyceraldehyde 3-phosphate, the three-carbon sugar the Calvin cycle exports.
- Transpiration: the loss of water vapour from a plant, mostly through stomata.
- Light saturation: the light level above which the rate of photosynthesis stops rising much.
Sources
OpenStax, Biology 2e, 8.1 Overview of Photosynthesis (99 percent of ecosystems, chloroplast, thylakoid, granum, stroma, lumen, stomata on the underside). https://openstax.org/books/biology-2e/pages/8-1-overview-of-photosynthesis (checked 16 October 2026)
OpenStax, Biology 2e, 8.2 The Light-Dependent Reactions of Photosynthesis (400 to 700 nm, 300 to 400 chlorophylls per antenna, a millionth of a second, P680, P700, water splitting, about 10 percent of O₂ used by mitochondria, plastoquinone, cytochrome complex, plastocyanin). https://openstax.org/books/biology-2e/pages/8-2-the-light-dependent-reactions-of-photosynthesis (checked 16 October 2026)
OpenStax, Biology 2e, 8.3 Using Light Energy to Make Organic Molecules (Rubisco, RuBP, 3-PGA, G3P, three turns per exported G3P, 6 ATP and 6 NADPH in reduction plus 3 ATP in regeneration, cacti). https://openstax.org/books/biology-2e/pages/8-3-using-light-energy-to-make-organic-molecules (checked 16 October 2026)
OpenStax, Biology 2e, 30.4 Leaves (cuticle, epidermis, palisade and spongy mesophyll, guard cells, veins). https://openstax.org/books/biology-2e/pages/30-4-leaves (checked 16 October 2026)
OpenStax, Biology 2e, 30.5 Transport of Water and Solutes in Plants (up to 90 percent of water lost by transpiration, guard cell responses). https://openstax.org/books/biology-2e/pages/30-5-transport-of-water-and-solutes-in-plants (checked 16 October 2026)
NOAA Global Monitoring Laboratory, Trends in Atmospheric Carbon Dioxide (Mauna Loa monthly mean 426.07 ppm, September 2026). https://gml.noaa.gov/ccgg/trends/ (checked 16 October 2026)
Umena Y, Kawakami K, Shen J-R, Kamiya N, Crystal structure of oxygen-evolving photosystem II at a resolution of 1.9 Å, Nature 473, 55 (2011) (Mn4CaO5 cluster, four bound waters). https://www.nature.com/articles/nature09913 (checked 16 October 2026)
Seelert H, Poetsch A, Dencher NA, Engel A, Stahlberg H, Müller DJ, Proton-powered turbine of a plant motor, Nature 405, 418 (2000) (14 subunits in the chloroplast ATP synthase ring). https://www.nature.com/articles/35013148 (checked 16 October 2026)
Yamori W, Hikosaka K, Way DA, Temperature response of photosynthesis in C3, C4, and CAM plants: temperature acclimation and temperature adaptation, Photosynthesis Research 119, 101 (2014). https://link.springer.com/article/10.1007/s11120-013-9874-6 (checked 16 October 2026)
FAO, Crop evapotranspiration, Irrigation and Drainage Paper 56, chapter 3 (saturation vapour pressure, equation 11). https://www.fao.org/4/x0490e/x0490e07.htm (checked 16 October 2026)
NobelPrize.org, The Nobel Prize in Chemistry 1961 (Melvin Calvin). https://www.nobelprize.org/prizes/chemistry/1961/summary/ (checked 16 October 2026)
NobelPrize.org, The Nobel Prize in Chemistry 1978 (Peter Mitchell). https://www.nobelprize.org/prizes/chemistry/1978/summary/ (checked 16 October 2026)
NobelPrize.org, Press release: The Nobel Prize in Chemistry 1988 (structure of a photosynthetic reaction centre). https://www.nobelprize.org/prizes/chemistry/1988/press-release/ (checked 16 October 2026)
Zhu, Long and Ort (2008), What is the maximum efficiency with which photosynthesis can convert solar energy into biomass? University of Illinois record and abstract (4.6%, 6%, 30 °C, 380 ppm assumptions). https://experts.illinois.edu/en/publications/what-is-the-maximum-efficiency-with-which-photosynthesis-can-conv (HTTP 200, checked 23 October 2026)
Ort, Zhu and Melis (2011), Optimizing Antenna Size to Maximize Photosynthetic Efficiency, Plant Physiology (canopy light distribution, quantum yield, response curves). https://pmc.ncbi.nlm.nih.gov/articles/PMC3014228/ (HTTP 200, checked 23 October 2026)
Royal Society of Biology, Practical Biology, Investigating factors affecting the rate of photosynthesis (pondweed bubble count, assumptions, light and distance). https://practicalbiology.org/energy/photosynthesis/investigating-factors-affecting-the-rate-of-photosynthesis.html (checked 26 October 2026)
Boardman (1977), Comparative photosynthesis of sun and shade plants, Annual Review of Plant Physiology 28. https://doi.org/10.1146/annurev.pp.28.060177.002035 (checked 26 October 2026)
Liu and van Iersel (2021), Photosynthetic Physiology of Blue, Green, and Red Light, Frontiers in Plant Science (lettuce, intensity-dependent green-light response). https://pmc.ncbi.nlm.nih.gov/articles/PMC7977723/ (HTTP 200, checked 23 October 2026)
More exhibits
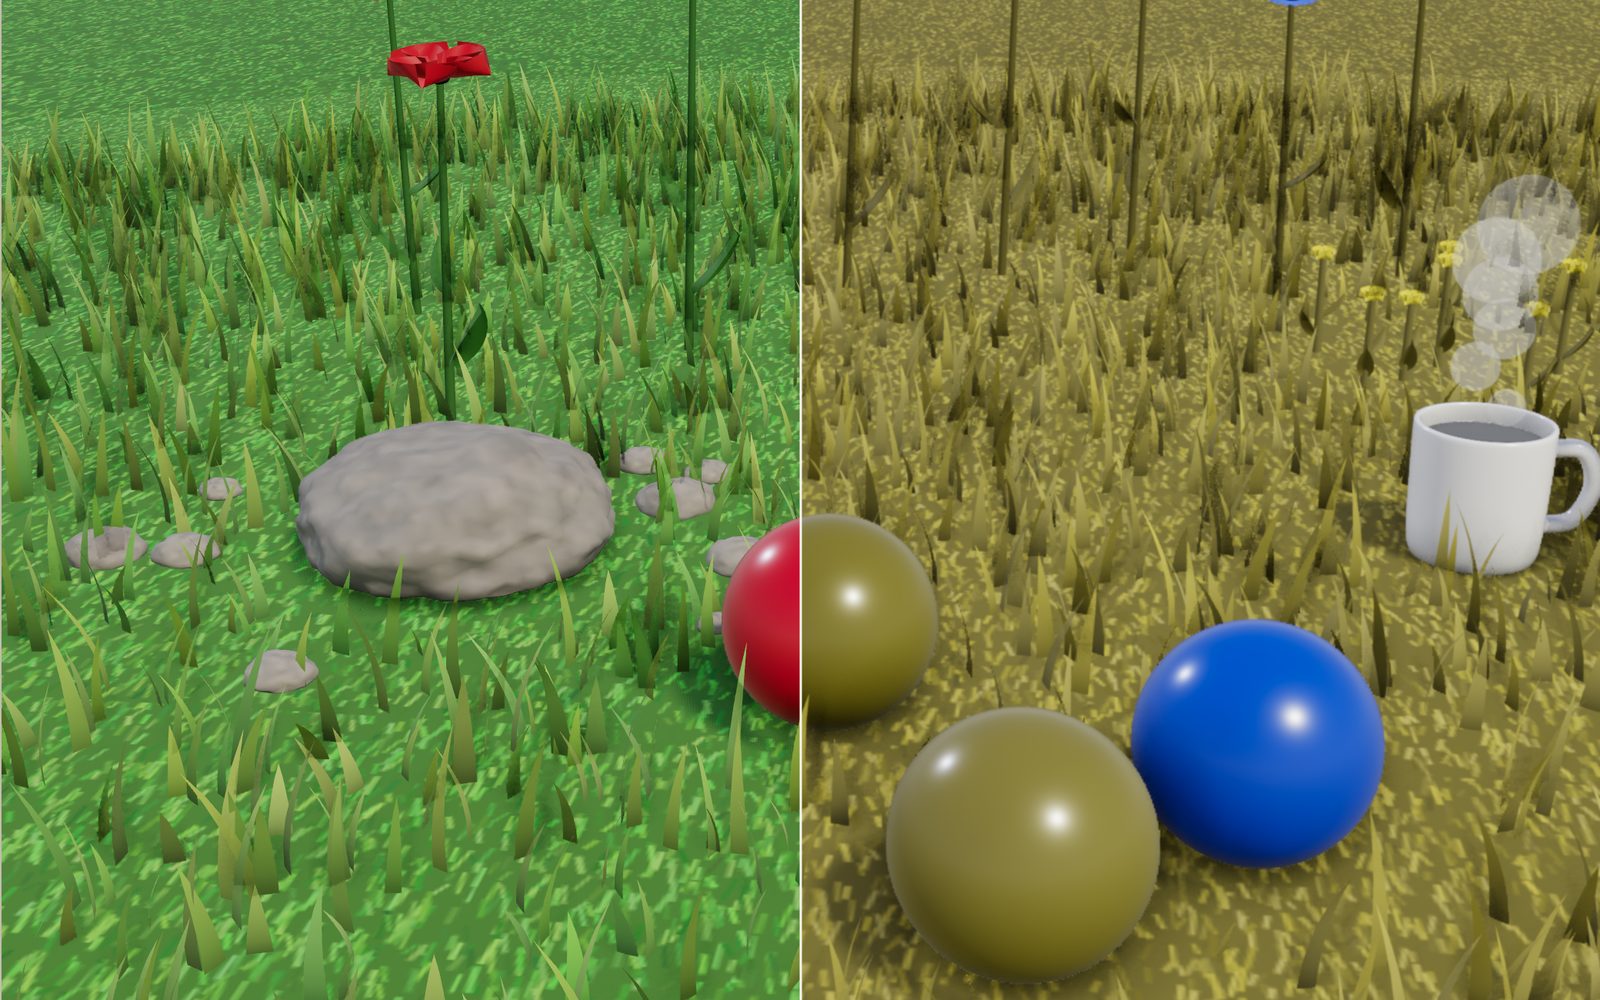
Animal vision: see the world through 69 animals’ eyes
A red ball on green grass is easy for you to find and surprisingly hard for a dog. A honeybee sees a pattern in the same flower that you cannot.
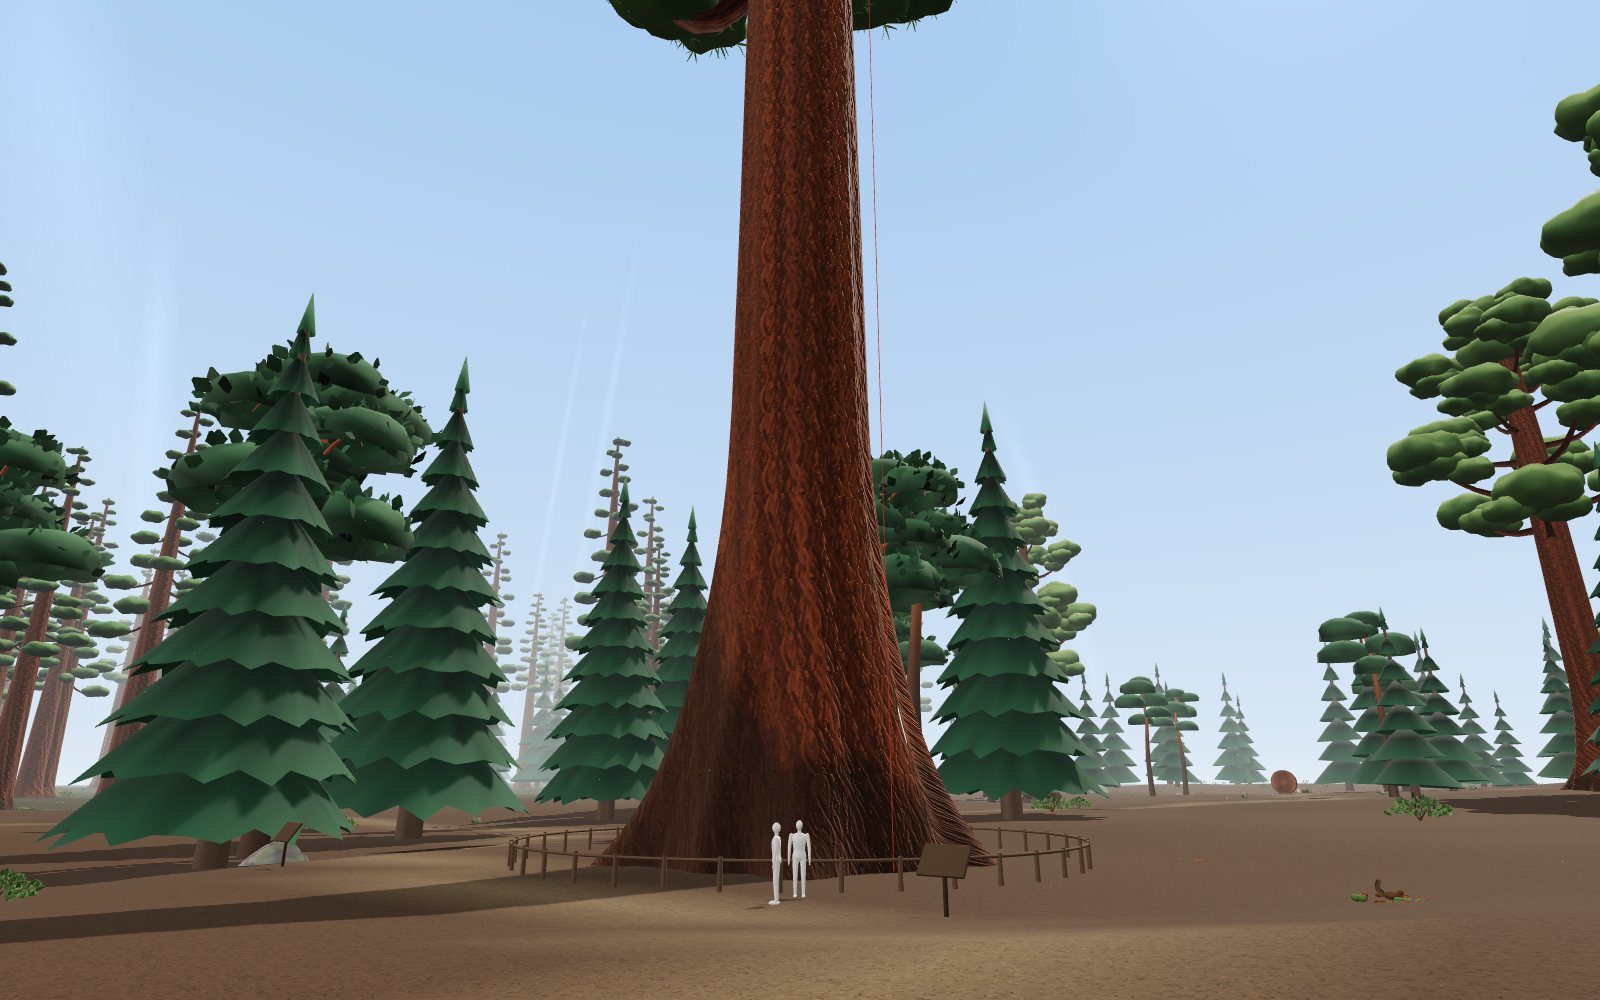
Giant sequoia forest: walk under the largest trees
Stand at the foot of the General Sherman Tree, 83.8 m tall and about 2,200 years old, then climb its trunk and see how hard the water up there is pulled.
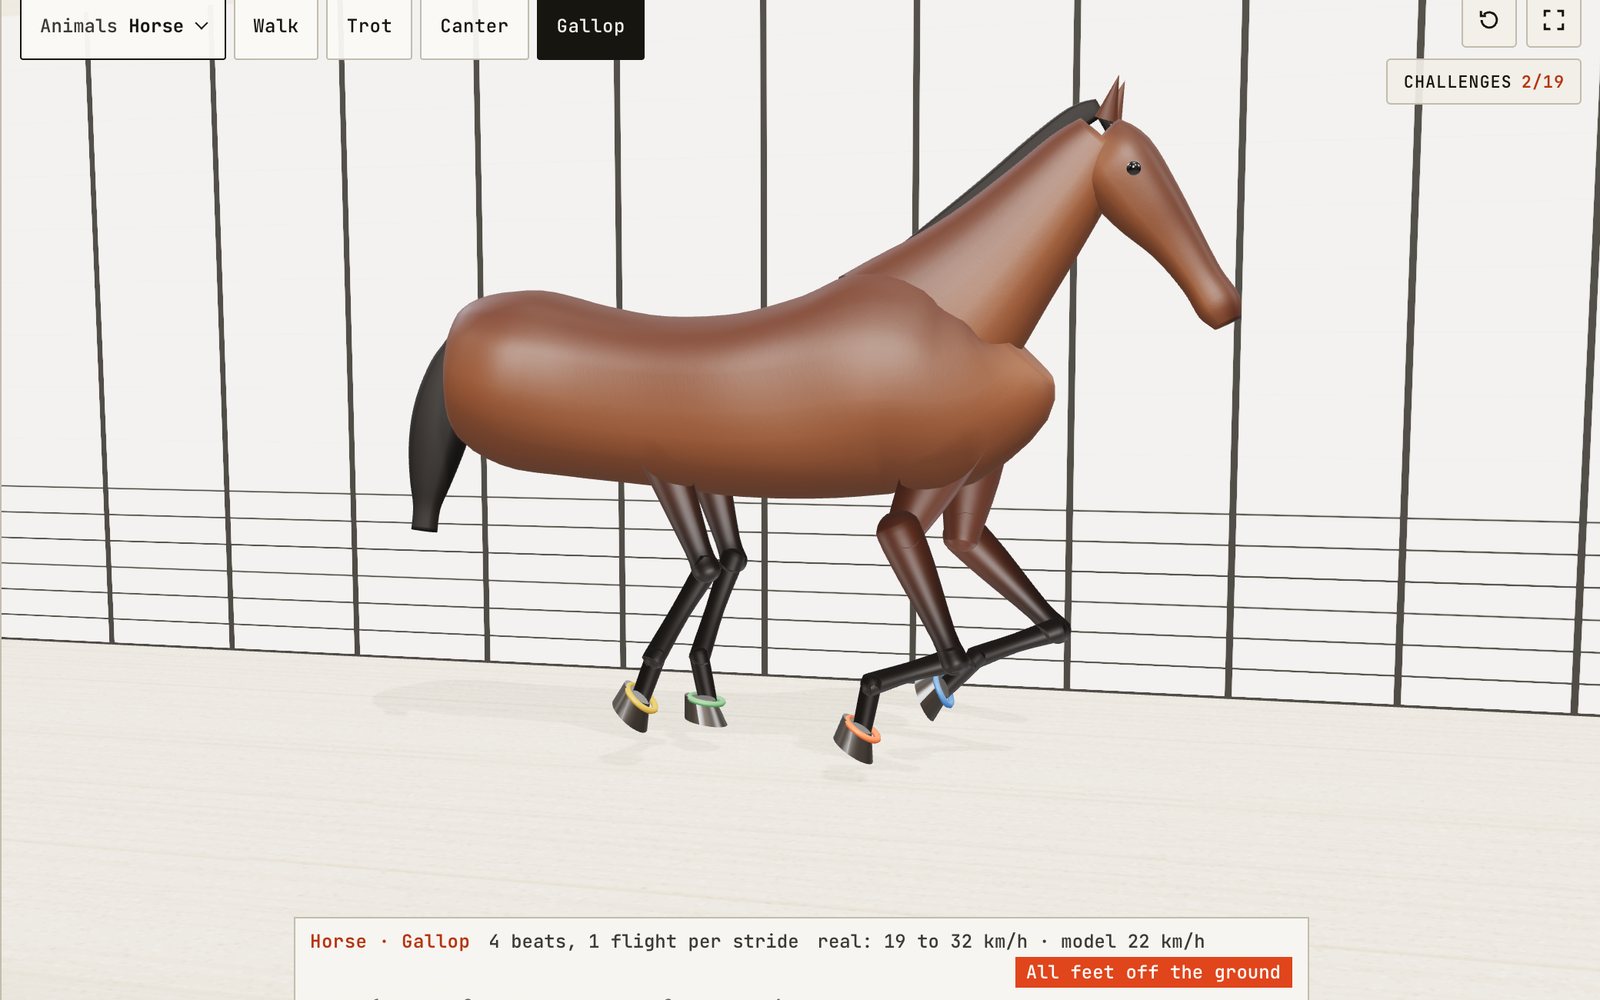
How a horse runs: walk, trot, canter and gallop
In 1878 Muybridge's cameras showed that a galloping horse does lift all four feet at once, but with its legs tucked under it. Some fast animals never leave the ground at all.
How CRISPR-Cas9 gene editing works
A guide RNA reads just 20 letters of DNA, and that is usually enough to pick out one spot among the 3 billion base pairs of a human genome.
How ATP synthase works
In mitochondria the rotor of ATP synthase turns about 100 times a second, and every full turn releases three molecules of ATP.
Dinosaur size comparison to humans: 172 life-size animals
A 600 m park of 172 prehistoric animals at their real size, from the first dinosaurs to T. rex, laid out by age.