FIG. 67How It Works
How a solar panel works
In full sun a 60-cell rooftop panel makes about 300 watts, and all of it comes from an electric field sitting inside each slice of silicon.
This device cannot show the 3D model. You can read the guide steps below as text.
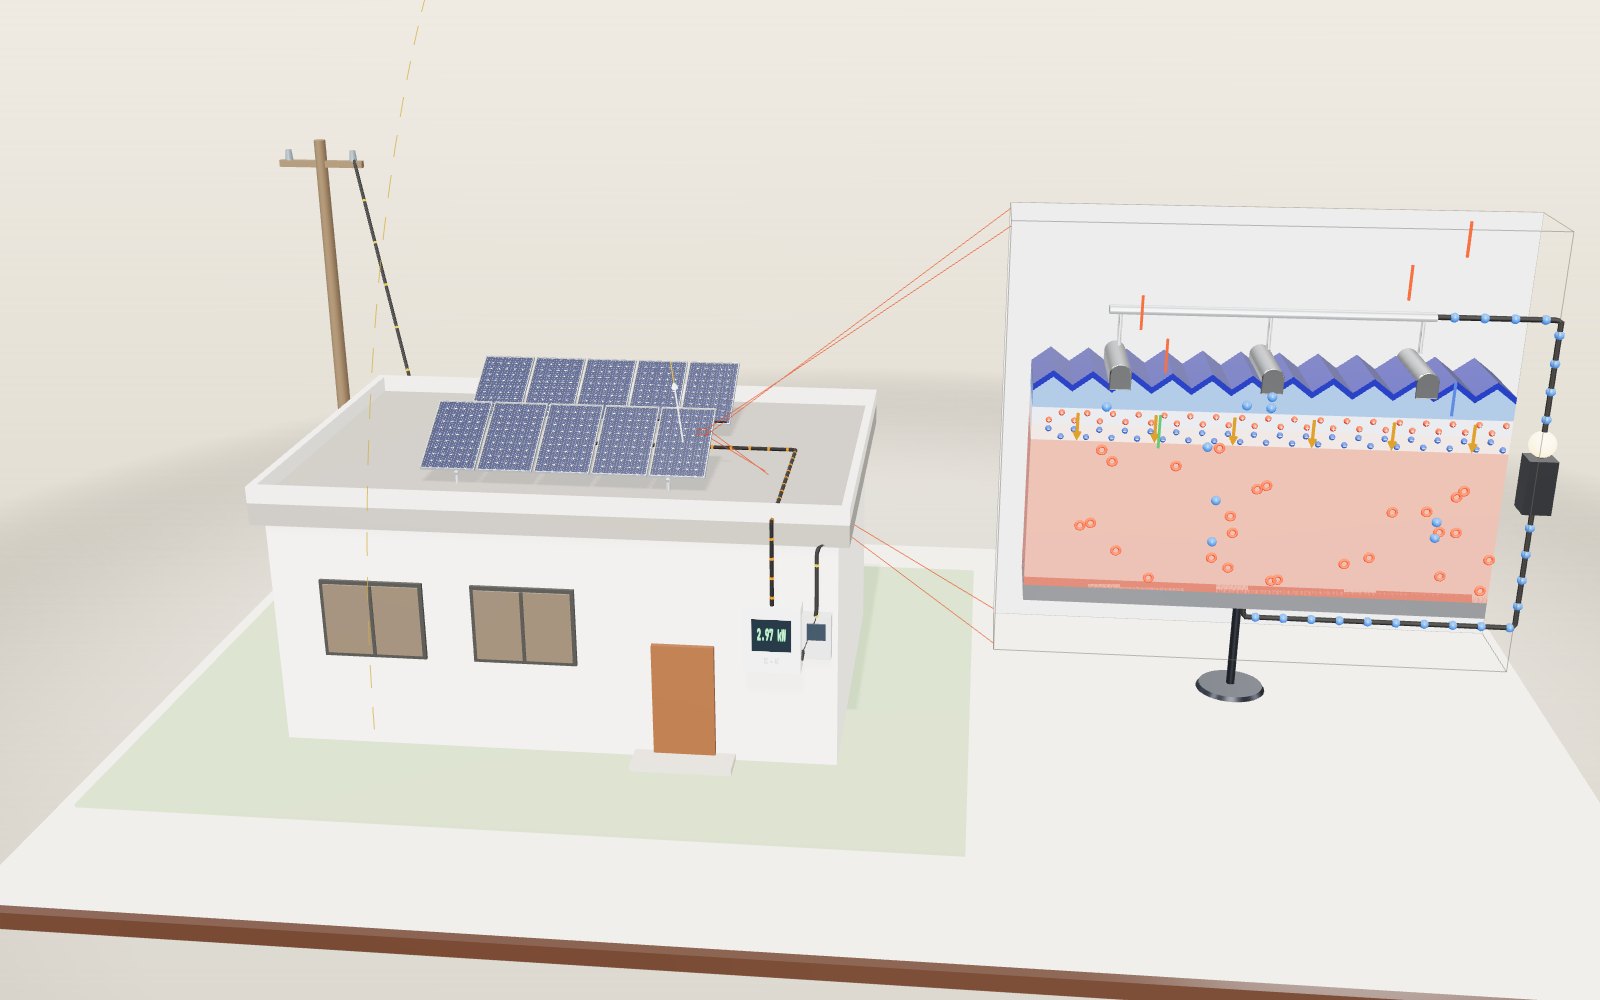
1 / 11 A 3 kW roof at noonTen panels sit on two racks tilted 30°, and the sun is 60° above the southern horizon, so the light meets them square on. The array makes 3.07 kW of direct current. On the right is a slice through one cell, drawn many thousands of times larger.
Drag to turn. Scroll or pinch to zoom.
What the model shows
Look at a solar panel on a sunny roof and nothing seems to happen. There is no hum, nothing turns, nothing gets used up. Yet a cable runs from the back of the panel to a box on the wall, and that box can boil a kettle. This exhibit follows the electricity back from the kettle to where it starts: a layer of silicon thinner than a fingernail, sitting under the glass.
On the left is a small flat-roofed house with ten panels on two tilting racks. A black cable takes their direct current down the front wall to an inverter, and from there a second cable runs through the meter to the pole behind the house. The sun moves along its noon arc over the southern sky, and the shadows move with it. The panel at the right end of the front row is the one the exhibit looks at closely: it can be taken apart, it has a junction box with bypass diodes underneath, and a leaf can be dropped onto one of its cells.
On the right floats a slice through one cell, drawn many thousands of times larger than life. From top to bottom you can see silver contacts, a dark blue coating on a surface cut into tiny pyramids, a thin n-type layer, the junction with its fixed ions and electric field, a thick p-type base and an aluminium layer at the back. Coloured streaks are photons. When one is absorbed it leaves a blue electron and a red hole, and the field sorts them.
The readout shows the light reaching the panel, the cell temperature, the power of the panel with the leaf, the whole array before and after the inverter, and the heat in the shaded cell. The small chart is the power of one panel against its voltage; the red dot is where it is working right now, and the faint dashed curve is the same panel at 1,000 W/m² and 25 °C for comparison. The sliders change the height of the sun, the tilt of the racks, the cell temperature and how much of one cell the leaf covers. A switch takes the bypass diodes away.
The panel in the model is a common 60-cell type with M2 cells 156.75 mm square. Its electrical behaviour comes from a one-diode model with values chosen to match ordinary monocrystalline panels: at 1,000 W/m² and 25 °C it gives 307 W, 18.8 % of the sunlight on its 1.63 m². The article says where the model is simplified.
Two kinds of silicon in one slice
Pure silicon is a poor conductor. Each atom shares its four outer electrons with four neighbours, and at room temperature very few of those electrons break free. Cell makers change that on purpose. They add a little phosphorus to the thin top layer. Phosphorus has five outer electrons, so each phosphorus atom brings one spare electron that can wander through the crystal. That layer is called n-type, for negative. The thick base gets a little boron instead. Boron has only three outer electrons, so each boron atom leaves a gap in the bonds. A neighbouring electron can hop into that gap, which moves the gap elsewhere, and so the gap behaves like a positive particle. It is called a hole, and the layer is p-type.
Put the two layers together and something happens at the boundary straight away. Spare electrons from the n side wander into the p side and fill holes there. That leaves the phosphorus atoms near the boundary one electron short, so they become fixed positive ions, and the boron atoms just across the line one electron extra, fixed negative ions. In the model these are the red and blue balls with + and − signs. They cannot move, because they are part of the crystal.
The strip that has lost its free electrons and holes is the depletion region. Between its positive and negative ions there is now an electric field, shown by the orange arrows pointing from the n side to the p side. The field stops more electrons from crossing, so the junction settles down. PVEducation describes this balance in its section on the formation of a pn junction. The junction is the part of the cell that does the sorting, and the rest of the slice is there to bring light to it and take charge away from it.
How a photon frees an electron
Light comes in packets of energy called photons. To free an electron from a silicon bond, a photon must carry at least the band gap of silicon, 1.12 electronvolts. That corresponds to a wavelength of about 1,107 nm, in the near infrared. Photons with longer wavelengths pass straight through the cell. Photons with shorter wavelengths free an electron, and the extra energy turns into heat almost at once. A blue photon at 450 nm carries 2.76 eV, so about 1.64 eV of it is lost as warmth in the crystal.
Where a photon is absorbed depends on its colour. Blue light is absorbed within a fraction of a micrometre, very close to the surface. Red and near-infrared light can go much deeper before it is caught. In the model, blue streaks stop in the n layer, green ones in the upper part of the base and red ones lower down.
The absorbed photon leaves an electron that is free to move and a hole where it used to be. If nothing pulls them apart they wander at random and sooner or later the electron falls back into a hole. That is recombination, and the energy is lost as heat. A pair made in the p-type base therefore has to diffuse to the junction before it recombines. Once it reaches the edge of the depletion region the field takes over. It drags the electron up into the n layer and pushes the hole down into the base. The white flashes in the model are pairs that did not make it, and there are more of them when the cell is hot.
The field turns pairs into a current
Separated electrons gather in the n layer and separated holes in the p layer. That builds up a voltage between the front and back of the cell. If the front and back are joined by a wire, electrons flow out through the thin silver fingers on the front, along the ribbon, through the load and back into the aluminium on the rear, where they fill the holes waiting there. The blue dots on the wire in the model show that flow. The more light arrives, the more pairs are made and the larger the current.
A single cell gives a small voltage. In the model's cell it is about 0.68 V with nothing connected and 0.55 V at the point of maximum power, where the cell delivers 9.26 A and 5.12 W. That is why a panel puts 60 cells in series: their voltages add up to 33.2 V at the maximum power point and 40.8 V with no load.
The fingers have to be thin, because silver blocks light. They also have to be close together, because the n layer is thin and resists the sideways flow of electrons. The compromise is a comb of narrow lines across the cell, collected by three wider busbars. You can see both on the panels in the model.
Why the cells look dark blue
Bare polished silicon is shiny grey and reflects a lot of light. With a refractive index of about 3.9, a flat silicon surface in air reflects roughly 35 % of the light that hits it straight on. Two tricks cut this down. First, the surface is etched into tiny pyramids. A ray that bounces off one face is usually aimed at the next, so it gets a second chance to enter. Second, the surface is covered with a thin transparent film, usually silicon nitride. PVEducation explains how a quarter-wavelength coating works: light reflected from the top of the film and from the silicon below comes back half a wave apart and cancels. For a film with refractive index 2.0 and light at 600 nm, the right thickness is 600 ÷ (4 × 2.0) = 75 nm. The cancellation is best in the middle of the spectrum, and what little light still comes back is mostly blue. That is the colour of a solar cell.
From cells to a panel
A panel wraps the cells in layers that keep the weather out for decades. Toughened glass sits on top, a clear plastic bonds the cells to it, and a white backsheet closes the back. An aluminium frame holds the sandwich together. Open the second step of the guide and the right-hand panel lifts apart so you can see the layers.
The 60 cells are wired in series, in three groups of 20. Each group has a bypass diode in the junction box on the back. In normal sun the diodes do nothing. They matter when one cell is shaded, as the section on shade explains.
Sun angle and the cosine law
The power of sunlight depends first on how much air it has to cross. PVEducation gives a simple fit for the direct beam: I = 1,353 × 0.7^(AM^0.678) W/m², where AM, the air mass, is the length of the path through the atmosphere compared with the path when the sun is straight overhead. The model uses the Kasten and Young formula for the air mass and adds diffuse sky light equal to 10 % of the direct beam, as PVEducation suggests for a clear day. With the sun overhead the direct beam is 947 W/m². At 30° it is 766 W/m², and at 10° only 431 W/m², because the light is crossing 5.6 times as much air.
The second factor is the angle at which the light meets the panel. A beam that hits at an angle θ from straight on is spread over a larger area, so the power per square metre drops by cos θ. This is the cosine law. For a panel facing the sun's direction, θ is just 90° minus the sun height minus the tilt, and cos θ equals sin(sun height + tilt).
Some numbers from the model:
| Sun height | Tilt | Angle θ | cos θ | Light on panel | One panel |
|---|---|---|---|---|---|
| 60° | 30° | 0° | 1.00 | 998 W/m² | 307 W |
| 60° | 0° | 30° | 0.87 | 882 W/m² | 272 W |
| 29° | 33° | 28° | 0.88 | 737 W/m² | 227 W |
| 29° | 0° | 61° | 0.49 | 442 W/m² | 136 W |
| 29° | 61° | 0° | 1.00 | 813 W/m² | 250 W |
The 29° rows are a winter noon in Seoul, at latitude 37.6° N, where the sun's noon height ranges from about 29° in December to about 76° in June. A fixed tilt near 30° is a compromise across the year. In June, with the sun at 76°, the same 33° rack gets 975 W/m² because the angle is 19° and the cosine is still 0.95. The cosine is forgiving near zero and harsh far from it, which is why flat panels lose so much in winter.
Hot panels make less power
Heat lowers a cell's voltage. As the cell warms up, more electrons and holes are made by heat alone, and the junction leaks more current back the wrong way. PVEducation gives a fall in open-circuit voltage of about 2.2 mV per °C for silicon and a power loss of 0.4 % to 0.5 % per °C. The model uses 2.2 mV per °C and a small rise in current, 0.05 % per °C, and ends up losing 0.40 % of its power for every degree.
At 25 °C the panel gives 307 W. At 45 °C it gives 282 W, and at 65 °C it gives 257 W, 16 % less, with its maximum power voltage down from 33.2 V to 27.8 V. On a cold bright day at 0 °C the same panel gives 338 W. Panels in the sun are much warmer than the air around them. PVEducation's page on nominal operating cell temperature gives 48 °C for a typical panel in 800 W/m² of light, 20 °C air and a light breeze, which is why a panel's summer output is usually below its label.
One leaf and the bypass diode
Shade is harder on a panel than its area suggests. All 60 cells carry the same current. Cover one of them and its light current falls, but the other 59 still push the full current through it. The shaded cell cannot pass that current in the normal direction, so it is driven into reverse and starts to consume power instead of making it. This is the hot spot that PVEducation warns about.
The bypass diode gives the current another road. Each diode sits across a group of 20 cells. When a cell in the group is shaded and the group's voltage would go below about −0.45 V, the diode conducts and most of the current goes round. The group is switched out and the panel carries on with the other two thirds.
With the leaf covering a whole cell, at 25 °C and full sun, the model gives these figures. With the diodes, the shaded panel delivers 200 W at 21.7 V. Only 2.6 A still flows through the shaded group, 6.7 A goes through the diode, and the shaded cell turns 34 W into heat. Without the diodes the panel delivers 163 W and the whole string current, 9.2 A, is forced through the shaded cell, which sits at its reverse breakdown voltage and heats at 139 W. A few square centimetres dissipating that much power can crack the glass or scorch the backsheet.
The ten panels are in one series string, so the leaf also affects the other nine. The inverter searches for the voltage at which the whole string gives most power. In the model the string makes 3.07 kW without the leaf, 2.96 kW with it and the diodes, and 2.92 kW without the diodes. A partly covered cell is a special case. At 30 % cover the diode only just starts to conduct, and the cell is still pushed hard in reverse, so the model shows 101 W of heat even with the diode. Partial shade from a pole or a branch is a known cause of hot spots for this reason.
From the roof to the kettle
Panels make direct current. Houses and the grid use alternating current. The US Department of Energy describes the inverter as the box that makes this conversion. It also does a second job: it keeps changing the operating voltage of the string to find the point of maximum power, the red dot on the chart. The model's inverter loses 3 % and the house uses a steady 0.5 kW. At the noon setting the array gives 3.07 kW of direct current, the inverter delivers 2.97 kW at 220 V, the house uses 0.5 kW and 2.47 kW goes out through the meter.
A string inverter is the simplest arrangement, but the whole string shares one current, so trouble on one panel costs some of the others. The DOE page also describes microinverters, which sit on each panel and keep one shaded panel from dragging down the rest, at a higher cost.
How efficient can a cell get?
Some losses cannot be avoided in a cell with a single junction. Photons below the band gap are not absorbed at all, and photons above it lose their extra energy as heat. Shockley and Queisser worked out the best a single junction can do in 1961. Rühle's 2016 tables, computed for the standard AM1.5 spectrum, put the maximum at 33.16 % for a band gap of 1.34 eV. Silicon's 1.12 eV is a little below the best gap, and its limit by the same reasoning is close to 33 %. Real silicon also suffers from Auger recombination, which these idealised figures leave out.
The record values for real cells are kept by the National Laboratory of the Rockies (NLR, formerly NREL) in its Best Research-Cell Efficiency Chart, which only includes results confirmed by independent test labs. In the chart's data table, the best crystalline silicon cell is 28.1 %, a heterojunction back-contact cell from Trina Solar measured in March 2026. A perovskite layer on top of silicon reaches 35.2 % (LONGi, February 2026), above the single-junction limit, because two junctions share the spectrum. The highest figure on the chart is 47.6 % for a four-junction cell from Fraunhofer ISE under concentrated light. Research cells are small and carefully made; the 18.8 % of the model panel is typical of panels on roofs.
What the model leaves out
- The Sun height slider keeps the sun due south at noon with the panels facing it. The Sun and day tab moves it to its real place for any date and time, but the sky model stays the same.
- The sky is always clear. Clouds, haze and dust are missing, and diffuse light is a fixed 10 % of the direct beam.
- Cell temperature is set by the slider. Real cells warm up with the light and cool with the wind.
- All ten panels have the same cells. Real panels differ by a few per cent, which costs a string a little power.
- Reflection from the glass at steep angles is ignored, so at very low sun the model is too generous.
- The section is not to scale. A real cell is about 0.2 mm thick, the n layer is less than a micrometre and the depletion region thinner still. The photons, electrons and holes are tokens; a real cell in full sun sends about 6 × 10¹⁹ electrons round the circuit each second.
- The inverter loss is a fixed 3 %, and the house load is a steady 0.5 kW.
From Bell Labs to the roof
The American Physical Society's history of the solar cell starts in 1839, when Edmond Becquerel saw a small current flow from metal electrodes in a solution under light. In 1883 Charles Fritts made the first solar cells from selenium, but they turned less than 1 % of the light into electricity. In April 1954 Daryl Chapin, Calvin Fuller and Gerald Pearson at Bell Labs showed the first practical silicon cell. It was about 6 % efficient, and they used it to power a toy Ferris wheel and a radio transmitter. Within a few years silicon cells were powering satellites. The cell in this model works on the same idea as the 1954 cell, a junction between n-type and p-type silicon, with 70 years of refinements on top.
How much energy does a 400 W panel make in a day?
A watt measures power at a moment; a kilowatt-hour measures energy accumulated over time. A 400 W nameplate does not promise 400 W from sunrise to sunset. For a worked example, assume a south-facing roof in Seoul receives 3.5 kWh/m² of sunlight on the panel plane over one day. This is an assumed teaching value, not a measured Seoul annual average or a forecast. Dividing by the reference irradiance of 1 kW/m² gives 3.5 equivalent full-sun hours. These hours compress the changing sunlight into an energy total; they are not the number of hours the sun is above the horizon.
Before losses, the estimate is 0.400 kW × 3.5 h = 1.40 kWh. For a separate, hypothetical modern panel, assume a power temperature coefficient of −0.35 %/°C. This coefficient belongs to this example, not the exhibit's 307 W panel, whose response is about −0.40 %/°C. With cells at 45 °C rather than the reference 25 °C, the temperature factor is 1 − 0.0035 × (45 − 25) = 0.93. The estimate becomes 1.40 × 0.93 = 1.302 kWh of direct-current energy. Applying the exhibit's assumed inverter efficiency of 97 % gives 1.263 kWh of alternating-current energy, rounded to 1.26 kWh.
This calculation treats cell temperature as constant over the day and ignores wiring and dirt losses. In practice temperature changes alongside irradiance, so an hourly weather calculation is preferable. Do not apply panel efficiency again: the 400 W rating already includes the conversion from sunlight to electrical power. For an actual Seoul installation, replace 3.5 with dated, location-specific plane-of-array irradiation and use the manufacturer's coefficient. A horizontal weather-station measurement is not automatically the irradiation on a tilted roof.
Why a tandem needs more than another coating
The blue anti-reflection film in this exhibit is not another solar cell. It reduces reflection but does not collect a separate current. A perovskite/silicon tandem instead has an additional photovoltaic absorber with its own electrical junction. The upper absorber can use higher-energy photons while transmitting lower-energy light to silicon underneath. This divides the spectrum between different band gaps and reduces the thermalisation loss that restricts a single junction.
The US Department of Energy describes metal-halide perovskites as thin-film absorbers whose composition can be changed. Their optical absorption makes them useful partners for silicon, but stacking useful layers is not enough. In a series-connected tandem, both subcells must pass the same current. An upper cell that absorbs too much of the light needed below can leave the lower cell short of current. The transparent contacts must also conduct without wasting much light.
A laboratory efficiency record therefore answers a narrower question than whether a roof product is ready. Compare the illuminated area and whether the result used concentrated sunlight before comparing percentages. Packaging and long-term stability matter as well: DOE identifies durability and scaling manufacturing as continuing challenges for perovskites. The research-cell chart measures conversion performance under specified conditions; it does not certify that every technology on it will retain that performance outdoors for decades.
A panel does not stop on its warranty anniversary
A cloudy sky still supplies diffuse light, although thick cloud can reduce output sharply. The clear-sky controls here cannot reproduce a particular overcast day. Lowering Sun height changes atmospheric path length and incidence angle together, so it is not a cloud-opacity control. Likewise, Cell temperature changes the electrical response, not the weather. Treat those as distinct experiments rather than ways to reproduce a local forecast.
Ageing is different from a hot afternoon. Much of the temperature-related power drop reverses when the panel cools. Long-term degradation can involve damaged encapsulation or electrical connections and is not undone by waiting for evening. NLR's Photovoltaic Lifetime Project reports that modules often lose less than 1 % of performance per year, while emphasising that slow changes are difficult to distinguish from measurement uncertainty early in life. This is not a guaranteed rate for every module or climate.
For an arithmetic example only, assume a constant annual retention factor of 0.995. After 25 years a panel retains 0.995^25 ≈ 0.882, or 88.2 %, of its starting power under the same test conditions. Actual ageing need not follow that curve, and a sudden component failure is different from gradual degradation. A performance warranty sets contractual conditions; it is not a timer that switches the silicon off. Replacing an inverter also does not necessarily mean replacing every panel.
Three comparisons on the screen
First set Sun height to 60°, Panel tilt to 30°, Cell temperature to 25 °C and Leaf on one cell to 0 %. Keep Bypass diodes on. The panel faces the beam squarely. Change only Panel tilt to 0° and compare Module power. The Sun height has not changed, so the atmosphere has not become thicker; the difference mainly comes from the panel's orientation. For the winter comparison use Sun height 29° and Panel tilt 61°, the geometrical optimum, where the beam meets the panel square on.
Next restore the starting angles and compare Cell temperature at 25 °C and 65 °C. Watch the power-versus-voltage curve move toward lower voltage. Finally restore 25 °C, cover the cell fully with Leaf on one cell and switch Bypass diodes off and on. Compare Shaded cell heat as well as Module power: recovering useful output does not mean the shaded cell becomes cold. At partial coverage, repeat the comparison at 30 %. These controls show why bypass protection reduces a hazard without making every shadow harmless.
Two hills on the power curve
Open the I-V bench in the Controls tab and the panel is tested the way a laboratory tests it. The black line is current against voltage. With nothing connected the panel sits at its open-circuit voltage, 40.8 V in full sun at 25 °C, and no current flows. Short the two cables together and the current is 9.8 A at 0 V. Neither end gives any power, because power is voltage times current and one of them is zero. The orange line is that product. It rises from zero, peaks at 307 W at 33.1 V, then falls steeply to zero again at 40.8 V. That top is the maximum power point. The fill factor compares it with the rectangle 40.8 V × 9.8 A: 307 ÷ 400 ≈ 0.77, which PVEducation describes as the measure of how square the I-V curve is.
The inverter does not know where the top is. It has to find it by trying. The simplest way is called perturb and observe: nudge the voltage a little, see whether the power went up, keep going if it did and turn round if it did not. In the bench the tracker starts just below open-circuit voltage, as many inverters do in the morning, and steps by 1.2 % of that voltage at a time. On a clean panel it climbs the one hill and then rocks back and forth at the top.
A leaf changes the shape of the hill. Cover 60 % of one cell and its group of 20 cells can no longer carry the full current. Below about 3.9 A the shaded cell still keeps up, so the right-hand part of the curve barely changes. Above that the shaded cell is driven backwards until the bypass diode of its group switches on, and from then on the panel runs on two thirds of its cells. The power curve is no longer a single hill. Coming from the right, the first peak is 151 W at 38.7 V; the highest is 200 W at 21.6 V on the left. A tracker that starts from the right climbs the first peak it meets and stops there, because every small step away from 151 W makes the power fall. Press Full sweep and the bench tries every voltage from 0 to 40.8 V, then moves the tracker to the higher hill. PVEducation's page on mismatch effects explains the cause: in cells wired in series, the cell with the lowest output limits all the others.
Switch the bench to the string of ten panels and the same leaf hardly shows. One bypassed group of 20 cells is 1 part in 30 of the string's 300 cells, so the string still has a single hill at about 2.96 kW. The model can shade only one cell; on a real roof, several panels shaded by different amounts can give a string several hills.
The One cell view plots current density in milliamperes per square centimetre, the unit research cells are reported in. The model cell gives 39.9 mA/cm² at short circuit (9.8 A spread over 245.7 cm²). Open a record cell in the catalogue and its own curve is drawn in grey beside the model, shaped from the open-circuit voltage, current density and fill factor in the NLR data table.
Where the sun is: the NOAA equations
The Sun height slider keeps the sun on its noon arc due south. The Sun and day tab instead puts it where it really is for a chosen place, date and clock time, using the same equations as the solar calculator of the NOAA Global Monitoring Laboratory, which are based on Jean Meeus's Astronomical Algorithms.
The calculation starts from the date. It is turned into a Julian day and then into Julian centuries since noon on 1 January 2000. From that come the sun's mean longitude and mean anomaly, the equation of centre (the correction for Earth's elliptical orbit), the sun's apparent longitude and the tilt of Earth's axis, 23.44° at present. The declination, how far north or south of the equator the sun stands, follows from those two angles. On 21 December 2026 it is −23.44°.
The equation of time is the difference between a sundial and a clock. On 21 December it is +2.1 minutes: the sun is two minutes ahead of the clock average. Seoul also sits at 127° east, 8° west of the 135° meridian its time zone uses, and each degree of longitude is four minutes of time. Put together, the sun crosses the meridian in Seoul at 12:30, not 12:00. At 12:00 on the clock the hour angle is still 7.5° to the east, the sun is 28.6° above the horizon, and its azimuth is 172.2°, 8° east of due south. NOAA's last step adds the bending of light by the air, a few hundredths of a degree at that height and about half a degree at the horizon. Sunrise and sunset are the moments the sun's centre stands 0.833° below the horizon, which gives 07:43 and 17:17 for Seoul that day.
The exhibit's version of these equations was checked against the NOAA page's own code for six places and times, from Seoul to Tromsø and Sydney: elevations and azimuths agree to better than a ten-thousandth of a degree.
A whole clear day
With the sun's position known for every minute, the energy of a day is a sum. Every five minutes the exhibit works out the direct beam for that height of sun (the same air-mass formula as before), the angle between the beam and the panel, now including the difference in azimuth, adds 10 % diffuse light and finds the panel's maximum power. The chart in the Sun and day tab draws the result from midnight to midnight and the area under it is the day's energy.
On 21 December in Seoul a panel tilted 33° and facing south makes 1.36 kWh on a clear day, and the ten-panel array gives 13.2 kWh after the inverter. Flat on the roof the same panel makes 0.76 kWh. The best tilt for that single day is 62°, almost square to the low winter sun, and it gives 1.55 kWh. On 21 June the picture flips: the sun climbs to 76°, a 30° panel makes 2.37 kWh, and the best tilt for that day is only 2°. A fixed installation has to pick one tilt for the whole year, so it ends up somewhere between these two extremes.
Turn the Panels face slider and the array turns on the roof. At 30° tilt an east-facing array in Seoul makes 54 % of the south-facing energy on 21 December, but in June it makes as much as the south-facing one, because the summer sun rises in the north-east and spends the morning in front of it.
Far north the day changes completely. In Tromsø, at 69.65° north, the sun stays below the horizon all day on 21 December and the array makes nothing. On 21 June it never sets: at midnight on the local summer-time clock it is still 3.7° above the northern horizon, and a panel facing south makes 2.58 kWh, a little more than in Seoul, because the sun is up for 24 hours.
Six ways to build a silicon cell
The slice on the right was drawn as the classic cell: a p-type wafer, a phosphorus-doped emitter on top and aluminium fired across the whole back, which leaves a heavily doped layer called a back surface field. The US Department of Energy notes that these aluminium back surface field (Al-BSF) cells dominated the market until about 2018, when PERC designs overtook them, and that a further shift is under way to n-type cells such as silicon heterojunction and TOPCon. The Cell sections tab rebuilds the slice for each design.
PERC (passivated emitter and rear cell) puts a thin dielectric layer of aluminium oxide and silicon nitride across the back. Bare silicon surfaces are places where electrons and holes meet and are lost; the dielectric calms them. The aluminium now reaches the silicon only through small openings.
TOPCon (tunnel oxide passivated contact) goes further at the back. Fraunhofer ISE, where the contact was developed, describes it as an ultra-thin tunnel oxide under a thin layer of doped silicon; in industrial cells the oxide is typically 1 to 2 nm thick and the polysilicon about 80 nm. The oxide is thin enough to let the majority carriers, here electrons, through by tunnelling, while it keeps the other carriers away from the metal. The wafer is n-type and the emitter on the front is diffused with boron, so the roles of the layers swap: in the slice, holes now go to the front fingers and electrons to the back.
Heterojunction cells coat both faces of an n-type wafer with very thin layers of amorphous silicon, an undoped layer next to the wafer and a doped one outside it, then a transparent conducting oxide such as indium tin oxide. Forschungszentrum Jülich lists only four process steps and notes that the amorphous layers must stay below about 200 °C, so the silver paste is cured at that temperature instead of being fired. Its heterojunction cells lose less than 0.3 % of their power per degree of heating, against roughly 0.4 % for the cell in this model.
Back-contact cells (IBC, interdigitated back contact) move all the metal to the back. Stripes of n+ and p+ silicon alternate under the wafer, each with its own contact, so the front has no fingers to shade it. The Department of Energy describes them as harder to manufacture. The best silicon cells in the NLR table, 28.1 %, combine this layout with heterojunction layers.
Perovskite on silicon stacks a second cell on top. The perovskite absorbs blue and green light and gives a higher voltage for each photon; red and near-infrared light passes through to the silicon below. The two cells are joined by a thin recombination layer and carry the same current. In the slice the perovskite is the dark brown band between its transport layers.
The slice exaggerates every layer. The tunnel oxide in a real TOPCon cell is about a hundred-thousandth of the wafer's thickness.
Reading the efficiency table
The catalogue lists the best cell of each type in the NLR (formerly NREL) data table, one entry per row of the efficiency chart. Each record gives the efficiency, the month it was measured, the group that made the cell, and for most entries the independent test centre that confirmed it (ISFH, NREL, Fraunhofer ISE, JRC-ESTI and others). The open-circuit voltage, short-circuit current density and fill factor multiply out to the efficiency: under the standard 100 mW/cm² of light, efficiency in percent equals Voc × Jsc × FF. For 19 of the 27 records the table gives all three, and for 18 of them the product matches the listed efficiency within 2 %. Only those get a curve on the I-V bench.
The areas tell their own story. The best perovskite cell, 28.0 %, was 0.051 cm², a few millimetres across. The best TOPCon cell, 26.68 %, was a full 350 cm² wafer. Concentrator records are measured under many suns: the 47.6 % four-junction cell from Fraunhofer ISE worked under light 665 times stronger than sunlight on a cell of 0.0452 cm². The model panel's 18.8 % is a whole module, with frame, gaps and ribbons, in ordinary sunlight.
Solar cells in space and in the desert
Solar cells reached space before they reached roofs. Vanguard 1, launched on 17 March 1958, was the first solar-powered satellite, and NASA notes it is still the oldest human-made object in orbit. The International Space Station carries 262,400 cells on about 2,500 m² of arrays; the four sets of arrays give 84 to 120 kW, and while the station is in sunlight about 60 % of that charges the batteries for the dark part of each orbit.
Farther from the Sun the light thins out. Jupiter is about five times farther away than Earth, so its sunlight is about 25 times weaker. Juno's three 9 m arrays carry 18,698 cells and would make about 14 kW at Earth's distance; at Jupiter NASA's press kit gives about 400 W. On Mars, InSight's arrays made about 5,000 Wh per Martian day after landing in 2018; by spring 2022 dust had cut that to about 500 Wh.
On the ground the largest plants are measured in gigawatts. Al Dhafra, about 35 km from Abu Dhabi, uses almost 4 million bifacial crystalline panels; its operator EWEC lists 1.5 GW of AC capacity and the developer Masdar 2 GW. Noor Abu Dhabi at Sweihan has about 3.2 million panels on 7.8 km². Opening either in the catalogue moves the Sun and day tab to Abu Dhabi, where the winter noon sun stands 42° high on 21 December.
Questions
How does a solar cell make electricity?
Light frees electrons inside a slice of silicon. An electric field at the junction between n-type and p-type silicon pushes the electrons one way and the holes the other, so a voltage builds up between the front and back. Join them with a wire and a current flows.
Why are solar cells blue or black?
The surface is etched into tiny pyramids and coated with a thin film, usually silicon nitride, that cancels most reflections. The little light that still comes back is mostly blue. Cells with very fine texturing and a different coating look nearly black.
Do solar panels work on cloudy days?
Yes, usually with less power. Clouds scatter sunlight; depending on cloud cover, diffuse light and some direct light can reach the panel. Power is roughly proportional to the light on the panel. In the model, cutting the light from 1,000 to 200 W/m² cuts a panel from 307 W to 60 W.
Why does heat reduce solar panel output?
Heat makes more electrons and holes by itself, so the junction leaks more current backwards and the voltage drops. For silicon panels the loss is about 0.4 % of power for each degree above 25 °C. A panel at 65 °C gives about 16 % less than its label.
What is the best tilt angle for solar panels?
The light is strongest when the panel faces the sun square on, so the best tilt is 90° minus the sun height. Because the sun height changes with the season, a fixed panel is usually tilted near the latitude. In Seoul that is about 30° to 35°.
What does a bypass diode do?
It lets the current skip a group of cells when one of them is shaded. Without it the shaded cell is forced to carry the full current in reverse and heats up. In this model it can bypass one third of the panel, reducing the loss and reverse-bias heating. It does not eliminate hot spots: the shaded cell can still dissipate substantial heat.
What is the maximum efficiency of a silicon solar cell?
The Shockley-Queisser limit for a single junction is about 33 %, with the peak of 33.16 % at a band gap of 1.34 eV. The best silicon research cell on NLR's chart reaches 28.1 %. Panels sold for roofs are mostly around 20 %.
Why do solar panels need an inverter?
Panels make direct current and houses use alternating current. The inverter converts one into the other and also tracks the voltage at which the panels give the most power.
Is a 400 W panel a 400 Wh battery?
No. The rating describes power under reference test conditions, not stored energy. At a constant 400 W for 1 hour it would generate 400 Wh. The exhibit contains no battery.
Does a 25-year warranty mean a panel stops after 25 years?
No. A warranty specifies contractual coverage and performance conditions. Gradual degradation and sudden failures are separate possibilities; a panel can continue generating after the warranty expires.
What is maximum power point tracking, and why can it get stuck?
An inverter keeps adjusting the voltage of the panels to find the one that gives the most power. The common perturb-and-observe method nudges the voltage and keeps going in whichever direction raised the power. When shade puts more than one peak on the power curve, the tracker can stop on a smaller one. In the exhibit, 60 % of one cell shaded leaves the tracker at 151 W while 200 W is available at a lower voltage; a full sweep of the curve finds it.
Which way should solar panels face?
Towards the equator gives the most energy over a year: south in the northern hemisphere. The loss from facing east or west depends on the season. In the model at 30° tilt in Seoul, an east-facing array makes 54 % of the south-facing energy on 21 December and about the same as the south-facing one on 21 June.
What is the difference between PERC, TOPCon and heterojunction cells?
All three are crystalline silicon. PERC covers the back of a p-type wafer with a passivating layer and lets the aluminium touch it only through small openings. TOPCon uses an n-type wafer with an ultra-thin tunnel oxide and doped polysilicon at the back. Heterojunction cells coat both faces of an n-type wafer with thin amorphous silicon and a transparent conducting oxide. The US Department of Energy describes the market moving from Al-BSF to PERC around 2018 and now towards TOPCon and heterojunction.
Terms
- Photovoltaic effect: light making a voltage and current directly in a material.
- n-type silicon: silicon with a little phosphorus added, which gives it spare electrons.
- p-type silicon: silicon with a little boron added, which leaves holes.
- Hole: a missing electron in a bond. It moves like a positive charge.
- pn junction: the boundary between n-type and p-type material.
- Depletion region: the strip at the junction with no free charges, only fixed ions and an electric field.
- Band gap: the least energy needed to free an electron, 1.12 eV for silicon.
- Recombination: an electron falling back into a hole, losing the energy as heat.
- Anti-reflection coating: a thin transparent film that cancels reflected light by interference.
- Air mass (AM): the length of the sunlight's path through the air compared with the path from straight overhead.
- Irradiance: the power of light per square metre, in W/m².
- Maximum power point: the voltage and current at which a cell or panel gives the most power.
- Bypass diode: a diode across a group of cells that carries the current round them when one is shaded.
- Hot spot: a shaded cell driven into reverse that heats up.
- Inverter: a device that turns direct current into alternating current.
- Shockley-Queisser limit: the highest efficiency a single-junction cell can reach under sunlight.
- I-V curve: current against voltage for a cell or panel, from short circuit to open circuit.
- Fill factor: maximum power divided by open-circuit voltage times short-circuit current; a measure of how square the I-V curve is.
- Perturb and observe: a tracking method that changes the voltage in small steps and keeps the direction that raised the power.
- Declination: the angle of the sun north or south of the equator, from +23.44° in June to −23.44° in December.
- Equation of time: the difference between sundial time and clock time, up to about 16 minutes.
- Solar noon: the moment the sun crosses the meridian and stands highest that day.
- Azimuth: the compass direction, measured clockwise from north (90° east, 180° south).
- TOPCon: tunnel oxide passivated contact, an ultra-thin oxide under doped polysilicon.
- Heterojunction: a junction between crystalline silicon and thin amorphous silicon layers.
- IBC: interdigitated back contact, a cell with all its contacts on the back.
Sources
National Laboratory of the Rockies (NLR), Best Research-Cell Efficiency Chart. https://www.nlr.gov/pv/cell-efficiency (checked 16 October 2026)
NLR, Best research-cell efficiency data table (records for crystalline silicon, perovskite/silicon tandem and III-V multijunction cells). https://www.nlr.gov/docs/libraries/pv/cell-efficiency-data-table.xlsx (checked 16 October 2026)
NLR, Reference Air Mass 1.5 Spectra. https://www.nlr.gov/grid/solar-resource/spectra-am1.5 (checked 16 October 2026)
PVEducation, Air Mass (direct-beam formula, diffuse light on a clear day, Kasten and Young). https://www.pveducation.org/pvcdrom/properties-of-sunlight/air-mass (checked 16 October 2026)
PVEducation, Arbitrary Orientation and Tilt. https://www.pveducation.org/pvcdrom/properties-of-sunlight/arbitrary-orientation-and-tilt (checked 16 October 2026)
PVEducation, Formation of a PN Junction. https://www.pveducation.org/pvcdrom/pn-junctions/formation-of-a-pn-junction (checked 16 October 2026)
PVEducation, The Photovoltaic Effect. https://www.pveducation.org/pvcdrom/solar-cell-operation/the-photovoltaic-effect (checked 16 October 2026)
PVEducation, Anti-Reflection Coatings. https://www.pveducation.org/pvcdrom/design-of-silicon-cells/anti-reflection-coatings (checked 16 October 2026)
PVEducation, Effect of Temperature. https://www.pveducation.org/pvcdrom/solar-cell-operation/effect-of-temperature (checked 16 October 2026)
PVEducation, Nominal Operating Cell Temperature. https://www.pveducation.org/pvcdrom/modules-and-arrays/nominal-operating-cell-temperature (checked 16 October 2026)
PVEducation, Hot Spot Heating. https://www.pveducation.org/pvcdrom/modules-and-arrays/hot-spot-heating (checked 16 October 2026)
PVEducation, Bypass Diodes. https://www.pveducation.org/pvcdrom/modules-and-arrays/bypass-diodes (checked 16 October 2026)
PVEducation, Fill Factor. https://www.pveducation.org/pvcdrom/solar-cell-operation/fill-factor (checked 16 October 2026)
US Department of Energy, How Does Solar Work? https://www.energy.gov/eere/solar/how-does-solar-work (checked 16 October 2026)
US Department of Energy, Solar Integration: Inverters and Grid Services Basics. https://www.energy.gov/eere/solar/solar-integration-inverters-and-grid-services-basics (checked 16 October 2026)
American Physical Society, This Month in Physics History: April 25, 1954: Bell Labs Demonstrates the First Practical Silicon Solar Cell. https://www.aps.org/publications/apsnews/200904/physicshistory.cfm (checked 16 October 2026)
J. Sharir-Smith, The Shockley-Queisser Limit and Tandem Solar Cells, Stanford University PH240 (2024), citing S. Rühle, Tabulated values of the Shockley-Queisser limit for single junction solar cells, Solar Energy 130 (2016) 139-147. http://large.stanford.edu/courses/2024/ph240/sharir-smith1/ (checked 16 October 2026)
Ossila, Radiative Efficiency Limit: The SQ Limit Explained. https://www.ossila.com/pages/radiative-efficiency-limit (checked 16 October 2026)
Model values (the one-diode cell, 60-cell panel, 10-panel string, air mass and cosine law, temperature, shade and bypass figures) were worked through by hand.
US Department of Energy, Perovskite Solar Cells (absorbers, tandems, durability and manufacturing). https://www.energy.gov/eere/solar/perovskite-solar-cells (checked 23 October 2026)
NLR, Photovoltaic Lifetime Project (degradation measurements and uncertainty). https://www.nlr.gov/pv/lifetime (checked 23 October 2026)
NOAA Global Monitoring Laboratory, NOAA Solar Calculator (its page code was used to check the sun positions, solar noon and sunrise times). https://gml.noaa.gov/grad/solcalc/ (checked 27 October 2026)
NOAA Global Monitoring Laboratory, Solar Calculation Details (equations from Meeus, Astronomical Algorithms). https://gml.noaa.gov/grad/solcalc/calcdetails.html (checked 27 October 2026)
PVEducation, Declination Angle. https://www.pveducation.org/pvcdrom/properties-of-sunlight/declination-angle (checked 27 October 2026)
PVEducation, Elevation Angle. https://www.pveducation.org/pvcdrom/properties-of-sunlight/elevation-angle (checked 27 October 2026)
PVEducation, Azimuth Angle. https://www.pveducation.org/pvcdrom/properties-of-sunlight/azimuth-angle (checked 27 October 2026)
PVEducation, Solar Time (equation of time, time correction for longitude). https://www.pveducation.org/pvcdrom/properties-of-sunlight/solar-time (checked 27 October 2026)
PVEducation, IV Curve. https://www.pveducation.org/pvcdrom/solar-cell-operation/iv-curve (checked 27 October 2026)
PVEducation, Mismatch Effects. https://www.pveducation.org/pvcdrom/modules-and-arrays/mismatch-effects (checked 27 October 2026)
PVEducation, Solar Cell Structure. https://www.pveducation.org/pvcdrom/solar-cell-operation/solar-cell-structure (checked 27 October 2026)
US Department of Energy, Crystalline Silicon Photovoltaics Research (Al-BSF, PERC, TOPCon, silicon heterojunction and IBC cells). https://www.energy.gov/eere/solar/crystalline-silicon-photovoltaics-research (checked 27 October 2026)
Fraunhofer ISE, TOPCon: Overcoming Fundamental Bottlenecks to a New World-Record Silicon Solar Cell. https://www.ise.fraunhofer.de/en/research-projects/topcon.html (checked 27 October 2026)
S. Mack et al., Status and Perspective of Industrial TOPCon Solar Cell Development at Fraunhofer ISE, WCPEC-8 (2022) (tunnel oxide 1 to 2 nm, polysilicon 80 nm). https://www.ise.fraunhofer.de/content/dam/ise/de/documents/publications/conference-paper/wcpec-8/Mack_1AO63.pdf (checked 27 October 2026)
Forschungszentrum Jülich, IMD-3, Silicon Heterojunction Solar Cells. https://www.fz-juelich.de/en/imd/imd-3/research/pv-technology-synergy-cluster-pv-thync/silicon-heterojunction-solar-cells (checked 27 October 2026)
NASA, Vanguard Satellite, 1958. https://www.nasa.gov/image-article/vanguard-satellite-1958/ (checked 27 October 2026)
NASA, Solar Arrays on the International Space Station. https://www.nasa.gov/image-article/solar-arrays-international-space-station-2/ (checked 27 October 2026)
NASA JPL, Juno Jupiter Orbit Insertion Press Kit: Fast Facts. https://www.jpl.nasa.gov/news/press_kits/juno/facts (checked 27 October 2026)
NASA JPL, NASA's Juno Spacecraft Breaks Solar Power Distance Record (2016). https://www.jpl.nasa.gov/news/nasas-juno-spacecraft-breaks-solar-power-distance-record (checked 27 October 2026)
NASA Science, InSight's Power Generation: After Landing and Spring 2022. https://science.nasa.gov/resource/insights-power-generation-after-landing-and-spring-2022 (checked 27 October 2026)
Emirates Water and Electricity Company, Al Dhafra Solar PV. https://ewec.ae/existing-plant/al-dhafra-solar-pv (checked 27 October 2026)
Masdar, Deputy Ruler of Abu Dhabi Inaugurates World's Largest Single-Site Solar Power Plant Ahead of COP28 (2023). https://masdar.ae/en/news/newsroom/worlds-largest--single-site-solar-power-plant-inaugurated (checked 27 October 2026)
Sweihan PV Power Company, Noor Abu Dhabi Green Bond Framework (panels and area). https://noorabudhabi.ae/wp-content/uploads/2022/04/Noor-Abu-Dhabi-Green-Bond-Framework.pdf (checked 27 October 2026)
More exhibits
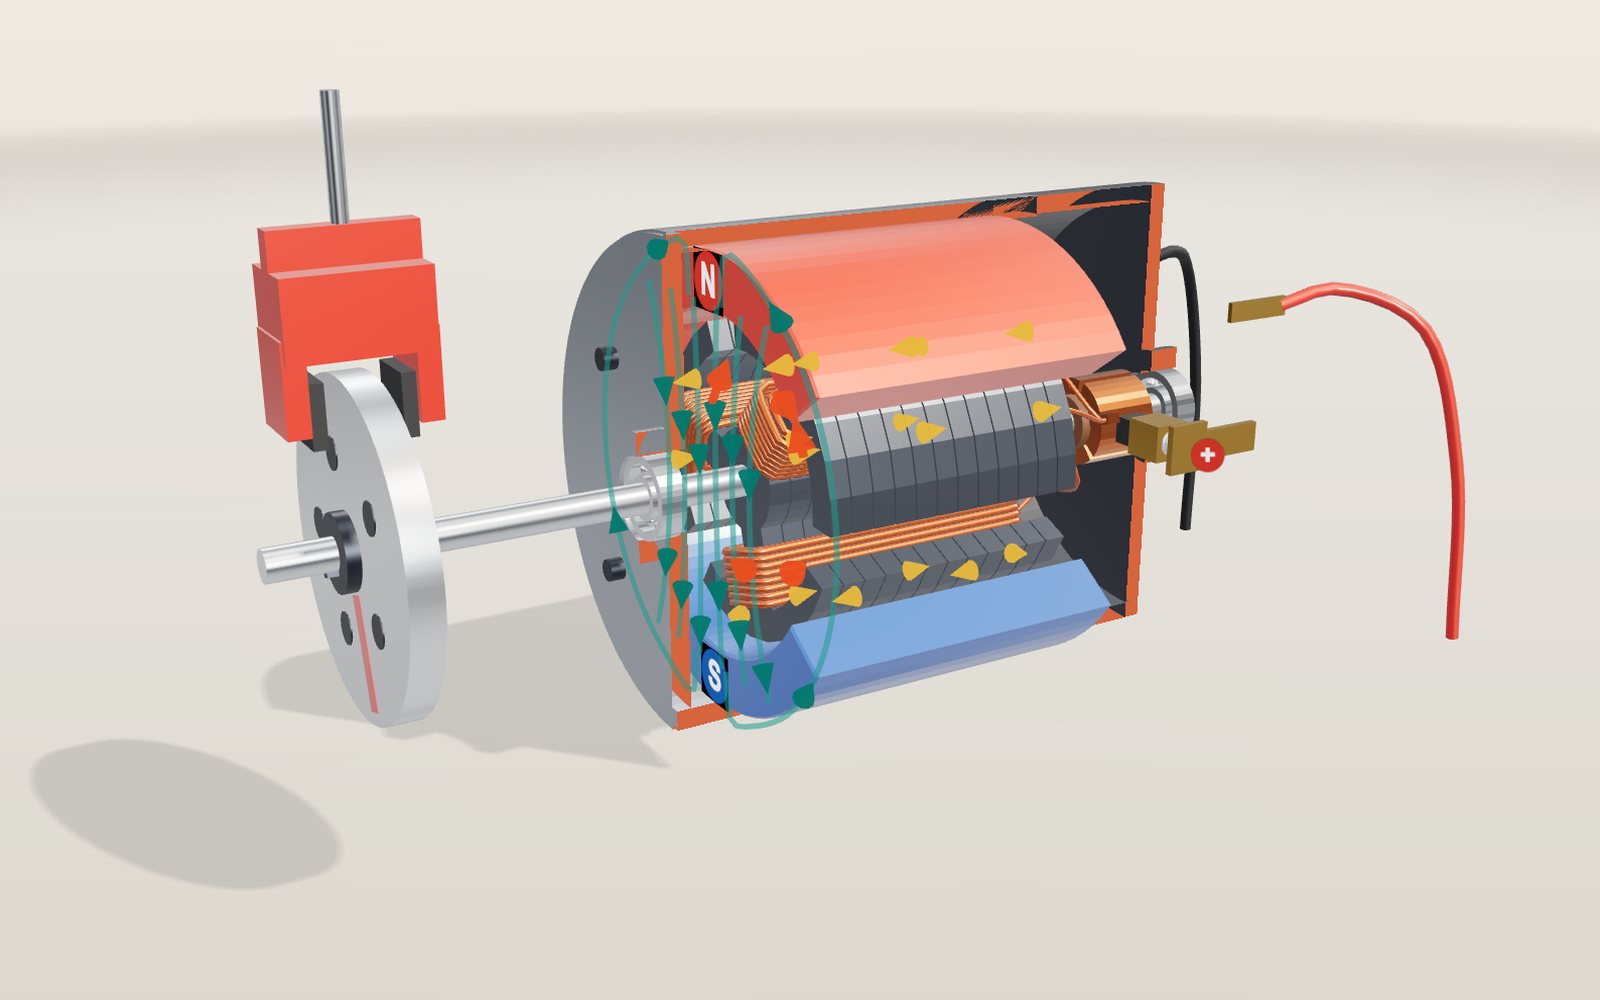
Electric motor simulator: how it works, step by step
Eight motors, from Faraday's wire in mercury in 1821 to the magnets inside an electric car, all turning on the same push between current and field.
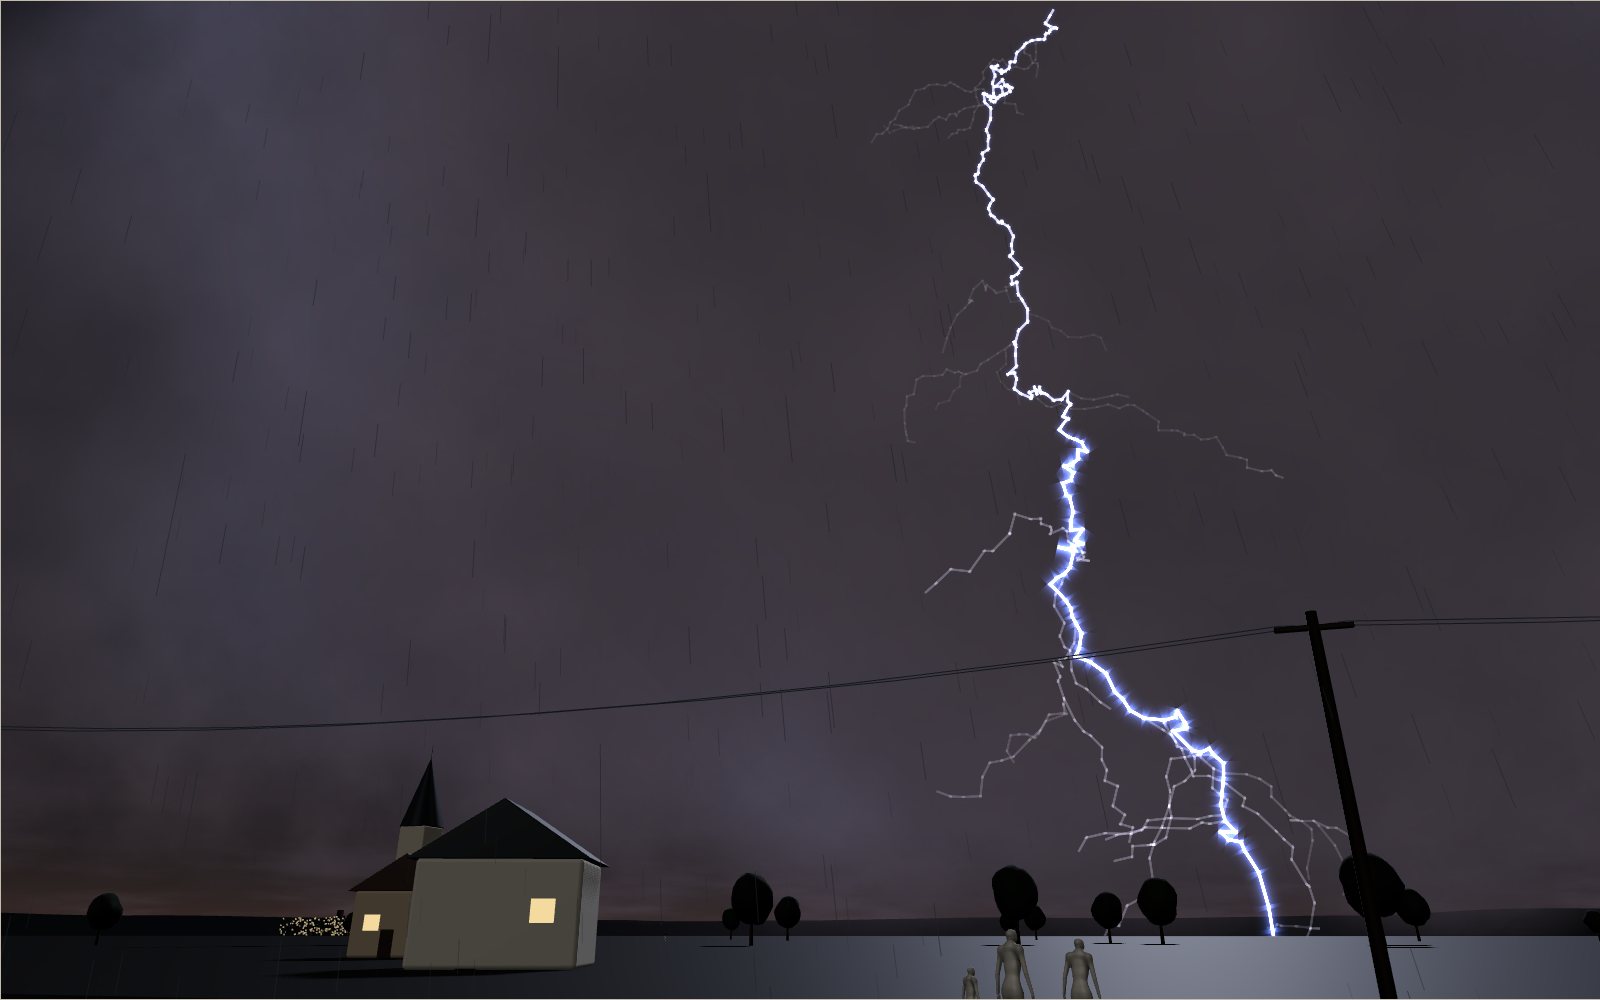
How lightning and thunder work
A lightning channel heats the air to about five times the temperature of the Sun’s surface, and its thunder needs about 3 seconds to cover each kilometre to you.
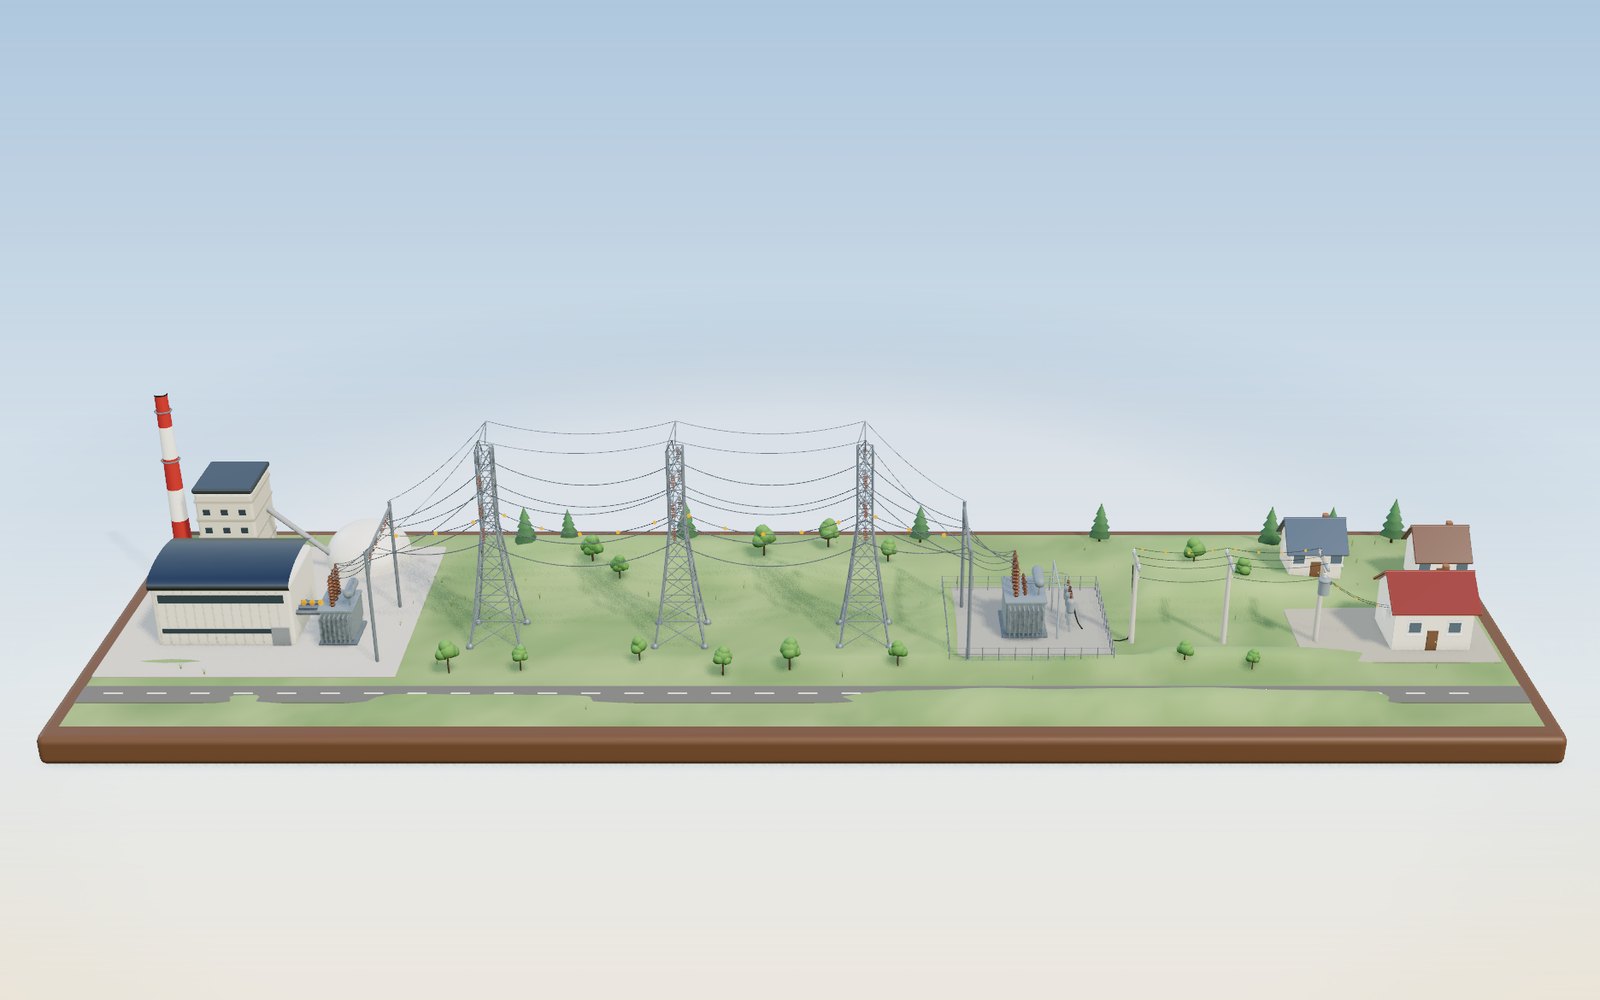
How electricity gets to your home
Electricity leaves the power station at 345,000 volts and reaches the outlet at 220, because high voltage keeps the current, and the heat lost in the wires, small.
How a lithium-ion battery works: where the ions go on charge
Each time an 18650 cell charges, about 7 × 10²² lithium ions leave a metal oxide and squeeze in between sheets of graphite.
How a microwave oven works: the magnetron that makes the waves
The waves inside a microwave oven are 12.2 cm long, so without a turntable the hot spots in your food sit about 6 cm apart.
How a touchscreen works: how the glass finds your finger
Under the glass of a phone lies a grid of transparent electrodes, and your finger shows up as a small dip in the charge passing between them.