FIG. 44How It Works
How electricity gets to your home
Electricity leaves the power station at 345,000 volts and reaches the outlet at 220, because high voltage keeps the current, and the heat lost in the wires, small.
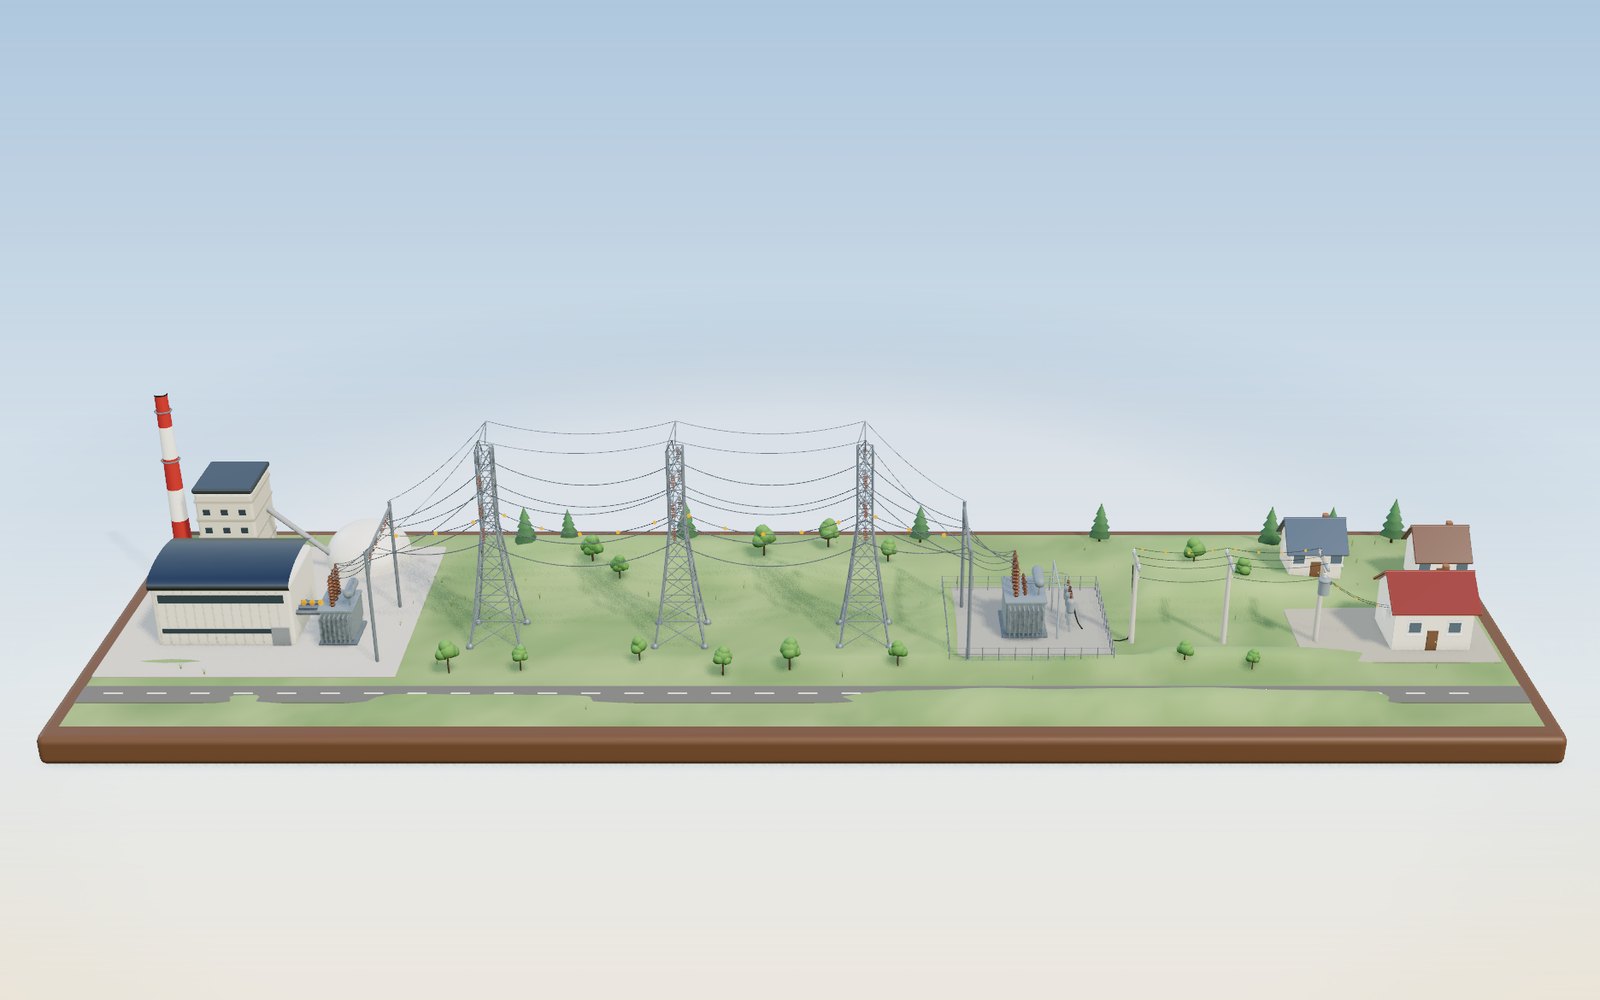
This device cannot show the 3D model. You can read the guide steps below as text.
1 / 18 From a power station to your outletElectricity made in the station on the left reaches the lamp in the house on the right almost at once. The tags show the voltage and current at each stage, and the orange beads show the current swinging back and forth, slowed 60 times. The buttons along the top open eight more scenes.
Drag to turn. Scroll or pinch to zoom.
What the model shows
Switch on a lamp and it lights at once, even though the power station feeding it may be a hundred kilometres away. Between the generator and the wall there are at least three transformers, a few hundred tonnes of steel towers and a lot of aluminium wire. On the way the voltage climbs from about twenty thousand volts to 345,000, then falls to 22,900 and finally to 220.
The model lays that path out on one table, left to right. A power station with a steam turbine and a generator stands on the left. Next to it a step-up transformer feeds a 345 kV double-circuit line on three lattice towers. The line ends at a fenced substation, where a second transformer brings the voltage down to 22.9 kV for a feeder on concrete poles. A pole transformer on the last pole makes 220 V for a house, and inside the house a lamp is plugged into a wall outlet.
Tags in the scene show the voltage and current at each stage. The readout in the corner shows the power being sent, the line voltage and current, the heat lost in the line, and the frequency. The voltage slider changes the transmission voltage while the power stays the same, so you can see what that does to the current and the loss. The demand and generator output sliders let you unbalance the system and watch the frequency move. The orange beads ride on one wire of each section and swing back and forth with the alternating current, slowed down 60 times.
The voltages are the ones used in Korea. KEPCO (Korea Electric Power Corporation) runs 765 kV, 345 kV and 154 kV transmission lines, and the Korea Power Exchange's operating rules set the targets for 22.9 kV distribution and for a 60 Hz frequency. The rest of the numbers belong to the model and are labelled as model values.
Above the stage, the buttons open eight more scenes: kinds of power station, a day of demand, frequency control, the inside of a transformer, a tower top, HVDC under the sea, a cascading blackout and the panel in a house. Under the stage, ten tasks and 36 cases from the history of the grid can be set up on the model.
Why the voltage has to be raised for the trip
The station has to push 500 MW down the line. Power is voltage times current, so the same 500 MW can be sent as a low voltage with a large current or a high voltage with a small current. For a three-phase line with the current in step with the voltage, P = √3 × V × I, where V is the voltage between two of the wires.
The choice matters because of the wire. Aluminium is a good conductor, but 100 km of it still has resistance. The model gives each phase of the line 3 ohms (0.03 Ω per km, a model value). A current I flowing through a resistance R turns I² × R watts into heat, and there are three phases, so the line loses 3 × I² × R.
Put the two formulas together and the current drops out: the loss equals R × P² / V². The loss goes up with the square of the power and down with the square of the voltage. Halve the voltage and the loss is four times bigger. That square is the reason transmission towers are so tall and their voltages so high.
The numbers, worked out
Here are the model's figures for 500 MW over the same 3-ohm line:
| Line voltage | Current | Loss | Share of 500 MW | Heat per metre of each wire |
|---|---|---|---|---|
| 765 kV | 377 A | 1.28 MW | 0.26 % | 4.3 W |
| 345 kV | 837 A | 6.30 MW | 1.26 % | 21 W |
| 154 kV | 1,875 A | 31.6 MW | 6.32 % | 105 W |
| 66 kV | 4,374 A | 172 MW | 34.4 % | 574 W |
| 22.9 kV | 12,606 A | 1,430 MW | 286 % | 4,767 W |
At 345 kV the line carries 837 A and wastes 6.3 MW, about 1 % of what it carries. Drop to 154 kV and the current more than doubles, to 1,875 A, and the loss is five times bigger: (345 / 154)² = 5.02. At the distribution voltage of 22.9 kV the formula says the line would turn 1,430 MW into heat, nearly three times the power being sent. That row is not a real operating point. Long before that, the voltage at the far end would collapse and the wire would overheat and sag into the trees. It is there to show how fast the square runs away.
In the model the wires warm up as you lower the voltage: they turn yellow, then orange, then red, and they sag lower. The sag is real physics. A hot aluminium wire is longer than a cool one, and a longer wire between the same two towers hangs lower. That is one reason a line has a limit on how hot its conductors may run, so that a heavily loaded line on a summer afternoon still clears the ground.
For comparison, the U.S. Energy Information Administration estimates that transmission and distribution losses in the United States averaged about 5 % of the electricity carried from 2018 to 2022.
How a transformer swaps voltage for current
Raising the voltage would be useless if it were hard to do. The transformer makes it easy. Two coils share one iron core. An alternating current in the first coil makes an alternating magnetic field in the core, and that changing field induces a voltage in every turn of the second coil. Each turn of either coil sees the same voltage, so the voltage across a coil is proportional to its number of turns:
V₂ / V₁ = N₂ / N₁
Power in is nearly equal to power out, because a large transformer wastes only a small fraction of what passes through it. So the current goes the other way: I₂ / I₁ = N₁ / N₂.
Switch on See inside at the step-up transformer and you will find the model's windings. The low-voltage coil has 5 thick turns and the high-voltage coil has 78 thin ones, a ratio of 1 : 15.6, close to the 1 : 15.7 needed to go from the generator's 22 kV (a model value) to 345 kV. The thick wire carries 13,100 A and the thin wire only 837 A. Drag the voltage slider and the number of turns on the high-voltage coil follows it, from 5 turns at 22.9 kV to 174 at 765 kV. Real windings have hundreds or thousands of turns, but the ratio is what counts.
The substation does the opposite with a ratio of about 15 : 1 (345 kV down to 22.9 kV), and the pole transformer on the street does it again at 60 : 1.
Why the grid uses alternating current at 60 hertz
A transformer only works if the magnetic field keeps changing, so it needs alternating current. That was the argument that settled the "War of the Currents" in the 1890s, when Thomas Edison's direct current lost out to the alternating current promoted by George Westinghouse and Nikola Tesla.
The generator makes the alternation directly. Its rotor is an electromagnet, and as it turns, each pole sweeps past the stator coils and the voltage in them rises and falls. With two poles, one turn of the rotor gives one full cycle, so 60 cycles a second needs 3,600 turns a minute. With four poles it needs 1,800. The red marks on the model's shaft turn once a second at 60 Hz, sixty times slower than the real thing.
The outlet voltage follows the same sine wave. The readout chart shows three cycles, which take 50 milliseconds. The peak is 311 V; the "220 V" printed on appliances is the effective value, the steady voltage that would heat a resistor by the same amount (311 / √2 = 220).
From 22.9 kV to 220 V on your street
The feeder leaving the substation has three phase wires on the crossarm and a neutral wire below. Between any two phase wires there are 22,900 V. Between one phase wire and the neutral there are 22,900 / √3 = 13,221 V, usually written 13.2 kV.
A pole transformer for houses is connected between one phase and the neutral. Its windings have a ratio of about 60 : 1, so 13,200 V in gives 220 V out. In the model one pole transformer serves about ten houses drawing 30 kW in all: 2.3 A on the high-voltage side and 136 A on the 220 V side. A single house drawing 3 kW takes 13.6 A from its outlet.
Korean rules set the allowed band at the outlet. The Enforcement Rule of the Electricity Business Act lists 220 V with a tolerance of 22 V either way (198 V to 242 V), and 60 Hz with a tolerance of 0.2 Hz.
Why the frequency shows whether supply matches demand
A grid has almost no storage of its own. The power going out to every kettle and factory has to be generated in the same second. The one buffer is the spinning mass of all the generators and turbines. If demand is higher than what the turbines put in, the difference is drawn from that spin, and every machine slows down together. Because frequency is tied to rotor speed, the frequency falls.
The model has one 1,000 MW machine with an inertia constant of 5 seconds (a model value). For a 50 MW shortfall the frequency starts falling at 0.3 Hz per second. Then the governor reacts. It opens the steam valves in proportion to how far the speed has dropped; with a 5 % droop setting, a 3 Hz drop would call for full output. The Korea Power Exchange's rules ask for droop settings of 5 to 6 % on steam units and 4 to 5 % on gas turbines.
With demand set to 560 MW and the generator held at 500 MW, the model's frequency dips to about 59.6 Hz, then settles at 59.825 Hz, where the governor has added about 58 MW and the slower motors in the load draw about 2 MW less. The governor alone never brings the frequency back to 60 Hz. That is the job of automatic generation control (AGC), which slowly moves the generators' set points until the frequency is back on target. Switch on AGC in the controls and watch the trace climb back.
The Korea Power Exchange runs the grid to keep the frequency within 60 ± 0.2 Hz in normal operation. If the largest generator trips, the frequency must not drop below 59.7 Hz and must be back at 59.8 Hz within a minute.
Seven kinds of power station, and the weight of their spin
The second scene sets seven stations on round stands: coal, nuclear, a gas combined-cycle plant, hydro, wind, solar and a bank of batteries. In 2024, according to the Ministry of Trade, Industry and Energy, nuclear made 31.7 % of Korea's electricity, gas 28.1 %, coal 28.1 % and new and renewable sources 10.6 %, the first year above 10 %. The bar in the corner of the scene shows those shares.
The stations differ in more than fuel. A coal, nuclear, gas or hydro unit turns a heavy generator locked to the grid's rhythm, 3,600 times a minute for a two-pole machine. The energy stored in that spin is described by the inertia constant H: the number of seconds the stored kinetic energy could run the machine at full output. The model gives coal 4.5 s, nuclear 4.0 s, gas 5.0 s and hydro 3.0 s, model values inside the range usually quoted for such machines. The steel wheel beside each station grows with its H.
Wind turbines, solar panels and batteries reach the grid through inverters, the power electronics that turn their output into 60 Hz alternating current. Behind an inverter the grid feels no spinning mass, so the model gives them H = 0. They can still help hold the frequency, and quickly, but only because their controls are set to do it, not because physics does it for free.
Move the inverter share slider and watch the readout. With 11 % of the output coming through inverters, the machines still spinning store about 376 GW·s. Lose 1.4 GW and the frequency starts falling at 0.112 Hz per second. At 50 % the store drops to about 211 GW·s and the first fall is 0.199 Hz per second; at 70 % it is 0.331 Hz per second, three times as fast. With the same governors, the lowest frequency after the loss moves from 59.67 Hz down to about 59.54 Hz.
The rule behind those numbers is the swing equation. The missing power ΔP is taken from the stored energy E, so the frequency first falls at df/dt = f₀ × ΔP / (2 × E). With f₀ = 60 Hz, ΔP = 1,400 MW and E = 376,000 MW·s that gives 0.112 Hz per second.
A day of demand, and why it looks like a duck
Korea's demand peaks on summer afternoons and in the coldest week of winter. The highest demand ever recorded was 97.1 GW on 20 August 2024, and the government still named it the record in August 2026. The winter record so far, about 94.5 GW, was set in December 2022.
The third scene builds a model day out of 24 columns, one per hour. The shape of each day is a model curve scaled to those peaks, not the record day itself. On the summer day, demand is lowest around 3 a.m. at 71.9 GW and highest in the middle of the afternoon.
Then the sun comes in. Much of Korea's solar output never passes through the power market: panels on roofs and factories feed the buildings under them, and the operator sees their output as a drop in demand. In the model, 30 GW of panels take 6.9 GW off the 17:00 column, and the highest demand left for other plants moves to 18:00, as the sun goes down and people come home.
On a mild spring day the effect is far larger. With 60 GW of panels, the demand left for other plants sinks to 26.6 GW at noon and climbs back to 72 GW by 19:00. The steepest three-hour rise is 26.5 GW. California's grid operator drew this shape years ago and called it a duck: a sunny belly at midday and a steep neck after sunset. In its own words, the operator would need to supply an extra 13,000 MW within about three hours as the sun sets.
The green glass sheet is the supply. In the model, nuclear (24 GW), coal (30 GW), hydro (4 GW) and other plants (3 GW) run all day, and you choose how much gas to start. On the summer day with 30 GW of solar, 29.3 GW of gas covers every hour. Less than that and some columns turn red; much more and the spare plants burn fuel for nothing. Real operators also keep reserves on top, which this simple stack leaves out.
The first minute after a unit trips
The fourth scene scales the frequency model up to a grid carrying 80 GW, a model value close to a busy Korean weekday. Pressing Trip a unit removes 1,400 MW in an instant, about the size of one large nuclear unit.
For the first second or two nothing has had time to react except the spinning mass of every machine still on line. The missing power comes out of their stored energy, the rotors slow together, and the meter's needle drops. With 11 % inverter share the first fall is 0.112 Hz per second.
Then the governors open. Each one adds output in proportion to how far the frequency has dropped, with a 5 % droop, but together they can only give what has been held back as reserve. The model holds 1,000 MW and lets the governors reach it with a time constant of 6 s. The load helps a little as well: motors run slower and draw less, 1.5 % less load for each 1 % fall in frequency in the model.
The fall stops when governors and load together match the missing 1,400 MW. In the model that happens about 8.5 s after the trip, at 59.67 Hz, outside the normal band of 59.8 to 60.2 Hz. Add 500 MW of batteries that reach full output in 0.2 s and the lowest point rises to 59.80 Hz; with 1,000 MW it is 59.85 Hz. Batteries do not add inertia, but they answer before the governors can. South Australia's Hornsdale battery, for example, keeps 70 MW of its discharge capacity for grid security, and a protection scheme can make it discharge 100 MW as fast as possible.
The governors alone leave the frequency below 60 Hz. Automatic generation control (AGC) then moves the set points of chosen generators over the following minutes. In the model the frequency is back to 59.96 Hz after a minute and 59.98 Hz after five.
If the reserve is too small or the loss too big, there is one more defence. Under-frequency relays switch off blocks of load automatically. The model drops 6 % of the load at 59.0 Hz, 6 % more at 58.8 Hz and another 6 % at 58.6 Hz; each block is a group of buildings that goes dark. In Texas on 15 February 2021, the grid frequency fell to 59.304 Hz and stayed below 59.4 Hz for 4 minutes and 23 seconds; relays set at 59.3 Hz were very close to shedding a large block of load, and some 276 MW of them did act.
Inside a power transformer
The fifth scene opens a three-limb power transformer. Its core is stacked from thin sheets of silicon steel, insulated from each other, so that the changing magnetic field cannot drive large eddy currents through the iron. The sheets are cut in steps of different widths so that the cross-section of each limb is nearly round and fits the round coils closely.
Each limb carries two windings. The low-voltage winding sits inside, close to the core: a few turns of thick copper for the large current. The high-voltage winding sits outside it, as a stack of discs, each with many turns of thinner copper and paper insulation in between. Everything stands in a steel tank full of mineral oil, which insulates the windings and carries their heat to the radiators on the sides. The conservator on top gives the oil room to expand as it warms, the porcelain bushings carry the conductors out through the lid, and the tap changer trims the voltage by switching between taps on a winding.
A transformer wastes energy in two ways. Core loss, from magnetising the iron 60 times a second, stays the same at any load. Copper loss, the I²R heat in the windings, grows with the square of the current. The model gives a 1,000 MVA unit a core loss of 0.12 % and a full-load copper loss of 0.30 % of its rating. At 80 % load it wastes 3.12 MW and passes on 99.61 % of what comes in. Efficiency is highest where the two losses are equal, at about 63 % load (99.62 %), and falls a little at full load (99.58 %). The model's top-oil temperature rise is 45 K at rated load.
The windings in the model show the ratio, not the real turn count. A real winding needs enough turns that the flux in the core stays below saturation. With a core section of 0.9 m² and a peak flux density of 1.7 T, a 12.7 kV phase winding at 60 Hz would need about 31 turns, from V = 4.44 × f × N × A × B.
The first practical use of transformers on a street came in Great Barrington, Massachusetts, on 20 March 1886, when William Stanley stepped a 500 V generator up to 3,000 V for the wires along Main Street and back down for the lamps.
Insulators, bundles, corona and sag
The sixth scene enlarges the top of a lattice tower ten times. The wire hangs from a string of glass discs, each about 146 mm tall. The model uses 10 discs at 154 kV, 20 at 345 kV and 40 at 765 kV, strings of about 1.5 m, 2.9 m and 5.8 m. Real designs also depend on pollution, altitude and the voltage surges from switching.
The air around a wire is an insulator only up to a point. At sea level it breaks down at about 30 kV per centimetre (peak). Where the electric field at the wire's surface goes past that, the air ionises: it glows violet at night, hisses and crackles, makes radio noise and wastes power. That is corona. The field at the surface depends on the voltage and on how sharply the surface curves, so a thin wire is worse than a thick one.
Engineers widen the wire by splitting each phase into a bundle of two to six wires held apart by spacers, 45 cm in the model. For the electric field the bundle behaves like one much fatter conductor. In the model a single wire at 345 kV has a surface field of 20.7 kV/cm, close to the fair-weather onset of 21.6 kV/cm; four wires bring it down to 10.1 kV/cm. At 765 kV a single wire would reach 42.1 kV/cm. Four wires give 19.5 kV/cm, under the onset in dry weather. Rain lowers the onset to about 14.5 kV/cm, and even six wires give 15.0 kV/cm, which is why the largest lines can still crackle on wet days.
A wire hanging between two towers takes the shape of a catenary, y = a × (cosh(x / a) − 1), where a is the horizontal tension divided by the weight per metre. With a 400 m span, a wire weighing 15.7 N per metre and a tension of 30 kN, a is 1,911 m and the sag at mid-span is 10.5 m at 15 °C. The parabola wL² / (8H) gives almost the same, 10.47 m.
Warm the wire to 80 °C and it grows by 0.12 %, about half a metre over the span. To fit the extra length between the same towers it hangs lower: the sag becomes 13.6 m and the tension falls to 23.2 kN. At −10 °C the sag is 9.0 m. The model leaves out the stretch of the wire under tension, so it slightly overstates the change; real lines are rated so that a hot, heavily loaded wire still keeps its legal clearance above the ground.
Why some links use direct current
The seventh scene puts a converter station on the mainland, a cable on the seabed and a second station on an island. Direct current came back to high-voltage transmission in 1954, when a 96 km cable began carrying 20 MW at 100 kV from mainland Sweden to the island of Gotland. Today the record is the Changji–Guquan link in China, in service since 2019, which carries 12,000 MW at ±1,100 kV over more than 3,000 km.
Direct current has three advantages. A DC line needs two conductors where an AC line needs three, and no current goes back and forth just to charge the line, so for the same wires it loses less. In the model, 1,000 MW sent 1,000 km loses 25.2 % at 345 kV AC and 16.0 % at ±320 kV DC, the DC figure including 0.7 % at each converter station.
The second advantage matters under the sea. A cable is a long capacitor, and every kilometre of an AC cable draws a charging current back and forth. In the model a 154 kV cable draws 6.7 A per kilometre, so a cable rated 1,000 A is full of its own charging current after about 149 km and has nothing left for the load. A DC cable charges once and then carries its full rating.
The third is that a DC link joins two grids that do not run in step. Japan runs at 50 Hz in the east and 60 Hz in the west, and the two halves exchange power only through frequency converter stations such as Sakuma, Shin Shinano, Higashi Shimizu and Hida–Shinano.
The price is the converter stations. In the model's cost index a DC line costs 70 % as much per kilometre as an AC line, but the two stations cost as much as 210 km of AC line, so DC pays from 700 km on land. Real break-even distances depend on the project.
Jeju has three links to the mainland. The first, from Haenam, has run at 180 kV DC since March 1998 with two 150 MW circuits and 101 km of cable. The second, from Jindo, has carried 400 MW at 250 kV since April 2014 over 113 km. Both use line-commutated converters. The third, from Wando, was begun in April 2022: 200 MW at 150 kV over 96 km, with voltage-source converters that can reverse the flow quickly, so the island can also send surplus wind and solar power to the mainland.
How one fault becomes a blackout
The eighth scene is a small grid of three power stations and five towns joined by twelve lines. The flows come from the DC power-flow rule: power from the stations to the towns splits over parallel paths in inverse proportion to their reactance, the way current divides between resistors. It does not follow the path anyone chooses.
A grid is planned so that the loss of any one element leaves the rest within limits. Operators call this the N−1 rule. In the model at 100 % load, nine of the twelve single line trips are harmless; three are not.
Lines are protected by relays that wait longer for a small overload than a large one. In the model a line at 1.1 times its limit lasts 19 s and one at 2 times its limit lasts 1.3 s. Press Fault on a line and the Inland to City line drops out. Its power moves to the other paths, the Inland to Dam line runs at about 1.11 times its limit, and about 18 s later it trips. The Coast to Inland line follows, the grid splits in two, and the towns cut off from enough generation go dark. In the end 28.3 % of the load is not served.
Operators have a way out if they act in time: switch off some load on purpose. In the model, shedding 10 % of every town's load brings the overloaded line back under its limit, and the cascade stops with every town still partly lit. On 15 September 2011 Korea met the other kind of trouble, a shortage of supply rather than a line fault. Demand beat the forecast of 64,000 MW, reserves ran out, and from 15:11 to 16:11 KEPCO switched areas off in turn through its 13 regional control centres.
Real cascades have followed the same pattern on a vast scale. On 14 August 2003, line trips in Ohio spread across the northeastern United States and Ontario; about 50 million people and 61,800 MW of load lost power. At about 22:10 on 4 November 2006, a line switched out in northern Germany set off trips that split the continental European grid into three islands and cut supply to more than 15 million households. On 28 April 2025 at 12:33 CEST, mainland Spain and Portugal went completely dark; ENTSO-E's expert panel traced it to fast rises in voltage and generators disconnecting one after another, a part of the story this model does not show.
The panel in your home
The last scene is the panel inside a front door: a main breaker, a residual-current breaker with a yellow test button, and five branch breakers for the lights (16 A), the living room (20 A), the kitchen (20 A), the hob (30 A) and the laundry (20 A). The main breaker is 40 A. These ratings are model values.
A branch breaker trips on overload by heating a bimetal strip, slowly for a small overload and fast for a large one. The model follows the bands in the international standard for such breakers: below 1.13 times the rating it should not trip within an hour, from 1.45 times it should trip within an hour, and from 5 times a magnetic coil opens it in about 10 ms. Switch on the kettle (1.8 kW), the microwave (1.2 kW), the rice cooker (1.1 kW) and the air fryer (1.5 kW) together: 5.6 kW is 25.5 A, 1.27 times the kitchen breaker's rating, and the model trips it after about a minute (shown 30 times faster). The kettle and microwave alone draw about 14 A and are fine.
The residual-current breaker does a different job. It compares the current going out on the live wire with the current coming back on the neutral. If some of it leaks to earth, through a damaged appliance or a person, the two no longer match and it trips. Korean safety rules for electric tools at work require such breakers to trip at 30 mA or less within 0.03 s.
The earth wire decides what a fault looks like. In the model a live wire touches the metal case of the washing machine. With the case earthed, a fault current of about 220 A flows through a 1 Ω loop, the case sits near 110 V for a moment, and the breakers open at once. Without an earth wire nothing happens until someone touches the case: then 220 V drives about 218 mA through a 1,000 Ω body to the ground, more than seven times the 30 mA trip level, and only the residual-current breaker stops it in time. Press Make a fault with the earth on and off, and with the breaker in and out.
Long house wiring also costs voltage. A 20 A load at the end of a 20 m run of 2.5 mm² copper loses 5.5 V, so the outlet sees about 214.5 V. At 80 m the drop is 22 V and the outlet is at the bottom of the legal band, 198 V.
What this model leaves out
- One generator and one line stand in for the whole grid. A national grid has many gigawatts spinning at once, so a 50 MW change moves its frequency far less than in the model.
- The line is a plain resistance. Real lines also have inductance and capacitance, which matter for voltage control and for how much power a long line can carry.
- The power factor is 1, and the voltage at the far end of the line is taken to be the same as at the start.
- In Korea, power from a 345 kV line usually passes through a 154 kV stage before it reaches 22.9 kV. The model goes straight from 345 kV to 22.9 kV.
- The generator voltage of 22 kV, the line resistance, the feeder count and the household loads are model values.
- Transformers in the model have no losses, and the turns shown are a small fraction of a real winding.
- The demand curves are model shapes scaled to the published peaks, and the supply stack in that scene is fixed apart from gas.
- The national frequency model treats the grid as one machine with one block of governors, one battery and three load-shedding steps, and ignores how the frequency differs slightly from place to place.
- The transformer losses, the insulator counts, the bundle spacing and the corona surface factors are model values; the corona onset comes from Peek's formula.
- The sag leaves out the elastic stretch of the wire.
- HVDC costs are an index made up for the model, and the AC cable has a fixed capacitance of 0.2 µF per km.
- The cascade grid has eight buses and uses DC power flow. Real cascades also involve voltage collapse, power swings and protection that acts when it should not.
- In the panel, breaker times run 30 times faster than in real life, and the fault circuit is reduced to a few resistances.
Safety: never touch or go near a fallen line, a pole transformer or the inside of an outlet; even 220 V can kill, and line voltages can jump through the air.
How high-voltage AC spread
The U.S. Department of Energy tells the early story. In 1893 Westinghouse won the contract to light the World's Columbian Exposition in Chicago with alternating current, bidding $399,000 against $554,000 for direct current. The same year the Niagara Falls Power Company chose Westinghouse's alternating current, and on 16 November 1896 Buffalo, New York, was lit by power from the falls. High-voltage direct current has since come back for very long links, because a DC line can carry power over long distances with less loss.
Korea's grid grew in voltage steps. KEPCO's facility table shows 4,935 circuit-kilometres of 345 kV line in 1990 and none at 765 kV that year, then 595 circuit-kilometres of 765 kV line by 2000. By 2024 the figures were 1,024 km at 765 kV, 10,070 km at 345 kV and 24,270 km at 154 kV or below, with 925 substations. The 2024 column also lists DC lines at 500 kV, 250 kV and 180 kV. KEPCO E&C, which designed the foundations for Korea's first 765 kV towers, is now designing foundations for 500 kV DC towers.
Questions
Why do power lines use such high voltages?
Because the heat lost in the wire depends on the square of the current. For the same power, raising the voltage lowers the current in proportion, and the loss falls with the square. In the model, 500 MW at 345 kV loses 6.3 MW; at 154 kV it loses 31.6 MW.
What voltages does Korea use for transmission and distribution?
KEPCO runs transmission lines at 765 kV, 345 kV and 154 kV, plus DC links. Distribution feeders run at 22.9 kV between phases (13.2 kV from phase to neutral), and homes get 220 V at 60 Hz.
What does a transformer actually do?
It changes the voltage in the ratio of its turns, V₂ / V₁ = N₂ / N₁, and changes the current the other way. It only works with alternating current, because it needs a changing magnetic field in its core.
Why do power lines sag more on hot days?
Metal expands when it warms. A longer wire between the same towers hangs lower. Heavy current heats the wire as well, which is why the model's line sags further when you lower the voltage and the current goes up.
Why is the frequency 60 Hz, and what happens if it drifts?
Korea, like the United States, uses 60 Hz. The frequency falls when demand is larger than supply and rises when it is smaller, because the difference is taken from or added to the spinning generators. The Korea Power Exchange keeps it within 60 ± 0.2 Hz in normal operation.
Is 220 V more dangerous than 110 V?
Both can kill. A higher voltage drives more current through a body, so 220 V is the more dangerous of the two, and both must be treated with care. The advantage of 220 V is that the same appliance draws half the current, so house wiring loses less.
How much electricity is lost between the power station and the home?
It depends on the grid. The U.S. Energy Information Administration puts U.S. transmission and distribution losses at about 5 % from 2018 to 2022. In the model, the 345 kV line alone loses 1.26 % of 500 MW.
What is grid inertia, and why do solar panels not provide it?
Inertia is the kinetic energy stored in every generator and turbine that turns in step with the grid. When a unit trips, that energy covers the gap for the first seconds and slows the fall of the frequency. Solar panels, batteries and most wind turbines connect through inverters, so no spinning mass is coupled to the grid; their controls can still respond, often faster, if they are set up to.
What is the duck curve?
It is the shape of demand left for conventional plants on a sunny day with a lot of solar: a deep dip at midday and a steep climb after sunset. California's grid operator named it. In the model, 60 GW of solar on a spring day leaves a 26.5 GW climb in three hours.
Why does Korea send power to Jeju as direct current?
Because the link runs under the sea. An AC cable that long would use much of its rating just charging its own capacitance, and a DC link also keeps the island's grid separate from the mainland's. Jeju's three links run at 180 kV, 250 kV and 150 kV DC.
What happened on 15 September 2011?
Demand on an unusually hot September day rose above the forecast and the operating reserve ran out. To protect the whole grid, KEPCO switched areas off in turn from 15:11, a rotating outage, rather than risk a collapse.
What does the test button on a residual-current breaker do?
It sends a small current around the breaker's sensing coil so that the outgoing and returning currents no longer match, as they would with a real leak. A working breaker trips at once. If it does not, it needs replacing.
Why do power lines hum or crackle in the rain?
That is corona. Water drops on the wire make sharp points where the electric field is stronger, and the air around them breaks down in tiny discharges. Bundles of several wires per phase lower the field, but on the highest voltages they cannot always stop it in heavy rain.
How efficient is a big transformer?
Very. A large power transformer passes on well over 99 % of what comes in. The model's 1,000 MVA unit reaches 99.62 % at about 63 % load. The rest, a few megawatts, becomes heat that the oil carries to the radiators.
Terms
- Transmission line: a high-voltage line (154 kV and above in Korea) carrying bulk power between power stations and substations.
- Distribution feeder: a lower-voltage line (22.9 kV in Korea) from a substation to pole and pad transformers.
- Step-up transformer: the transformer at a power station that raises the generator voltage to the line voltage.
- Turns ratio: the number of turns on one winding divided by the number on the other; it sets the voltage ratio.
- I²R loss: power turned into heat by current flowing through resistance.
- Phase-to-neutral voltage: the voltage between one phase wire and the neutral, 1/√3 of the voltage between phases.
- RMS value: the steady voltage that would give the same heating; 220 V rms has a peak of 311 V.
- Governor: the controller that opens a turbine's valves as the speed drops.
- Droop: how far the frequency must fall for a governor to call for full output, as a percentage of rated speed.
- AGC: automatic generation control, which moves generator set points to bring the frequency back to 60 Hz.
- Inertia constant (H): the kinetic energy stored in a spinning machine divided by its rating, in seconds.
- Rate of change of frequency: how fast the frequency falls right after a sudden loss of generation, in Hz per second.
- Nadir: the lowest frequency reached after a disturbance.
- Under-frequency load shedding: relays that switch off blocks of load automatically when the frequency falls past set points.
- Inverter: power electronics that turn the output of solar panels, batteries or wind generators into grid-frequency AC.
- Net demand: total demand minus the solar and wind the operator does not dispatch; on sunny days it forms the duck curve.
- Laminated core: a transformer core stacked from thin insulated steel sheets to keep eddy currents small.
- Bushing: an insulated passage that carries a conductor through the wall or lid of a tank.
- Tap changer: a switch that changes the number of active turns to trim a transformer's voltage.
- Corona: ionisation of the air at a conductor surface where the electric field exceeds its breakdown strength.
- Bundle conductor: two or more wires per phase held apart by spacers, which act as one fatter conductor.
- Catenary: the curve of a wire hanging under its own weight, y = a cosh(x / a).
- HVDC: high-voltage direct current transmission, with converter stations at both ends.
- N−1: the planning rule that the grid must stay within limits after the loss of any single element.
- Cascade: a chain of trips in which each outage overloads the next element.
- Residual-current breaker: a breaker that trips when the current out and the current back differ, as happens when current leaks to earth.
Sources
- KEPCO, Transmission and distribution business (facility status tables). https://www.kepco.co.kr/eng/business/domestic/transmission-and-distribution-business.do (checked 16 October 2026)
- Korea Power Exchange, 전력계통 운영 기준 (Power system operating standards, Market Operation Rules annex 3). https://marketrule.kpx.or.kr/lmxdata/attach/2025/5/upload_5127126665285383397_p8.pdf (checked 16 October 2026)
- Korea Power Exchange, 주파수 유지율 (monthly frequency records). https://www.kpx.or.kr/menu.es?mid=a10109020600 (checked 16 October 2026)
- Korean Law Information Center, Enforcement Rule of the Electricity Business Act, Article 18 and Annex 3 (standard voltage and frequency, amended 1 October 2025). https://www.law.go.kr/%EB%B2%95%EB%A0%B9/%EC%A0%84%EA%B8%B0%EC%82%AC%EC%97%85%EB%B2%95%EC%8B%9C%ED%96%89%EA%B7%9C%EC%B9%99 (checked 16 October 2026)
- Korean Law Information Center, 전력계통 신뢰도 및 전기품질 유지기준 (grid reliability and power quality standard). https://law.go.kr/admRulLsInfoP.do?chrClsCd=&admRulSeq=2100000222524 (checked 16 October 2026)
- KEPCO E&C, Transmission and substation. https://www.kepco-enc.com/menu.es?mid=a10303060000 (checked 16 October 2026)
- U.S. Energy Information Administration, How much electricity is lost in electricity transmission and distribution in the United States? https://www.eia.gov/tools/faqs/faq.php?id=105&t=3 (checked 16 October 2026)
- U.S. Department of Energy, The War of the Currents: AC vs. DC Power. https://www.energy.gov/articles/war-currents-ac-vs-dc-power (checked 16 October 2026)
- Georgia State University, HyperPhysics, Transformer. http://hyperphysics.phy-astr.gsu.edu/hbase/magnetic/transf.html (checked 16 October 2026)
- Model values (500 MW, 22 kV generator, 3 Ω per phase over 100 km, 80 feeders, 30 kW per pole transformer, 3 kW per house, 1,000 MW machine with H = 5 s and 5 % droop) were worked through by hand.
- Ministry of Trade, Industry and Energy, 신재생에너지 발전비중 최초 10% 돌파 (2024 energy supply and demand, press release, 12 May 2025). https://www.korea.kr/briefing/pressReleaseView.do?newsId=156688457 (checked 19 October 2026)
- Ministry of Climate, Energy and Environment, press release on the summer supply check, 7 August 2026 (record peak 97.1 GW, 20 August 2024). https://www.korea.kr/briefing/pressReleaseView.do?newsId=156773851 (checked 19 October 2026)
- Korea.kr policy news, 정부, 올 겨울 역대 최대 전력 공급능력 확보 (winter outlook, 5 December 2025). https://www.korea.kr/news/policyNewsView.do?newsId=148955981 (checked 19 October 2026)
- Prime Minister's Office, briefing on the joint investigation of the 15 September 2011 outage. https://www.korea.kr/briefing/policyBriefingView.do?newsId=148718943 (checked 19 October 2026)
- Ministry of Trade, Industry and Energy, 제주와 내륙을 잇는 첨단 전력망 구축 (third Jeju HVDC link, press release, 13 April 2022). https://www.motir.go.kr/attach/down/095a2dda9c864e1d90d751f7668a1117/53f4db8095bb881d66d862db4484bcb0 (checked 19 October 2026)
- KIEE journal via KoreaScience, the Jeju power system and its HVDC links (2014). https://koreascience.kr/article/JAKO201467958870159.pdf (checked 19 October 2026)
- Korea Electric Association journal via KoreaScience, 전력수송의 고속도로 765kV 송전기술. https://koreascience.kr/article/JAKO200365720380066.pub?&lang=en&orgId=electric (checked 19 October 2026)
- KEPCO webzine, July 2026, milestones of the Korean grid (Kori 1, 765 kV, 220 V conversion). https://www.kepco.co.kr/KEPCO_FILE/html/2026_07/theme01.html (checked 19 October 2026)
- KEPCO webzine, January 2026, the tram and Hanseong Electric Company. https://www.kepco.co.kr/KEPCO_FILE/html/2026_01/electric.html (checked 19 October 2026)
- National Archives of Korea, 기록으로 보는 대한민국: 전기. https://theme.archives.go.kr/next/koreaOfRecord/electronic.do (checked 19 October 2026)
- Korea Heritage Service, excavation of the 1887 power house site at Gyeongbokgung. https://www.khs.go.kr/newsBbz/selectNewsBbzView.do?mn=NS_01_02&newsItemId=155699307§ionId=b_sec_1 (checked 19 October 2026)
- Korean Law Information Center, Occupational Safety and Health Standards Rule, Article 304 (residual-current breakers). https://www.law.go.kr/LSW//lsSideInfoP.do?docCls=jo&joBrNo=00&joNo=0304&lsiSeq=273603&urlMode=lsScJoRltInfoR (checked 19 October 2026)
- IEEE History Center, Milestones: Pearl Street Station, 1882. https://ethw.org/Milestones:Pearl_Street_Station,_1882 (checked 19 October 2026)
- IEEE History Center, Milestones: Alternating Current Electrification, 1886. https://ethw.org/Milestones:Alternating_Current_Electrification,_1886 (checked 19 October 2026)
- IEEE History Center, Milestones: Adams Hydroelectric Generating Plant, 1895. https://ethw.org/Milestones:Adams_Hydroelectric_Generating_Plant,_1895 (checked 19 October 2026)
- IEEE History Center, Milestones: Gotland High Voltage Direct Current Link, 1954. https://ethw.org/Milestones:Gotland_High_Voltage_Direct_Current_Link,_1954 (checked 19 October 2026)
- U.S.-Canada Power System Outage Task Force, Final Report on the August 14, 2003 Blackout in the United States and Canada (2004). https://www.energy.gov/oe/articles/blackout-2003-final-report-august-14-2003-blackout-united-states-and-canada-causes-and (checked 19 October 2026)
- UCTE, Final Report: System Disturbance on 4 November 2006 (2007). https://eepublicdownloads.entsoe.eu/clean-documents/pre2015/publications/ce/otherreports/Final-Report-20070130.pdf (checked 19 October 2026)
- POSOCO, Report on the Grid Disturbances on 30th July 2012 and 31st July 2012 (submitted to CERC). http://www.cercind.gov.in/2012/orders/final_report_grid_disturbance.pdf (checked 19 October 2026)
- Ofgem, Investigation into 9 August 2019 power outage. https://www.ofgem.gov.uk/publications/investigation-9-august-2019-power-outage (checked 19 October 2026)
- FERC, NERC and Regional Entity Staff, The February 2021 Cold Weather Outages in Texas and the South Central United States (2021). https://www.nerc.com/globalassets/our-work/reports/event-reports/february_2021_cold_weather_report.pdf (checked 19 October 2026)
- ENTSO-E, 28 April 2025 Blackout (Expert Panel final report). https://www.entsoe.eu/publications/blackout/28-april-2025-iberian-blackout/ (checked 19 October 2026)
- AEMO, Initial operation of the Hornsdale Power Reserve Battery Energy Storage System (2018). https://aemo.com.au/-/media/files/media_centre/2018/initial-operation-of-the-hornsdale-power-reserve.pdf (checked 19 October 2026)
- California ISO, What the duck curve tells us about managing a green grid. https://www.caiso.com/documents/flexibleresourceshelprenewables_fastfacts.pdf (checked 19 October 2026)
- OCCTO, Annual Report 2021 (interconnection facilities and frequency converters). https://www.occto.or.jp/assets/en/information_disclosure/annual_report/files/annualreport_2021_220831.pdf (checked 19 October 2026)
- Hitachi Energy, Changji–Guquan UHVDC link. https://www.hitachienergy.com/news-and-events/customer-stories/changji-guquan-uhvdc-link (checked 19 October 2026)
More exhibits
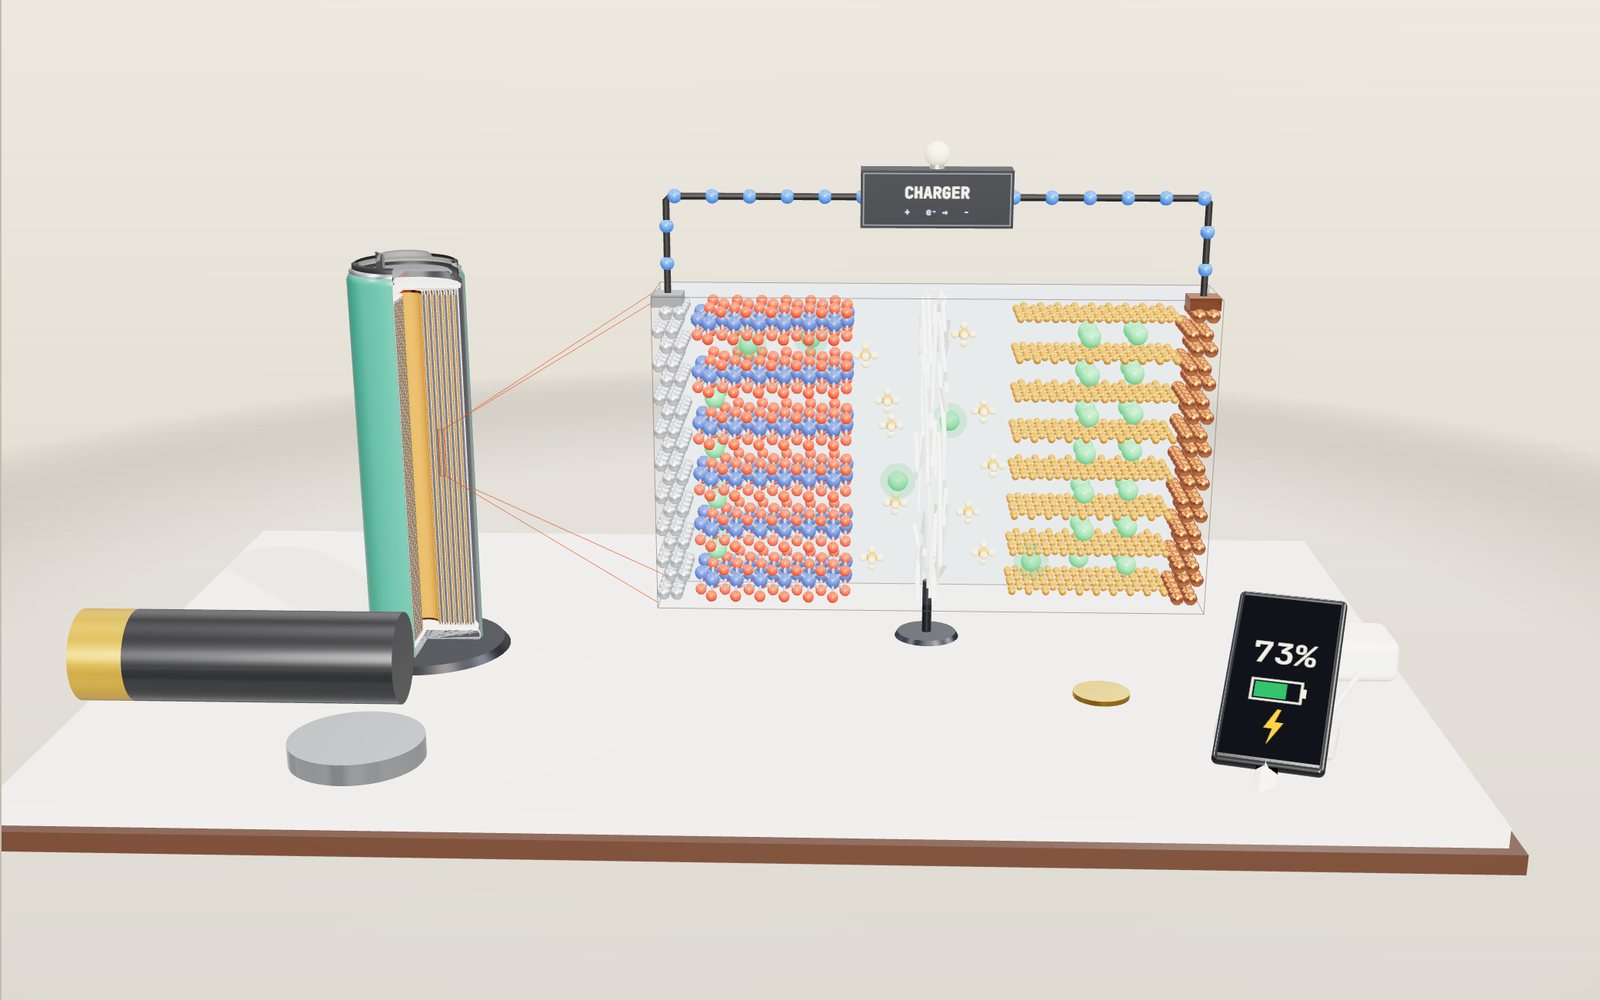
How a lithium-ion battery works: where the ions go on charge
Each time an 18650 cell charges, about 7 × 10²² lithium ions leave a metal oxide and squeeze in between sheets of graphite.
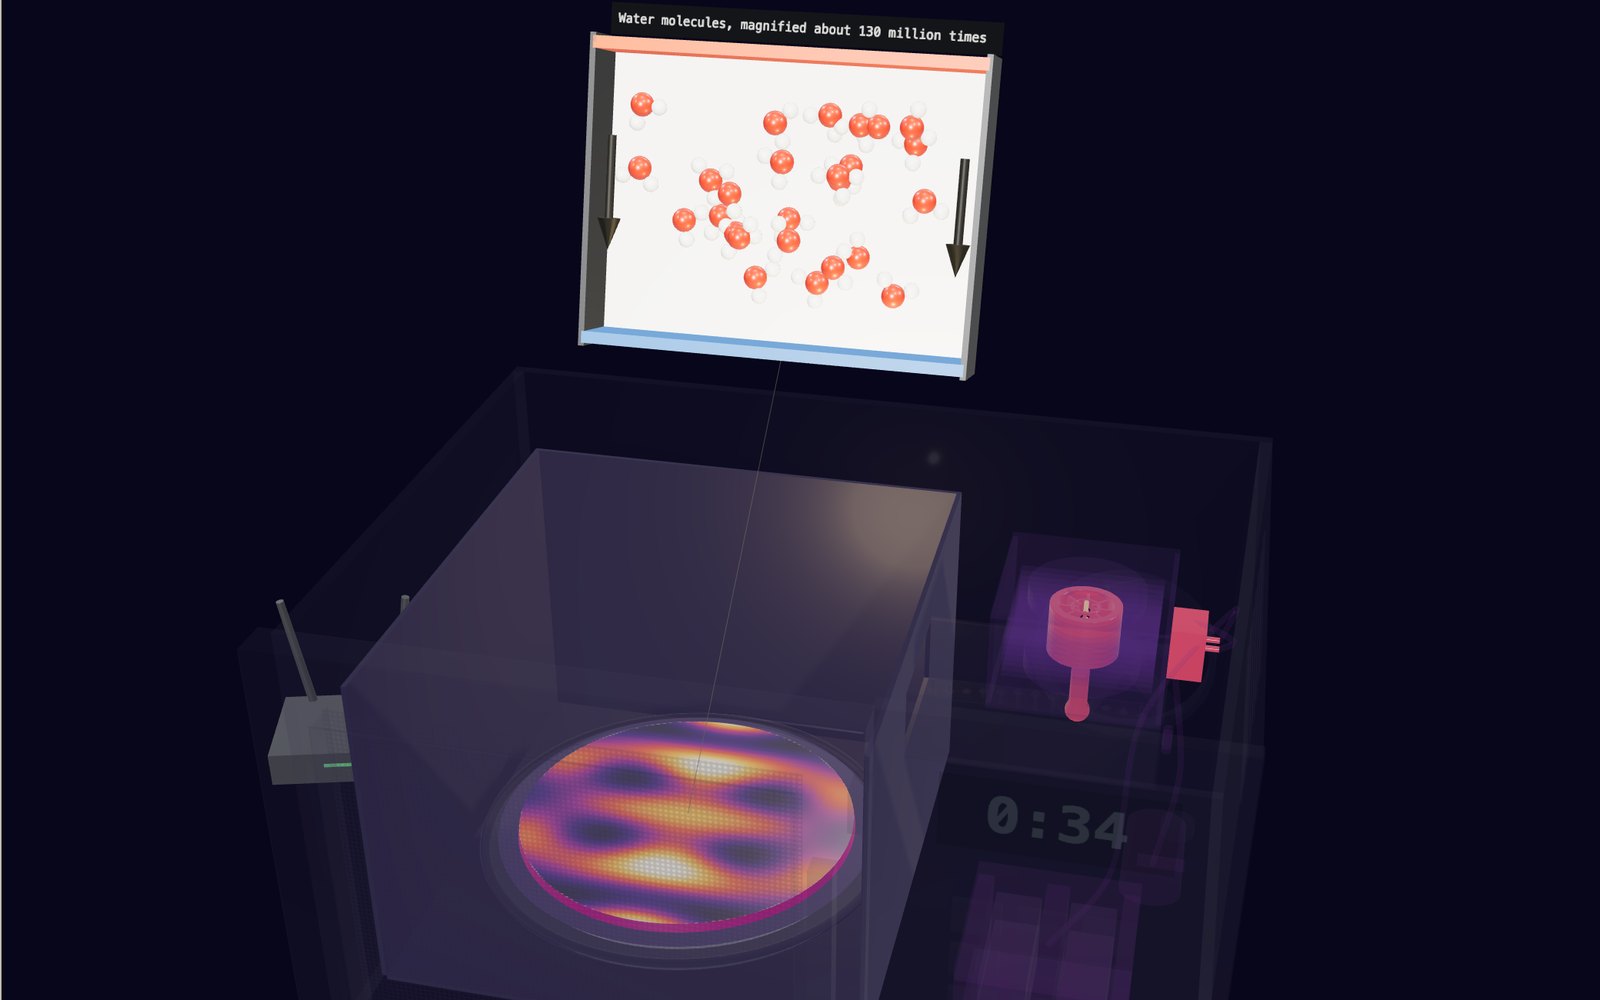
How a microwave oven works: the magnetron that makes the waves
The waves inside a microwave oven are 12.2 cm long, so without a turntable the hot spots in your food sit about 6 cm apart.
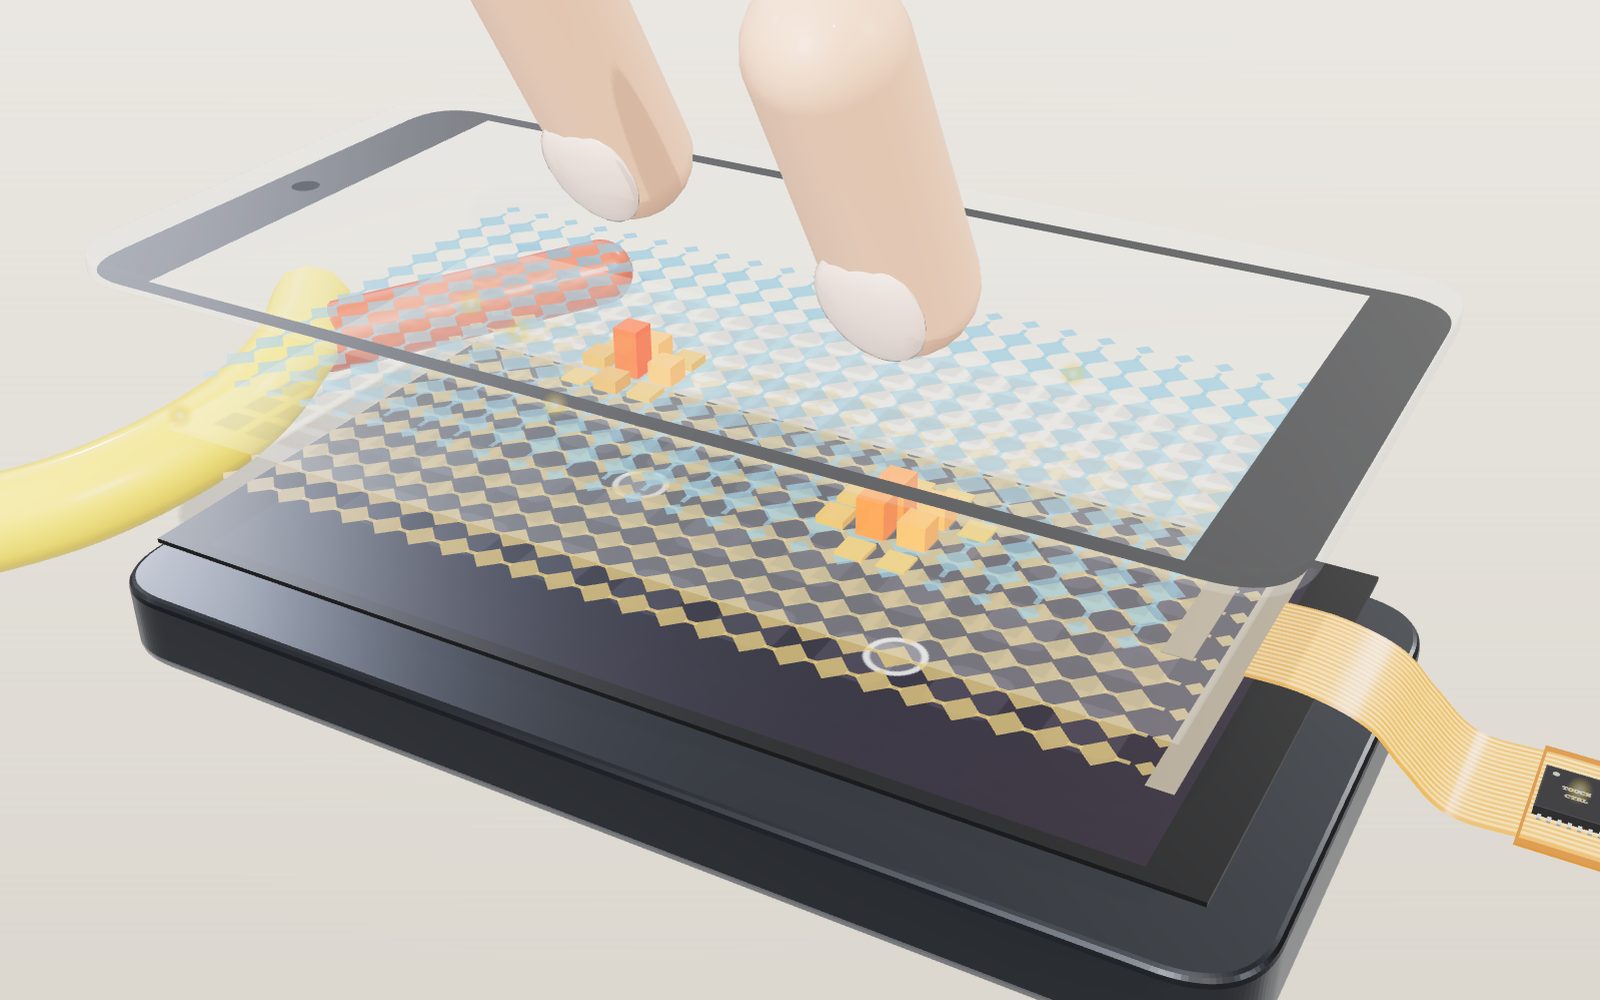
How a touchscreen works: how the glass finds your finger
Under the glass of a phone lies a grid of transparent electrodes, and your finger shows up as a small dip in the charge passing between them.
Electric motor simulator: how it works, step by step
Eight motors, from Faraday's wire in mercury in 1821 to the magnets inside an electric car, all turning on the same push between current and field.
How lightning and thunder work
A lightning channel heats the air to about five times the temperature of the Sun’s surface, and its thunder needs about 3 seconds to cover each kilometre to you.
How a solar panel works
In full sun a 60-cell rooftop panel makes about 300 watts, and all of it comes from an electric field sitting inside each slice of silicon.