FIG. 23Senses
Light and colour, from prisms to polarisers
A glass prism bends violet light about 1.6 degrees more than red, and that small gap is all it takes to spread white light into a spectrum.
This device cannot show the 3D model. You can read the guide steps below as text.
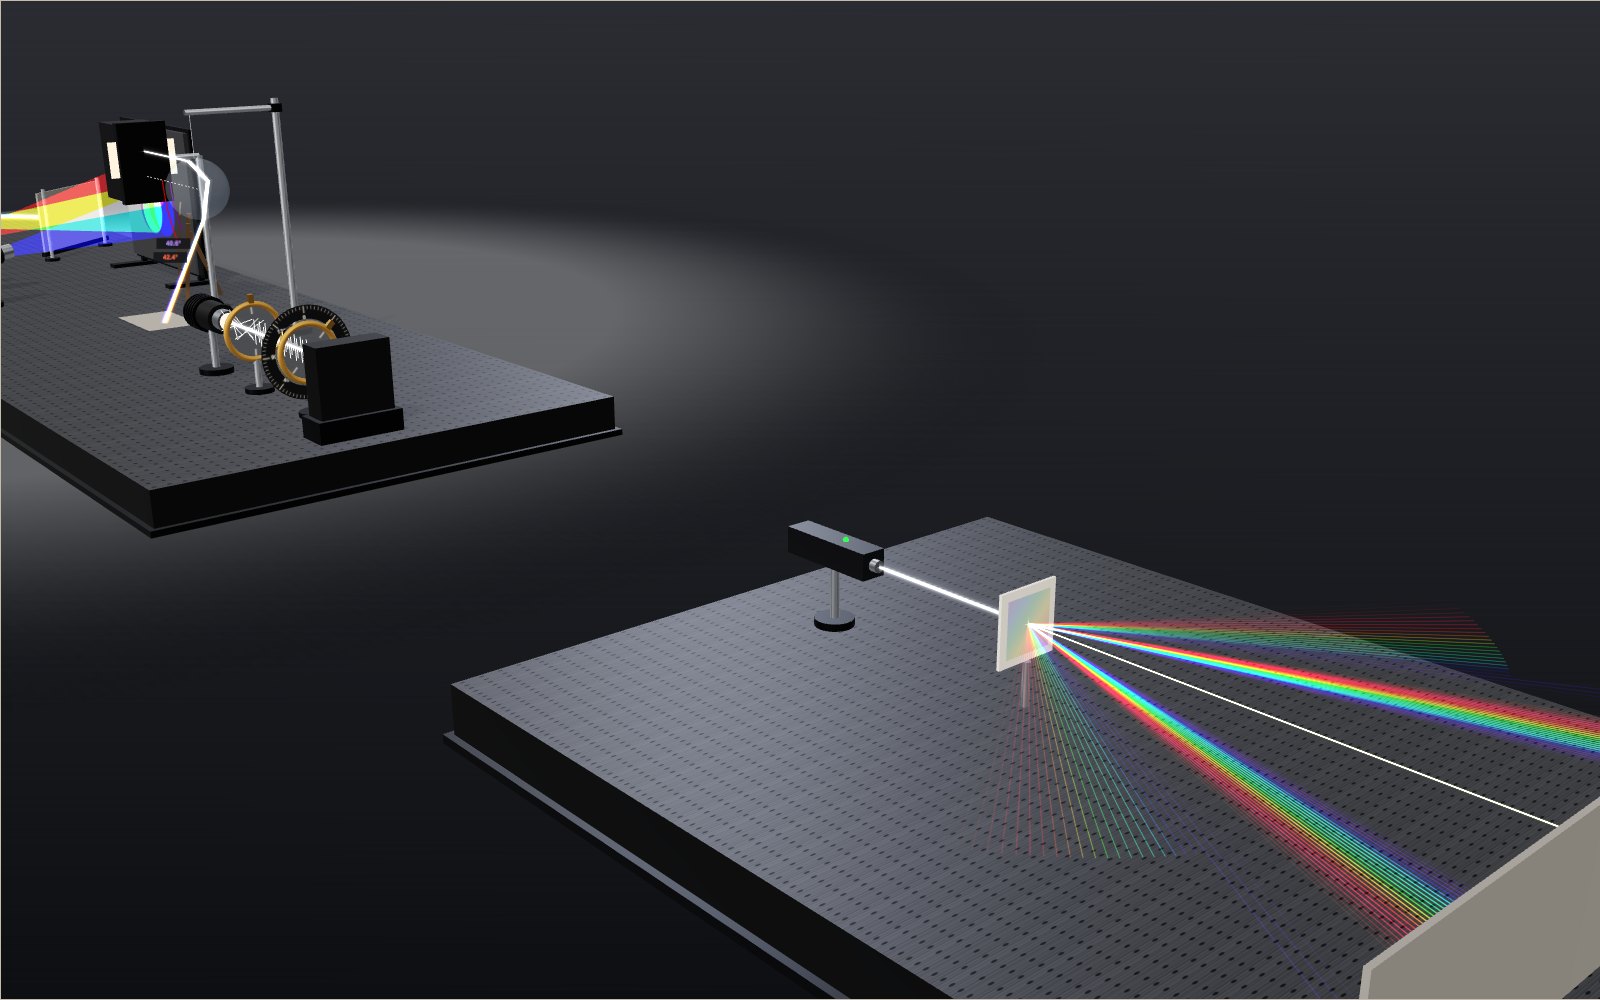
1 / 18 14 experiments on two tablesThe optical bench holds a prism, three coloured lamps beside an ink card, a hanging water drop and a pair of polarising filters. Ten more stations wait on the second table to the right. The bar under the picture jumps to each one.
Drag to turn. Scroll or pinch to zoom.
Where the colours in white light come from
Stand a glass of water on a sunny windowsill and a small patch of colour often appears on the floor beside it. Nothing in the glass is coloured. The colours were already in the sunlight, mixed together so evenly that we see the mixture as white, and the curved water has pulled them a little apart.
This exhibit sets out fourteen experiments on two tables. On the optical bench, a glass prism splits a white beam into a spectrum, three lamps show how red, green and blue light add up to white next to a card where inks do the opposite, a single water drop shows why a rainbow sits about 42° from the point opposite the sun, and two polarising filters show how much light gets through when one is turned against the other. The second table holds ten more: filters on a light box, a diffraction grating, a soap film, a tank of milky water, samples glowing under ultraviolet, a lamp you can heat from 1000 to 10 000 K, gas tubes seen through a spectroscope, the response of the eye's three cone types, a colour vision board and a Morpho butterfly wing. The angles, wavelengths and brightness values on screen come from the formulas described below, and they agree with published tables.
Below the controls you will find the list of stations, seven tasks to try, 50 cases from history, daily life and nature (each with its source and a button that sets the model to match) and a few facts worth knowing.
Why glass bends violet more than red
Light travels more slowly in glass than in air. The ratio of the two speeds is the refractive index, n. When a beam meets a glass surface at an angle, the slower speed inside makes it change direction. Snell's law gives the new direction:
n1 sin θ1 = n2 sin θ2
where θ1 and θ2 are the angles between the beam and a line drawn square to the surface (the normal). Going from air (n about 1.000) into glass (n about 1.5), the beam swings toward the normal.
If the index were the same for every colour, a prism would bend the whole white beam by one angle and the spot on the screen would stay white. It is not the same. In ordinary glass the index is slightly higher for short wavelengths, so violet light is slowed a little more and bent a little more than red. This change of index with wavelength is called dispersion.
Glass makers describe dispersion with the Sellmeier equation, a fit to measured indices:
n² = 1 + B1 λ² / (λ² − C1) + B2 λ² / (λ² − C2) + B3 λ² / (λ² − C3)
with the wavelength λ in micrometres. For BK7, a common borosilicate crown glass, SCHOTT gives B1 = 1.03961212, B2 = 0.231792344, B3 = 1.01046945, C1 = 0.00600069867, C2 = 0.0200179144 and C3 = 103.560653. Putting in numbers gives n = 1.5308 at 400 nm (violet), 1.5185 at 550 nm (green) and 1.5131 at 700 nm (red). The difference between violet and red is only 0.018, about one part in 85.
Working out the prism
The exhibit traces each of 25 wavelengths from 400 to 700 nm separately. At every face it applies Snell's law with that wavelength's index, and it keeps track of how much light the face reflects (the Fresnel equations). If a ray inside the glass meets a face too steeply to get out, it reflects instead. That is total internal reflection.
For a prism with apex angle A, the beam is bent least when it passes through the glass parallel to the base. That smallest bend is the angle of minimum deviation:
D = 2 asin(n sin(A/2)) − A
With A = 60° this gives 39.89° for 400 nm light and 38.32° for 700 nm, a gap of 1.57°. For green light, minimum deviation happens when the beam meets the first face at 49.4°, which is where the prism starts. The screen is 66 cm away, so the band of colour on it is about 18 mm wide (tan 1.57° × 660 mm). The readout shows a close-up of the screen in millimetres.
Turn the prism and the numbers change. At 31° incidence the beam crosses the glass much more steeply, the fan opens to about 5° and the colours on the screen grow dimmer, because more light is lost by reflection at each face. Go a little lower and the violet end vanishes first. Inside BK7, light can only escape a face if it meets it at less than the critical angle, asin(1/n): 40.8° for 400 nm and 41.4° for 700 nm. Below about 30° incidence, violet light hits the second face beyond its critical angle and is turned back into the glass, while red still escapes.
The weak white beam that bounces off the first face is also traced. At 49.4° it carries about 6% of the light. At 85° it carries more than 60%, which is why a sheet of glass seen almost edge on works like a mirror.
Adding light: red, green and blue
The retina has three kinds of cone cells, with peak sensitivities roughly in the blue, green and yellow-red parts of the spectrum. Any light that stimulates the three in the same proportions looks the same to us, whatever its spectrum. That is why a screen can fake almost any colour with only red, green and blue dots.
On the dark mixing board, each lamp throws a circle of one colour. Where red and green circles overlap, both cone signals are high and the blue one is low, and we see yellow, even though no yellow wavelength is present. Green and blue give cyan, red and blue give magenta. In the middle, where all three meet, the board looks white. The exhibit adds the three lamps exactly (1 + 1 + 1 in each colour channel), so the centre is pure white on screen. Turn one lamp off and every overlap that used it loses that colour. Slide the overlap control to push the circles together or apart.
Subtracting light: inks and paints
Paint behaves the other way round. A cyan ink looks cyan because it absorbs red light and sends back green and blue. Yellow ink absorbs blue and returns red and green. Put cyan on top of yellow and the only light both inks let through is green. Add magenta, which absorbs green, and almost nothing is left. That is subtractive mixing. Each layer multiplies the light by its own transmission, so the result can only get darker.
The card next to the lamps is drawn that way, with the three inks multiplied over paper. Printers use cyan, magenta and yellow for this reason, and add a separate black ink because real inks are not perfect absorbers: three layers give a muddy dark brown rather than a clean black.
How a raindrop makes a 42° circle
A raindrop is close to a sphere. Sunlight that enters it is bent at the surface, reflects once off the inside of the back, and is bent again as it leaves. The total turn depends on where the ray hits the drop. A ray through the centre comes straight back. A ray near the edge comes back at a smaller angle too. In between there is a turning point.
Call the angle of incidence i and the angle inside the drop r, with sin i = n sin r. The total deviation is
D = 180° + 2i − 4r
and the angle between the returning ray and the direction straight away from the sun is 4r − 2i. That angle is largest when cos² i = (n² − 1)/3. René Descartes worked out the rainbow this way in 1637, tracing rays through a glass globe filled with water.
Using measured indices for water at 24 °C (Daimon and Masumura, 2007), n is 1.3311 at 656 nm and 1.3432 at 400 nm. For red light the turning point comes at i = 59.5° and gives 42.4°. For violet it comes at i = 58.8° and gives 40.6°. Rays pile up near the turning point because the angle changes slowly there: of rays spread evenly across the drop, about 12% leave within 1° of the red maximum. Every drop at 42.4° from the point opposite the sun sends you red light; drops at 40.6° send violet. That is why the bow is a circle, red outside and violet inside.
Switch on "Many rays" to see this. The rays of each colour crowd together at their limit and none go beyond it, so the sky just outside the bow is darker than the sky inside it. With two internal reflections the same calculation gives a second, fainter bow at 50.4° (red) to 53.5° (violet), with the colours reversed. The dark gap of about 8° between the two bows is called Alexander's band.
Polarising filters and Malus's law
Light is a wave in which the electric field vibrates across the direction of travel. In lamplight or sunlight that vibration points every which way and changes from moment to moment. A polarising filter is made of long molecules lined up in one direction. It absorbs the part of the vibration along the molecules and passes the part across them, so the light that comes out vibrates in one direction only.
An ideal filter passes half of unpolarised light. A second filter turned by an angle θ passes the fraction cos² θ of what reaches it. That rule is Malus's law:
I = I0 cos² θ
At 0° everything gets through, at 45° half, at 60° a quarter and at 90° nothing. The short white marks along the beam show the direction of vibration. Before the first filter they point every way; after it they all line up with its axis.
Now try the third filter. With the first and second crossed at 90°, the screen is dark. Put a filter at 45° between them and light reappears: half passes the first filter, half of that passes the middle one and half again passes the last, 12.5% of the lamp's light in all. The middle filter does not add light. It turns the direction of vibration in two steps, each of which lets some light through.
Taking light away: three filters on a light box
The second table starts with a white light box and three sheets of coloured film. Each sheet is a subtractive filter. The cyan one lets through most light shorter than about 585 nm and stops the red end. Magenta stops a band in the middle, roughly 495 to 575 nm, and passes red and blue. Yellow stops everything shorter than about 495 nm. In the model each filter passes 96% of what it lets through and leaks 4% of what it blocks, which is close to a good gel filter.
Where two sheets overlap, light has to get through both, so the transmissions multiply. Cyan over yellow leaves only the green band between 495 and 585 nm. Cyan over magenta leaves blue, magenta over yellow leaves red. Under all three, only the leaks get through and the box looks dark grey-brown: the readout puts it at 17% of the box's brightness rather than zero, which is why printers still need black ink. The chart in the readout draws each filter's curve and shades the light that survives them all. The colour of every overlap is worked out from the product of the curves, not by mixing screen colours.
A diffraction grating sorts colours by angle
A grating is a sheet ruled with thousands of fine parallel lines. Light passing between neighbouring lines spreads out, and the waves from all the gaps meet again on the far side. In most directions they cancel. They add up only where the path from one gap is a whole number of wavelengths longer than the path from the next:
d sin θ = m λ
Here d is the spacing between lines, θ the angle from the straight-through beam and m the order (0, ±1, ±2 and so on). With 600 lines per mm, d = 1.67 µm. A green laser at 532 nm then leaves in the first order at 18.6° and in the second at 39.7°. The third order would leave at 73.3°, which misses the screen in the model.
Unlike a prism, a grating bends red more than violet, and by much more. Switch on White light and each order becomes a full spectrum; at 600 lines per mm the first-order spectrum runs from 13.9° for 400 nm to 24.8° for 700 nm. Raise the line count and the spectra spread further until the higher orders disappear. A CD has a track every 1.6 µm, about 625 per mm; a DVD packs them 0.74 µm apart, about 1350 per mm, which is why a DVD throws its colours at much steeper angles.
Gratings are how laboratories measure wavelengths. Fraunhofer built one from 260 parallel wires in 1821 and used it to put numbers on the dark lines in sunlight.
Soap films and oil: colour from thickness
A soap film is a layer of water a few hundred nanometres thick, held between two sheets of soap molecules. Light reflects from the front surface and again from the back. The back reflection travels an extra 2nd cos θt, where n = 1.33 is the index of the water, d the thickness and θt the angle inside the film. The front reflection also gets a half-wave flip because it bounces off a denser medium. So for light coming straight in, the two reflections add up when
2nd = (m + ½) λ
and cancel when 2nd is a whole number of wavelengths. At the centre of the model film, 450 nm thick, the extra path is 1197 nm. That is 2.5 wavelengths of 479 nm light, which comes back strongly, while 599 nm light (exactly 2 wavelengths) is cancelled. The film looks blue-violet there.
The model calculates every reflection exactly, adding up all the internal bounces (the Airy sum) for 81 wavelengths and turning the result into a colour with the CIE functions. The film drains downward, so it is thin at the top and thick at the bottom, and the bands of colour follow the thickness. A soap film reflects at most 7.7% of the light that hits it, so the colours on the stage are shown ten times brighter, as they look against a dark background.
Turn the thickness down. Below about 23 nm the film reflects less than 1% of white light at every colour and looks black. Real bubbles go black at the top just before they burst. Thick films, above about 1500 nm, mix so many orders that the colours wash out to pale pink and green. Tilting the view shortens the path inside the film and shifts the colours toward the blue end, which is why the bands slide as you move your head.
An oil slick on a wet road works the same way, with oil (n about 1.47) on water (1.33). Camera lenses and glasses use the opposite trick: a layer of magnesium fluoride (n = 1.38) about 100 nm thick makes the two reflections cancel for green light and cuts the reflection of a glass surface at 550 nm from about 4.3% to 1.3%.
Why a tank of milky water turns blue
Put a few drops of milk in a long tank of water and shine a white lamp through it. From the side the water glows faintly blue. On a card at the far end the spot is yellow or orange. Nothing has been added that is blue or orange; the particles of fat and protein simply scatter short wavelengths more strongly than long ones.
For particles much smaller than the wavelength, Lord Rayleigh showed in 1871 that the scattered power goes as 1/λ⁴. Light at 450 nm is scattered (700/450)⁴ = 5.9 times as strongly as light at 700 nm. In the model, the Milk control sets how much light at 550 nm is scattered over the length of the tank. At 40% that is an optical depth of 0.6, which leaves 26% of the 450 nm light and 74% of the 650 nm light in the beam at the far end. The light scattered out of the side is the part the beam has lost, weighted toward blue. Push the control to 100% and the spot at the end turns deep orange, like the sun near the horizon.
This is the same physics as the blue sky and red sunsets, shown in a tank instead of 100 km of air. The sky exhibit follows sunlight through the whole atmosphere and explains why the sky is not violet. (Milk droplets are not all much smaller than the wavelength, so a real tank looks less clean than the model.)
Fluorescence and afterglow under ultraviolet
The black-light tube gives ultraviolet at 365 nm, just past the violet end of what the eye can see. Some materials take in that light and send out visible light of a longer wavelength. George Stokes studied this in 1852 with a solution of quinine and named it fluorescence, after the mineral fluorite. The rule he found, that the light given out always has less energy (a longer wavelength) than the light taken in, is called the Stokes shift.
On the tray, from left to right: a highlighter (green, near 515 nm), tonic water with quinine (blue, near 450 nm), fluorite (violet-blue, near 425 nm), willemite (green, near 525 nm), calcite (red, near 615 nm), white paper with optical brighteners (blue, near 440 nm) and a glow-in-the-dark star. The emission peaks in the model are typical values for each kind of material; real samples vary with impurities. Switch the lamp on and the room lights dim so the glow is easier to see.
Fluorescence stops within billionths of a second when the lamp goes off. The star is different. Strontium aluminate with europium and dysprosium, first made in 1996, traps some of the energy and releases it slowly as phosphorescence. Switch off the UV lamp and the star keeps glowing green while the readout counts the afterglow down. The model uses a simple exponential fade with a time constant of 6 s so you can watch it; a real glow-in-the-dark star fades over hours.
Colour temperature: what a hot lamp gives off
Heat anything enough and it glows: dull red at about 800 K, orange at 2000 K, yellow-white at 3000 K. A perfect absorber, called a black body, gives off light with a spectrum that depends only on its temperature. Max Planck found the formula in 1900:
B(λ, T) = 2hc² / λ⁵ × 1 / (e^(hc / λkT) − 1)
where h is Planck's constant, c the speed of light and k Boltzmann's constant. The peak of the curve moves to shorter wavelengths as the temperature rises, following Wien's law: λ_max = 2898 µm·K / T. A filament at 2700 K peaks at 1.07 µm, deep in the infrared, so most of its power is heat. The Sun's surface, at 5772 K, peaks at 502 nm.
The model integrates Planck's curve against the CIE colour matching functions to get the colour of the lamp, then lights a card of six painted patches with it. The card is not white balanced to the lamp; it is balanced to daylight (6504 K), the way a camera set to "daylight" would record it. At 2700 K the white patch looks orange and the blue patch turns grey-green. Raise the temperature past 6500 K and everything turns bluish. Our eyes adapt to a lamp within a minute or so, which is why indoor light looks white to us but orange in photographs.
Colour temperature is also how lamps are labelled. A "warm white" LED is about 2700 to 3000 K, "cool white" about 4000 K and "daylight" about 6500 K. An LED is not a black body, so the number on the box is the black-body temperature whose colour is closest, the correlated colour temperature.
Line spectra: fingerprints of gases
A hot solid gives a smooth spectrum. A thin gas lit by an electric current gives only a few sharp lines, at wavelengths that belong to its atoms. Each line comes from an electron dropping from one energy level to a lower one; the energy difference fixes the wavelength. For hydrogen the visible lines follow a simple formula found by Balmer and Rydberg:
1/λ = R (1/2² − 1/n²), n = 3, 4, 5, 6
With the Rydberg constant corrected for the mass of the proton, this gives 656.47 nm for n = 3 in vacuum, or 656.29 nm in air. The NIST Atomic Spectra Database lists 656.279 nm. Computing all four Balmer lines this way and comparing them with NIST gives the same agreement.
Pick a gas with the slider. Sodium puts nearly all its visible light into two lines 0.6 nm apart at 589.0 and 589.6 nm, which is why sodium street lamps are orange-yellow and make colours hard to tell apart. Neon has more than a dozen strong lines between 585 and 703 nm and glows red-orange. Mercury gives violet, blue, green and a yellow pair; the green line at 546.07 nm has long been used to calibrate instruments. Helium's yellow line at 587.6 nm was seen in sunlight during the 1868 eclipse, 27 years before helium was found on Earth.
The last choice is sunlight, which shows the opposite: a continuous spectrum crossed by dark lines. Gases in the Sun's outer layers absorb exactly the wavelengths they would give off if heated. Fraunhofer measured hundreds of these lines from 1814 and named the strongest with letters; Kirchhoff and Bunsen showed in 1859 that his D lines sit where sodium shines. Move the wavelength cursor to read off any line.
Three kinds of cone
Daylight vision uses three kinds of cone cell. L cones respond most to long wavelengths, M cones to medium and S cones to short. Each cone only reports how strongly it is stimulated, not which wavelength did it. The brain compares the three signals. At 580 nm the model's L cones answer at their full strength, the M cones at 76% and the S cones hardly at all, and that ratio reads as yellow. A mix of red and green light can produce the same three signals, which is why a screen can show yellow without any 580 nm light at all.
The curves on the board are worked out from the CIE 1931 colour matching functions with the Hunt-Pointer-Estevez matrix, the transform used in the CIECAM02 colour appearance model. They peak at 576, 547 and 448 nm. Cone sensitivities measured directly, such as the Stockman and Sharpe (2000) functions, peak a little lower, at about 566, 541 and 441 nm. The CIE functions themselves come from colour matching experiments in the 1920s, in which observers matched a single wavelength by adjusting three primaries; Thomas Young had suggested three receptors in 1802.
Move the wavelength slider and watch the three bars. Between about 540 and 570 nm the L and M curves overlap heavily, so small changes in wavelength produce small changes in the L/M ratio. Outside 400 to 700 nm all three fall off, which is where the visible spectrum ends.
Seeing with two cone types
Red-green colour deficiency is far more common in men than in women, because the genes for the L and M pigments sit on the X chromosome. It usually means one cone type is shifted or missing. With only two working cone types (dichromacy), many colours that differ for normal vision look alike. Protans lack L cones, deutans lack M cones, and the much rarer tritans lack S cones. John Dalton described his own colour vision in 1794; DNA from his preserved eye, tested in 1995, showed that he was a deutan.
The board redraws itself as each type would see it. The method comes from Brettel, Viénot and Mollon (1997) and Viénot, Brettel and Mollon (1999): convert each colour to cone signals, then replace the missing cone's signal with a value worked out from the other two, chosen so that colours a dichromat is known to see normally keep their appearance. For protans and deutans those are white and blue; for tritans the method uses two half-planes anchored at 485 nm and 660 nm. White stays white for every type.
The dot plate hides a 5 drawn in orange-red dots among olive-green ones, with lightness mixed so that it gives nothing away. In normal vision the 5 stands out. In protan or deutan vision the two sets of dots fall close together and the number fades. The patches A and B measure the difference with ΔE, the CIE 1976 colour difference: about 1 is just noticeable, 40 is obvious. The task asks you to find a hue B that differs from A by more than 40 for normal vision but less than 6 for a deutan.
Structural colour in butterflies and feathers
The blue of a Morpho butterfly is not a pigment. Each scale carries ridges with stacked layers of chitin (n = 1.56) and air. Light reflecting from every layer adds up for a band of wavelengths and cancels elsewhere, the same thin-film effect as a soap bubble repeated many times. Kinoshita and colleagues measured the structure in 2002 and showed that slight irregularity between ridges spreads the colour over a wide range of angles.
The model uses an ideal stack: six pairs of 70 nm chitin and 120 nm air on a chitin base, calculated with the characteristic matrix method (the same method used to design optical coatings; for one layer it gives exactly the Airy result). Head on, the stack reflects 99% at 458 nm. Turn the viewing angle and the peak moves to shorter wavelengths: 415 nm at 30° and the violet edge near 380 nm at 45°. Real Morpho wings change colour less than this because their ridges are not perfectly regular.
Peacock feathers do something similar with a lattice of melanin rods in the barbules. Zi and colleagues showed in 2003 that changing the spacing of the lattice is enough to make the blue, green and brown of the eye pattern.
How the colours on this stage are worked out
Every coloured light on the second table starts as a spectrum: a filter curve, a reflectance, a Planck curve, a set of lines. To turn a spectrum into a screen colour, the model multiplies it by the three CIE 1931 colour matching functions and adds up the result every 5 nm from 380 to 780 nm. That gives the tristimulus values X, Y and Z. A standard matrix (IEC 61966-2-1) turns XYZ into the red, green and blue of an sRGB screen.
For speed the model uses the analytic fit of the CIE functions by Wyman, Sloan and Shirley (2013) rather than the full table. Compared with the CIE table at eight wavelengths, the fit is within 0.02 of the table values. Also, daylight D65 comes out as exactly white and that the black-body colours at 2856, 5000 and 6500 K fall within 0.002 of the published Planckian locus.
Many spectral colours lie outside what a screen can show. A pure 520 nm green, for example, is more saturated than any mix of the screen's primaries. The model keeps the hue and lightness and adds white until the colour fits. The prism and rainbow on the first table still use the simpler Bruton formula from version 1, scaled so all 25 traced wavelengths add back to white.
What the model leaves out
The colours on screen are approximate. A spectral colour such as 580 nm yellow cannot be shown exactly by a screen, which only mixes its own red, green and blue. Wavelengths are turned into screen colours with a simple piecewise formula and then scaled so that all 25 add back up to white.
The rays are traced in flat planes: the prism in the plane of the table and the drop in a vertical slice through its centre. The drop ignores the light lost by reflection at each surface, which in a real drop leaves only a few per cent for the bow, and treats the sun as a point rather than a disc half a degree wide. The filters are ideal, with no light lost along the transmission axis. Sizes are chosen to fit the bench; a real raindrop is a few millimetres across.
On the second table, the subtractive filters have smooth model curves rather than measured ones, the fluorescence peaks are typical values, the afterglow fades in seconds instead of hours, and the Morpho wing is a perfect stack of layers. The colour of the light box, the tank and the patches is shown relative to an equal-energy white. The discharge tubes show the strongest visible lines only; NIST lists many more, weaker ones.
A short history
In the beginning of 1666, as he later wrote, Isaac Newton bought a triangular glass prism and let sunlight from a hole in his window shutter fall through it onto the far wall. He expected a round spot. Instead the coloured image was oblong, about five times longer than it was wide. In his Experimentum Crucis he picked out one colour with a second board and a second prism and found that it was bent again by the same amount and did not change colour. He described this in a letter printed in the Royal Society's Philosophical Transactions in February 1672, and later in his book Opticks (1704).
Descartes' explanation of the rainbow angle appeared in 1637 with his Discourse on Method. In 1861 Thomas Sutton, working with James Clerk Maxwell, made the first lasting colour photograph by taking three pictures through red, green and blue filters and projecting them together. Étienne-Louis Malus described polarisation by reflection in work published in 1809. Edwin Land applied for his first patent on a sheet polariser in 1929; he lined up microscopic crystals by coating a plastic sheet and stretching it.
Questions
Why does a prism make colours?
Glass has a slightly higher refractive index for violet light than for red, so each colour is bent by a different amount. In BK7 the index is 1.5308 at 400 nm and 1.5131 at 700 nm. Through a 60° prism this spreads the colours over about 1.6°.
Is the light from a red, green and blue mix really white?
It looks white because it stimulates our three kinds of cone cell in about the same proportions as sunlight does. A spectrometer would show three separate peaks instead of a smooth spectrum.
Why do paints mix to brown or black instead of white?
Each paint absorbs part of the light. Mixing paints combines their absorption, so less light is left after each one. Light mixing adds light instead, so it gets brighter.
Why is a rainbow always round?
Each drop sends red light back at 42.4° from the point opposite the sun. All the drops that sit at that angle from your eye form a circle around that point. The ground usually hides the lower half.
Why is the sky darker outside a rainbow?
No once-reflected ray can leave a drop at more than about 42°. Inside the bow, light from many ray heights adds together. Outside it, there is none from the primary bow, so the sky looks darker there.
Can two polarising filters block all light?
Ideal filters crossed at 90° pass nothing, since cos² 90° = 0. Real sheet filters still leak a little light when crossed, so the view through them is very dark rather than perfectly black.
Why do polarised sunglasses cut glare?
Light reflected from water or a road is partly polarised, with its vibration mostly horizontal. The lenses pass vertical vibration, so much of the glare is absorbed while other light still gets through.
Why does a CD show a rainbow?
Its track is a spiral with turns 1.6 µm apart, so the surface acts as a reflection grating with about 625 lines per mm. Each wavelength leaves at its own angle, d sin θ = mλ: in the first order 400 nm at 14.5° and 650 nm at 24.0°.
Why do soap bubbles turn black before they pop?
Water drains to the bottom of the bubble and the top gets thinner. Below about 23 nm, the reflections from the front and back of the film cancel for every colour, so less than 1% of the light comes back and that spot looks black.
Why is the sky blue but sunsets red?
Air scatters short wavelengths more than long ones, as 1/λ⁴. Blue light scattered out of sunlight reaches you from all over the sky. At sunset the light crosses far more air, most of the blue is scattered away, and what reaches you is orange and red.
What does the K number on a light bulb mean?
It is the colour temperature: the temperature of a black body whose light has nearly the same colour. A 2700 K lamp looks warm and orange, 6500 K looks like daylight. For LEDs the number is the closest black-body match, not the temperature of anything in the lamp.
Why do neon signs glow red?
Neon atoms excited by the current give light at their own wavelengths. Most of neon's strong visible lines lie between 585 and 703 nm, in the orange and red. Other sign colours come from other gases, such as argon with mercury, or from coatings inside the tube.
How does a highlighter glow under UV?
Its dye takes in ultraviolet and gives out visible light of a longer wavelength, in green-yellow. Under daylight the same effect makes the ink look brighter than the light falling on it.
What do colour-blind people see?
It depends on which cone type is missing or shifted. With L or M cones missing, reds, oranges, olives and greens of the same lightness can look alike, while blues and yellows still differ. The colour vision board on this stage shows a simulation based on the Brettel, Viénot and Mollon method.
Why is a Morpho butterfly blue if its wings have no blue pigment?
Its scales have stacked layers of chitin and air about 200 nm apart. Light reflected from all the layers adds up for blue and cancels for other colours. Change the angle and the colour shifts, which pigments do not do.
Terms
- Refractive index (n): how many times slower light travels in a material than in a vacuum.
- Dispersion: the change of refractive index with wavelength, which splits white light into colours.
- Sellmeier equation: a formula fitted to measured indices that gives n for any wavelength.
- Minimum deviation: the smallest total bend a prism can give, reached when the beam crosses it parallel to the base.
- Total internal reflection: when light inside glass or water meets the surface beyond the critical angle and reflects instead of leaving.
- Additive mixing: combining lights, so that colours add toward white.
- Subtractive mixing: combining inks or filters, so that each removes part of the light.
- Antisolar point: the point in the sky directly opposite the sun, at the shadow of your head.
- Polarisation: the direction in which a light wave's electric field vibrates.
- Malus's law: I = I0 cos² θ, the light passed by a polariser at angle θ to the light's polarisation.
- Diffraction grating: a surface with many evenly spaced lines that sends each wavelength to its own angle.
- Order (m): which bright direction from a grating, counted out from the straight-through beam.
- Thin-film interference: colours made by light reflecting from the front and back of a very thin layer.
- Rayleigh scattering: scattering by particles much smaller than the wavelength, proportional to 1/λ⁴.
- Fluorescence: light given out at a longer wavelength while a material is lit, stopping almost at once.
- Phosphorescence: light given out slowly after the lighting stops.
- Black body: an ideal absorber whose glow depends only on its temperature (Planck's law).
- Colour temperature: the black-body temperature whose colour matches a light source.
- Line spectrum: the set of sharp wavelengths a gas gives off or absorbs.
- Cone cells (L, M, S): the three kinds of colour receptor in the retina.
- Colour matching functions: the CIE 1931 curves that turn a spectrum into X, Y and Z.
- Dichromacy: colour vision with two working cone types instead of three.
- ΔE: a measure of how different two colours look; the exhibit uses CIE 1976 Lab*.
- Structural colour: colour made by fine structure rather than pigment.
Sources
Addresses checked on 2026-10-16 and, for the second table, on 2026-10-18.
- RefractiveIndex.INFO, Optical constants of SCHOTT N-BK7 (Sellmeier coefficients). https://refractiveindex.info/?shelf=specs&book=SCHOTT-optical&page=N-BK7
- RefractiveIndex.INFO, Optical constants of H2O, Daimon and Masumura 2007, 24.0 °C (water index used for the drop). https://refractiveindex.info/?shelf=main&book=H2O&page=Daimon-24.0C
- RP Photonics Encyclopedia, Sellmeier formula. https://www.rp-photonics.com/sellmeier_formula.html
- The Newton Project, University of Oxford, A letter of Mr. Isaac Newton containing his New Theory about Light and Colors (1672). https://www.newtonproject.ox.ac.uk/view/texts/normalized/NATP00006
- MacTutor History of Mathematics, University of St Andrews, Isaac Newton (prism experiments, the 1672 letter, Opticks 1704). https://mathshistory.st-andrews.ac.uk/Biographies/Newton/
- HyperPhysics, Georgia State University, Primary Rainbow. http://hyperphysics.phy-astr.gsu.edu/hbase/atmos/rbowpri.html
- Atmospheric Optics (Les Cowley), Primary bow. https://www.atoptics.co.uk/rainbows/primary.htm
- MacTutor History of Mathematics, University of St Andrews, René Descartes (rainbow, Discourse on Method, 1637). https://mathshistory.st-andrews.ac.uk/Biographies/Descartes/
- James Clerk Maxwell Foundation, First Colour Photographic Image by Maxwell (Sutton's three exposures of a tartan ribbon through red, green and blue filters, 1861). http://www.clerkmaxwellfoundation.org/html/first_colour_photographic_image.html
- HyperPhysics, Georgia State University, Polarization. http://hyperphysics.phy-astr.gsu.edu/hbase/phyopt/polar.html
- HyperPhysics, Georgia State University, Crossed Polarizers (Malus's law). http://hyperphysics.phy-astr.gsu.edu/hbase/phyopt/polcross.html
- MacTutor History of Mathematics, University of St Andrews, Étienne Louis Malus (polarisation by reflection, 1808 and 1809). https://mathshistory.st-andrews.ac.uk/Biographies/Malus/
- Harvard Business School, Baker Library, Invention of the Polarizer (Land's first patent application for a light-polarizing sheet, 1929; crystals aligned by stretching a coated plastic sheet). https://www.library.hbs.edu/hc/polaroid/emergence-of-a-new-technology/invention-of-the-polarizer/
- CIE, CIE 1931 colour-matching functions, 2 degree observer (data table). https://cie.co.at/datatable/cie-1931-colour-matching-functions-2-degree-observer
- CIE, CIE standard illuminant D65 (data table). https://cie.co.at/datatable/cie-standard-illuminant-d65
- CIE, CIE standard illuminant A, 1 nm (data table). https://cie.co.at/datatable/cie-standard-illuminant-1-nm
- Wyman, C., Sloan, P.-P. and Shirley, P. (2013) Simple analytic approximations to the CIE XYZ color matching functions, Journal of Computer Graphics Techniques 2(2). https://jcgt.org/published/0002/02/01/
- Colour and Vision Research Laboratory (UCL), Cone fundamentals (Stockman and Sharpe 2000). http://www.cvrl.org/cones.htm
- NIST, Atomic Spectra Database, lines. https://physics.nist.gov/PhysRefData/ASD/lines_form.html
- NIST, Handbook of Basic Atomic Spectroscopic Data. https://www.nist.gov/pml/handbook-basic-atomic-spectroscopic-data
- High Altitude Observatory (NCAR), Joseph von Fraunhofer (1787-1826) (dark lines from 1814, grating of 260 wires in 1821). https://www2.hao.ucar.edu/education/scientists/joseph-von-fraunhofer-1787-1826
- MIT Spectroscopy Laboratory, History: classical spectroscopy (Kirchhoff and Bunsen, 1859). https://web.mit.edu/spectroscopy/history/history-classical.html
- Young, T. (1802) On the theory of light and colours, Philosophical Transactions 92: 12-48. https://doi.org/10.1098/rstl.1802.0004
- Stokes, G. G. (1852) On the change of refrangibility of light, Philosophical Transactions 142: 463-562. https://doi.org/10.1098/rstl.1852.0022
- Matsuzawa, T. et al. (1996) A new long phosphorescent phosphor with high brightness, SrAl2O4:Eu2+,Dy3+, Journal of The Electrochemical Society 143: 2670-2673. https://doi.org/10.1149/1.1837067
- Nobel Prize Outreach, Max Planck, Facts. https://www.nobelprize.org/prizes/physics/1918/planck/facts/
- International Astronomical Union, Resolution B3 (2015) on recommended nominal conversion constants (solar effective temperature 5772 K). https://www.iau.org/common/Uploaded%20files/IAUGA2015-Resolution-B3-recommended-nominal-conversion.pdf
- NASA Space Place, Why is the sky blue? https://spaceplace.nasa.gov/blue-sky/en/
- MacTutor History of Mathematics, University of St Andrews, John William Strutt (Lord Rayleigh). https://mathshistory.st-andrews.ac.uk/Biographies/Rayleigh/
- HyperPhysics, Georgia State University, Thin film interference. http://hyperphysics.phy-astr.gsu.edu/hbase/phyopt/thinfilm.html
- HyperPhysics, Georgia State University, Anti-reflection coatings. http://hyperphysics.phy-astr.gsu.edu/hbase/phyopt/antiref.html
- Ecma International, ECMA-130 (CD-ROM, track pitch 1.6 µm). https://ecma-international.org/publications-and-standards/standards/ecma-130/
- Ecma International, ECMA-267 (DVD, track pitch 0.74 µm). https://ecma-international.org/publications-and-standards/standards/ecma-267/
- Hunt, D. M. et al. (1995) The chemistry of John Dalton's color blindness, Science 267: 984-988. https://doi.org/10.1126/science.7863342
- Brettel, H., Viénot, F. and Mollon, J. D. (1997) Computerized simulation of color appearance for dichromats, JOSA A 14: 2647-2655. https://doi.org/10.1364/JOSAA.14.002647
- Kinoshita, S. et al. (2002) Mechanisms of structural colour in the Morpho butterfly, Proceedings of the Royal Society B 269: 1417-1421. https://doi.org/10.1098/rspb.2002.2019
- Zi, J. et al. (2003) Coloration strategies in peacock feathers, PNAS 100: 12576-12578. https://doi.org/10.1073/pnas.2133313100
- RefractiveIndex.INFO, Optical constants of SCHOTT F2. https://refractiveindex.info/?shelf=specs&book=SCHOTT-optical&page=F2
- RefractiveIndex.INFO, Optical constants of C (diamond), Peter 1923. https://refractiveindex.info/?shelf=3d&book=crystals&page=diamond
- Malitson, I. H. (1965) Interspecimen comparison of the refractive index of fused silica, JOSA 55: 1205-1209. https://doi.org/10.1364/JOSA.55.001205
More exhibits
How film cameras and instant cameras work
At 1/1000 of a second a camera shutter never uncovers the whole frame at once: a narrow slit sweeps across the film instead.
Travelling at the speed of light
Light goes round the equator 7.5 times in a second, yet the same light needs 2.5 million years to reach the Andromeda galaxy.
Animal vision: see the world through 69 animals’ eyes
A red ball on green grass is easy for you to find and surprisingly hard for a dog. A honeybee sees a pattern in the same flower that you cannot.
Optical illusions: why equal grey tiles look different
Tile A looks dark and tile B looks light, yet your screen sends the same grey to your eye from both.
How fibre optics and submarine cables work
Light in a submarine cable stays inside a glass core 8.2 micrometres wide for thousands of kilometres because it meets the core wall at more than 84.5°.
How does the eye focus on near and far objects? Try it in 3D
The cornea supplies about 43 of the eye's 60 dioptres, so why does the small lens behind it get all the credit for focusing?