FIG. 35Senses
Optical illusions: why equal grey tiles look different
Tile A looks dark and tile B looks light, yet your screen sends the same grey to your eye from both.
This device cannot show the 3D model. You can read the guide steps below as text.
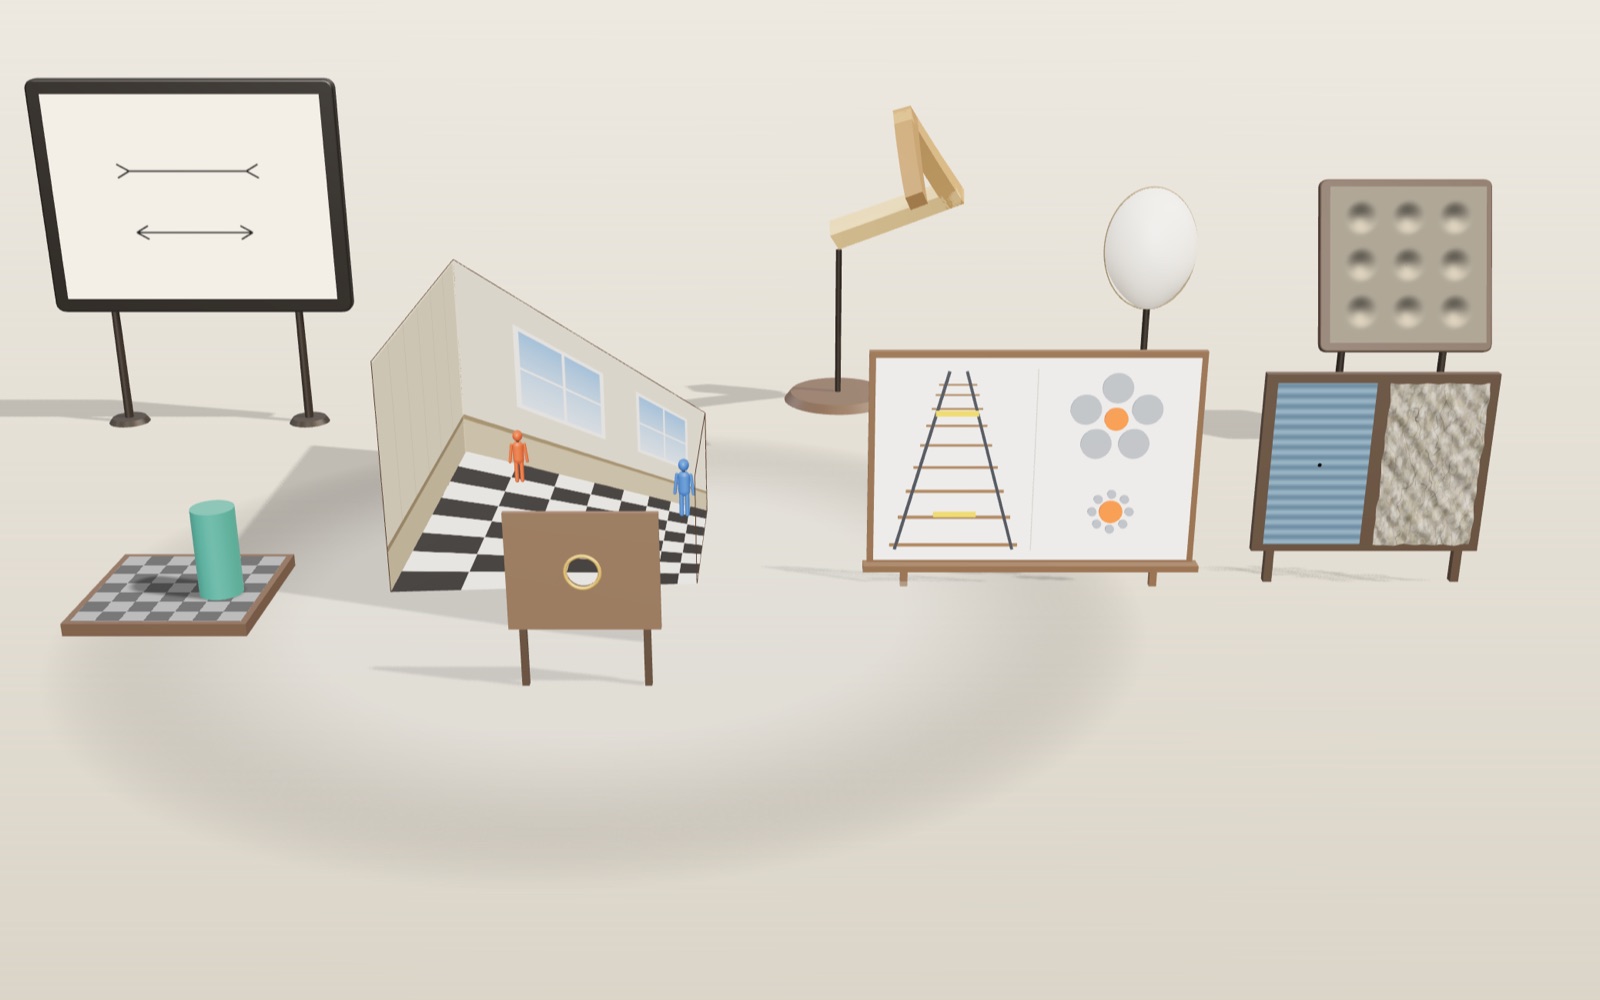
1 / 7 Four illusions in one galleryEach station rebuilds a known illusion in 3D: a checkerboard with a shadow, a distorted room, two size figures and a waterfall test. The bar under the picture jumps between them, and the box in the corner holds the measuring tools.
Drag to turn. Scroll or pinch to zoom.
Two tiles that send the same grey
Equal grey tiles can look different because vision uses surrounding light and shadow to judge a surface’s colour. In the checker-shadow illusion, the displayed tiles send the same light to your eye even though one looks lighter. Measuring their pixels or hiding the context separates the screen values from the visual impression.
Look at the checkerboard on the left of the gallery. Tile A sits in full light and looks dark. Tile B sits in the cylinder's shadow and looks light, almost white. Now turn on the eyedropper. It reads the pixel in the middle of each tile straight from the rendered picture, and both come back as 120 120 120. The two tiles send your eye exactly the same light.
This exhibit rebuilds four well-known illusions as small 3D models so that you can check them with tools instead of taking them on trust: a shadowed checkerboard after Edward Adelson, an Ames room, the Ponzo and Ebbinghaus size figures, and the waterfall illusion. For each one the article explains what has been measured about it, and where researchers still disagree.
Your eye judges paint, not light
The light that reaches your eye from a surface is the product of two things: how much light falls on the surface, and how much of that light the surface reflects. A white sheet in deep shade can send less light than a black sheet in sunlight. If vision simply reported the amount of light, every passing cloud would repaint the world. Instead we see the white sheet as white and the black sheet as black. Researchers call this lightness constancy: we judge the reflectance of a surface (its paint) rather than the light coming off it.
Adelson's checker-shadow figure, published in 1995, turns that skill against us. The visual system reads the scene as a checkerboard with a regular pattern and a cylinder casting a soft shadow. Tile B is a light square that happens to be in shadow, so its paint must be light. Tile A is a dark square in full light, so its paint must be dark. The answer about paint is correct. The answer about light, which is what the question asks, is wrong. Adelson himself described the figure as showing the success of the visual system rather than its failure, and the University of Glasgow's Illusions Index quotes him on that point.
How the brain arrives at that answer is less settled. One family of explanations works at a low level: neurons in the retina and early visual cortex respond to local contrast at edges more than to uniform regions, so a grey patch surrounded by darker tiles looks lighter. The other family works at a higher level: the brain estimates the lighting and divides it out, sometimes described as unconscious inference. The Illusions Index notes that there is no direct test for such inferences and that current theories combine both kinds of mechanism. A 2026 study in i-Perception by Lovell and colleagues removed parts of a related Adelson figure (the shadow, the outline edges, the sides of the blocks) and turned it upside down for 123 participants. Removing cues moved people from judging paint towards judging raw brightness, which supports the idea that the 3D reading of the scene drives the effect. The exact weighting of the low-level and high-level parts is still debated.
How this board keeps the numbers honest
A 3D renderer normally changes colours on the way to the screen. Lighting adds reflections, and tone mapping (a curve that squeezes bright values into the screen's range) bends every value a little. Either would make tiles A and B differ by a few levels, and the eyedropper would show it. So the board in this exhibit is drawn by its own small shader with no tone mapping and no environment light. Each point gets one number: paint times light.
- Light tiles reflect 0.5 of the light and dark tiles 0.1875, both in linear units.
- Full light is 1. Inside the core of the shadow the board receives 0.375.
- A dark tile in full light gives 0.1875 × 1 = 0.1875. A light tile in the core shadow gives 0.5 × 0.375 = 0.1875.
All three numbers are exact binary fractions, so the computer stores them without rounding. The shader then converts 0.1875 to the standard sRGB screen code once, which comes out at 120 out of 255. The other two tile types come out at about 188 (light tile in light) and about 75 (dark tile in shadow). The shadow itself is not painted on. It is calculated from the same light direction as the scene's main lamp: a point on the board is in shadow when the line from that point toward the lamp passes through the cylinder. Tile B was chosen as a light tile whose whole area lies inside the core of that shadow, and the soft edge of the shadow stays outside it.
Three tools let you check this yourself. The eyedropper reads tiles A and B and any point you click. Move a piece copies a square of pixels from the middle of A and slides it into B, where it disappears into the surrounding grey. Cover lays a grey card over the picture with two holes, and without the board around them the two patches look the same. The Cylinder position slider moves the cylinder away. Once B is back in full light, its real paint shows: the eyedropper reads about 188, and the two tiles no longer match.
The Ames room: a room built for one eye
Look through the peephole at the middle station and you see an ordinary room with a chequered floor, two windows and a figure in each back corner. The figure on the right looks about 1.75 times as tall as the one on the left. Use the Ames room view slider, or the Side view button, and the camera leaves the peephole. The room turns out to be a lopsided box. The left corner is far away, the floor slopes, and the two figures are the same size.
The trick is geometry, not paint. Every point on a sight line through the peephole lands on the same spot of the retina, however far along the line it is. In this model, each corner of a normal rectangular room was slid along its own sight line: corners on the left half to 1.7 times their distance, corners on the right half to 0.75 times. Every other point of the walls and floor was then moved to where its sight line meets the new, tilted surface. From the peephole the picture is unchanged, so the room still looks square, but the real floor is a trapezoid, as are the back wall and the windows. Hanover College's teaching notes on the Ames room describe the same thing in real rooms built for science museums in Melbourne, Keswick and Jerusalem: the trapezoids are invisible from the hole, so we read them as rectangles and then have to explain the figures as giants and dwarfs.
Brian Rogers, writing in Frontiers in Human Neuroscience in 2022, quotes Richard Gregory's point that a room built in strict perspective must look normal from the right position, because the image it creates is the same as for an ordinary room. Rogers argues that this makes the Ames room a facsimile rather than an illusion. He also notes that peephole viewing removes two strong depth cues: the difference between the two eyes' views, and the way near and far things shift when you move your head. Yet he reports that in his own experiments, letting people look with both eyes was not enough to override the room's perspective. Whether familiar shapes, perspective or the missing depth cues matter most is still argued over.
Same length, different size
The board at the third station holds two classic size figures, rebuilt as raised pieces on a flat panel. On the left, two yellow bars of equal length sit between rails that converge toward the top, like a railway running away from you. This is the Ponzo illusion, named after the Italian psychologist Mario Ponzo (1882 to 1960). Most people see the upper bar as longer. On the right, two orange discs of equal size sit among grey discs: one among five large ones, one among eight small ones. This is the Ebbinghaus illusion, after the German psychologist Hermann Ebbinghaus (1850 to 1909); Edward Titchener popularised it in a 1901 textbook, which is why it is also called Titchener circles. The disc among small neighbours usually looks larger.
The panel faces the camera head on in the tour, so equal pieces at equal depth give equal lengths on screen. The readout projects both ends of each bar and each disc onto the screen and reports the distance in pixels; on a 1440-pixel-wide window, both bars measure 110.4 px. The yellow ruler is there for checking by hand: drag it under one bar, note the reading, then drag it under the other. Switch Surroundings off and the rails, sleepers and grey discs disappear. With nothing around them, the pairs look equal.
Why the size explanations are still open
For the Ponzo figure, Richard Gregory proposed in Nature in 1963 that the converging lines are read as depth, and a mechanism that normally keeps distant objects from looking small is applied where it does not belong. He called it inappropriate constancy scaling. The Illusions Index lists two rival accounts: one based on perspective foreshortening alone, and one based on a mechanism that keeps the perceived tilt of objects stable. None has displaced the others.
The Ebbinghaus figure has its own open questions. Bela Julesz found that it still works when the discs exist only as a difference between two random-dot images for the two eyes, which means it must arise after the signals from both eyes are combined in the brain. In 1995 Aglioti, DeSouza and Goodale reported in Current Biology that people reaching to grasp the discs opened their fingers to the real size even when they reported the illusion, which was taken as evidence that vision for action and vision for perception are partly separate. Later work has argued over whether that result holds up, and the question is still debated.
People also differ in how strongly they see these illusions. In 2011 Schwarzkopf, Song and Rees reported in Nature Neuroscience that the surface area of the primary visual cortex, which varies a lot between individuals, was strongly and negatively correlated with the strength of two common size illusions. A larger visual cortex went with a weaker illusion. Why that should be is not yet known.
A short waterfall test, kept safe
In 1834 Robert Addams described looking at the Falls of Foyers in Scotland and then turning to the rocks beside it, which seemed to move upward. Similar reports go back to Aristotle, and in 1849 Joseph Plateau used a rotating spiral to produce the effect on demand. Today it is called the motion aftereffect. Anstis, Verstraten and Mather, reviewing it in Trends in Cognitive Sciences in 1998, describe it as arising in the visual cortex from selective adaptation of cells tuned to one direction of motion. After a while the cells that signal downward motion respond less, so a still scene produces a net signal for upward motion.
What that adaptation is for is less clear. The same review argues that simple neural fatigue is an unlikely cause and that the effect more likely reflects error correction or more efficient coding. The Illusions Index describes both a drop in response gain and a change in contrast gain as possible mechanisms. The details are still being worked out.
Moving stripes can make some people unwell, so this station is built to be gentle. The UK Epilepsy Society notes that around 3% of people with epilepsy are photosensitive, that flashing between 3 and 30 times a second is the common trigger, and that patterns are more likely to be a problem when they flash or change direction than when they are still or move slowly in one direction. The W3C accessibility guideline for web pages sets a limit of three flashes in any one second. Here the stripes are soft (Michelson contrast 0.26), drift in one direction only, change at any point once per second, never flash, and stop by themselves after 20 seconds. They start only when you press Start. The classic description uses about a minute of watching, so expect a weaker effect after 20 seconds. Some people notice nothing at all.
What the models leave out
- The checkerboard is lit by a single lamp, and its shadow is calculated, not traced. Real shadows also pick up light bounced from the surroundings.
- Your screen, its brightness setting and your room light all change what reaches your eye. The pixel values stay equal; the light from two parts of a screen can still differ slightly if the screen is uneven.
- The Ames room is shown on a flat screen, so even outside the peephole view you get no difference between your two eyes. A real room gives more depth cues once you step away.
- Illusion strength varies between people. The size readouts show what is on the screen, not what any one person sees.
From reflected light to a screen code
The equality on the checkerboard can be checked in two different spaces. In the model's linear-light calculation, both target tiles return 0.1875. In the stored image, each red, green and blue channel is about 120. These are not competing measurements. They describe the same model output before and after encoding. Adelson's original figure establishes the perceptual comparison; the particular reflectances and screen codes here belong to this reconstruction, not to a measurement of his printed illustration.
For a linear channel value L above 0.0031308, the standard conversion is C = 1.055 × L^(1/2.4) − 0.055. Substituting L = 0.1875 gives C about 0.4702. Multiplying by 255 gives about 119.9, rounded to 120. A light tile outside the shadow has L = 0.5, so C is about 0.7354 and its stored code is 188. The shader uses the same conversion for every tile. It does not secretly insert an equal-colour patch when you turn on the eyedropper.
It would be wrong to call 120 out of 255 roughly half the physical light of the display's maximum. The encoding is nonlinear. Under an ideal sRGB decoding, a code near 120 corresponds to approximately 0.1875 of the linear channel range, before considering the real display's black level and calibration. Likewise, averaging two stored codes is not generally the same as averaging their linear-light values. This distinction matters when analysing photographs, editing shadows or comparing screenshots.
Try the Cover tool before moving the cylinder. Cover changes the available surroundings without changing the two samples. Moving the cylinder changes the model's illumination, so B can genuinely become brighter. These are different interventions: one changes evidence used by vision, the other changes the signal being measured. Write down which intervention you made before deciding that the experiment contradicted itself.
Measuring a length illusion without assuming its strength
The size station provides equal bars and discs, not an adjustment task that measures your personal illusion strength. A ruler verifies physical equality, but it cannot report how long a bar seems to you. Psychophysics separates these questions with a matching task: hold a reference fixed, vary a comparison, and find the comparison that looks equal. Repeating comparisons in a mixed order helps distinguish a stable bias from an accidental response or an expectation about the experiment.
Here is an invented calculation, not a published result or a hidden feature of the exhibit. Suppose a reference is 100 mm long and a comparison must be shortened to 90 mm before the two look equal. The adjustment is 10 mm, or 10% of the reference length. Another experiment might divide by the comparison length instead, so percentages cannot safely be compared without checking the authors' definition. An error bar also matters: a single adjustment says little about repeatability. Screen zoom changes physical millimetres, whereas pixel readouts describe the rendered image; neither should be confused with retinal visual angle.
The Müller-Lyer arrow figure is a related example, but it is not one of this gallery's models. Its equal central lines look unequal when different end fins are added. Segall, Campbell and Herskovits investigated cultural differences in geometric illusions, publishing a Science article in 1963 and a book in 1966. The often-quoted explanation is the “carpentered world” hypothesis: frequent experience of right-angled buildings might affect interpretation of the fins as corners in depth.
The University of Glasgow's account also describes competing explanations based on conflicting length cues and distances between fin tips. Variants using circles instead of corners challenge a simple right-angle story. Cross-cultural differences do not by themselves isolate their cause: stimulus familiarity, procedure, age and other factors must be considered. Nor does a group average predict what every member sees. It is therefore misleading to label a whole population immune to illusions, or to treat one cultural comparison as proof that all visual organisation is learned.
Colour constancy and the dress photograph
The dress photograph that spread in 2015 asks a colour question related to the checkerboard's lightness question. The light reaching the eye depends on the illuminant as well as the surface. Under bluish illumination, a neutral surface sends a different mixture of wavelengths than under yellowish illumination. Colour constancy is the partial stability of perceived surface colour across such changes. It is useful, but an ambiguous photograph may not contain enough evidence to identify the illuminant uniquely.
Lafer-Sousa, Hermann and Conway studied the dress with a survey of 1,401 people, including 53 tested in a laboratory. Their report and the MIT presentation describe colour matching as well as verbal naming. This matters because a question offering only white/gold and blue/black could manufacture an apparent split by forcing everyone into two labels. The matching task instead found three groups: white/gold, blue/black and blue/brown. Adding clearer illumination cues could change the perceived colours. The experiment was about perception of the image, not a vote determining the fabric's physical reflectance.
A Bayesian account expresses the general inference as posterior probability proportional to likelihood times prior probability. The likelihood describes how compatible the available image is with a proposed surface and illumination; the prior describes expectations before that image is considered. If several combinations could produce similar pixels, expectations and surrounding cues can affect the resulting interpretation. This is a mathematical account of uncertainty, not a claim that a conscious observer calculates a formula or that every neuron explicitly stores probabilities.
The dress study cites Brainard and colleagues' Bayesian model of human colour constancy. Such models must still be tested against behaviour; saying “the brain guesses” is not a complete mechanism for every illusion. Retinal adaptation, local contrast and scene interpretation can all matter. The gallery contains no dress photograph or colour-vision diagnostic. Its checkerboard offers a narrower comparison: keep the pixel values fixed while removing context. A disagreement about the dress is not, by itself, evidence that someone is colour-blind or has a defective screen.
Adaptation is not the same as a moving picture
A motion aftereffect and a stationary picture that appears to move are different experiments. In the waterfall station, the stripes really do move first. You then inspect a stationary rock. The recent stimulation changes the balance of responses in motion-sensitive pathways, and a stationary scene may appear to drift the other way. Anstis and colleagues' review cautions against treating this solely as exhausted cells: adaptation can change response sensitivity and may serve efficient coding or recalibration.
Akiyoshi Kitaoka's Rotating Snakes is a stationary design, first dated 2003 on his Ritsumeikan University page. Repeated sequences of contrasting regions can make its rings appear to rotate even though the image file is not animated. His page also displays variants dated 2004. That demonstration is an external comparison, not another button in this exhibit. The existence of apparent motion does not prove that the pixels moved, and the absence of file animation does not establish which neural mechanism produced the experience. Explanations of peripheral drift concern visual responses to the pattern and changes in viewing, rather than a motor hidden in the picture.
Colour afterimages provide another useful distinction. Changes in sensitivity following sustained colour stimulation are not the same measurement as a motion aftereffect. Describing all aftereffects as “cone fatigue” wrongly assigns a motion phenomenon to the colour receptors alone. The present test neither isolates cone responses nor measures pigment recovery. It measures no neural activity at all: you observe a scene and report whether its apparent motion changed.
Do not extend the viewing time to force a stronger answer. The display stops after 20 seconds by design. If nothing happens, record no noticeable aftereffect under these conditions; do not conclude that your motion vision is absent. Fatigue, fixation, viewing distance and individual sensitivity can affect the experience. If you feel discomfort, stop immediately rather than repeating the trial. A museum demonstration is not a medical screening test.
A comparison you can repeat on this screen
Start at Shadow with the cylinder in its original position. Enable Eyedropper and record both tile values. Use Move a piece, then Cover, keeping the camera steady. Ask two separate questions each time: did the numerical samples change, and did the patches still look different? Next move Cylinder position until the shadow leaves B. Now a changed value is expected. Returning the cylinder tests whether the original equality returns, rather than relying on memory of how grey looked against a different surround.
At Size, note both pixel readings with Surroundings on, then turn Surroundings off without changing the view. Use Ruler on the same endpoints rather than on the outer edges of the decorative rails. At Ames room, compare Peephole with Side view. The figures' real heights stay equal, while their projections and the available room-shape cues change. Perspective differences at the side view are not a failed equality check of the original peephole image.
Keep browser zoom, window size and camera position fixed within a comparison. Record these conditions if you repeat it later or compare with a friend. A screenshot records pixels; it does not preserve your adaptation state, room lighting or the exact light emitted by another screen. Agreement between tools can establish equality in the model without making every viewer's experience identical. That is why the readouts and the visual impression belong alongside each other in your notes, rather than one being used to dismiss the other.
A catalogue of 39 illusions, sorted by what they fool
The light box at the back of the gallery holds 39 plates, each drawn by the exhibit itself. They are grouped by the judgement they upset: size (7 plates), lightness (8), colour (5), motion (6), shape (7) and depth (6). The grouping is a convenience rather than a theory. The Penrose triangle is listed under depth, yet it says as much about shape, and the checker shadow is as much about depth as about lightness. Each plate carries the name of the person who first described or popularised it, a year where the source gives one, one sentence on what to look for and one on the explanation most often given.
The years tell a story of their own. Most of the size and shape figures were described in Germany and Italy between 1855 and 1910, when physiologists and early psychologists drew them with pen and ruler. The lightness plates run from Chevreul's work on dyed fabrics in 1839 to Adelson's checker shadow in 1995. The motion plates are mostly younger: Fraser and Wilcox reported peripheral drift in Nature in 1979, Stuart Anstis described the stepping feet in 2001 and Jeremy Hinton made the lilac chaser in 2005. A few entries carry no year, because the sources checked for this exhibit do not give one with confidence. An empty year is better than a guessed one.
Search works on names and researchers, and the group buttons narrow the list. Opening a plate turns the camera to the light box, where the arrows step through the whole set. The stepping feet and the lilac chaser need motion, so they stay still until you press Play, run for 20 seconds and then stop. If your device asks for reduced motion, they stay still and the panel says so.
Measuring your own illusion
Seven plates can be measured: the Müller-Lyer, Ebbinghaus, Ponzo, Delboeuf and vertical and horizontal figures, simultaneous contrast and the Poggendorff figure. Press Measure it on the light box, or Start in the list of experiments, and a card opens over the stage. One figure is fixed. You change the other with the slider or the minus and plus buttons until the two look equal, then press Looks equal. This is the method of adjustment, one of the oldest procedures in psychophysics, and Michael Bach's Müller-Lyer page at the University of Freiburg asks visitors to do the same.
Each experiment has 3 tries. The first 2 start from opposite sides, once with the comparison 18 to 32% too large and once too small, in a random order. People tend to stop a little early when they approach from one side, so averaging the two cancels much of that habit. The third try removes the surroundings: the fins, the ring of discs, the rails or the dark and light backgrounds. With nothing to mislead you, that try should come out near zero. Whatever remains there is your ordinary setting error rather than the illusion.
The result is the point of subjective equality, the value at which the comparison looked equal to the standard. The illusion is the difference, given as a share of the standard. For the Müller-Lyer, a setting of 286 against a standard of 260 is a 10% illusion. The Poggendorff figure has no length to compare, so the offset you choose is given as a share of the width of the grey band. A positive number means the illusion went the usual way. A negative one means you saw it reversed, which does happen.
The results stay in this browser's storage on your device. Nothing is sent anywhere, and Clear results removes them. Treat a single run as a rough reading. Viewing distance, screen size and tiredness all move the numbers, and Schwarzkopf and colleagues found large differences between people in the strength of size illusions.
An impossible triangle you can walk around
Lionel and Roger Penrose published their triangle in the British Journal of Psychology in 1958 as a special type of visual illusion. Each corner is a sensible right-angled joint, but the three corners cannot belong to one solid. The 3D station builds a real object that gives the same picture. Three straight beams run along three edges of an imaginary cube, so the far end of the first beam and the near end of the third lie on one line through a single viewpoint. From that point the two ends cover each other and the picture closes.
A camera does not make a parallel projection. The near end would look larger than the far end and give the trick away. So every point of the beams was moved along its own sight line from the viewpoint, the same method used for the Ames room. The far beam keeps its size, and the near end of the third beam shrinks to about 0.67 of its width, which nobody notices from the right spot. The readout gives the gap between the two ends in beam widths and says Closed when the gap falls below 0.2 of a width. Walk around and the beams open into a twisted zigzag.
Hollow shapes and light from above
Hill and Bruce reported in Perception in 1993 that lighting, orientation and stereo vision each have separate effects on the hollow-face illusion, in which the inside of a mask looks like a face bulging outward. Richard Gregory argued in 1997 that knowledge of what objects are usually like can override the depth cues in the image. Faces are the strongest case, because we almost never see one inside out. This exhibit does not model human faces, so the 3D station shows the same trick on a dragon, after the folded paper dragon designed by the magician and illusion maker Jerry Andrus. Its body, wings and ears are ordinary convex paper, but the head is hollow: the snout is the deepest point and the cheeks lean toward you. A lamp of its own sits below and in front, so the hollow head shades like a solid head lit from above. A camera sees with one eye, so the head tends to look solid, and as the model sways or you move the camera, the head seems to turn the opposite way and keep facing you. Turn it side on and the hollow is plain to see.
The shading tray isolates the other half of the story. V. S. Ramachandran showed in Nature in 1988 that discs shaded from light to dark are read as bumps or dents depending on which way the shading runs, because vision assumes light comes from above. The tray in the gallery has nine real dents, built into the surface and lit by a lamp that only this tray sees. With the lamp above they look like dents. Switch it below and most people see bumps, although nothing on the tray has moved. The side view shows the true shape.
Why every picture here is redrawn
Many famous illusion images are artworks with an owner. Akiyoshi Kitaoka's page marks each Rotating Snakes picture with his copyright, so this exhibit does not show them. The peripheral drift plate is a new drawing that follows the rule Kitaoka and Ashida described in 2003: segments in the order black, dark blue, white and light yellow, repeated around rings. The Enigma plate is likewise a simple approximation of the layout of Isia Léviant's painting, not a copy. Every other plate is a geometric figure drawn from its published description, and each one links to the source that description came from.
For Enigma, the catalogue year 1982 means Léviant's first published report of the L-effect in Leonardo, not the date of every version of the artwork. The research literature dates the original design to 1981. Zeki and colleagues studied it in 1993; the National Gallery of Art dates its print to about 1984. The original design, first report, brain study and later print are different events.
Questions
Are tiles A and B really the same colour?
Yes, on the screen. The eyedropper reads the same three numbers, usually 120 120 120, from the middle of both. The painted surfaces they represent are different: B stands for a light tile and A for a dark one. Move the cylinder and B shows its real value of about 188.
Why doesn't knowing the answer make the illusion go away?
The judgement of lightness is made early and automatically, before you can reason about it. The Illusions Index uses the Ponzo figure to discuss this: knowing the lines are equal does not change how they look. Covering the surroundings is the reliable way to see the equality.
Does the checker-shadow illusion work in real life?
In a real scene, a light tile in shadow really is light paint, so seeing it as light is correct. The figure fools us only because the question asks about the light reaching the eye, not about the paint.
Why do I need to look through the peephole of the Ames room?
From that one point the distorted room makes the same image as a rectangular room. Any other viewpoint, or depth from two eyes and head movement, gives the shape away. Move the view slider a little and the room starts to look odd.
How long should I watch the waterfall stripes?
Twenty seconds here, which is short on purpose. Classic descriptions use about a minute. Keep your eyes on the dot, then look at the rock straight away. If the moving stripes make you uncomfortable, press Stop or look away.
Is the waterfall test safe if I have photosensitive epilepsy?
The stripes do not flash, move slowly in one direction and have low contrast, which avoids the most common triggers listed by the Epilepsy Society. Sensitivity differs between people, so if you have photosensitive epilepsy, skip the test or ask your doctor.
Why do some people see the size illusions more strongly than others?
One study found that people with a larger primary visual cortex saw two size illusions more weakly. Why that should be is not yet agreed.
Can the ruler measure how strongly I see the illusion?
No. It measures displayed geometry. Measuring subjective strength requires an adjustment or comparison task with repeated responses, which this station does not provide.
Does the dress show that only two colour perceptions are possible?
No. The 2015 matching study found white/gold, blue/black and blue/brown groups. Forced-choice colour names alone would miss part of that variation.
Are Rotating Snakes and the waterfall effect the same thing?
No. Rotating Snakes is a stationary pattern that appears to move. The waterfall effect follows adaptation to actual motion. The snakes are not displayed at this station.
Does 120 on the eyedropper mean half the maximum light?
No. The sRGB code is nonlinear. In this model, 120 corresponds approximately to a linear channel value of 0.1875, not half the range.
Is my measured illusion normal?
There is no single normal value to compare it with here. The strength of an illusion depends on the exact figure (the angle of the fins, the number and size of the discs, the line widths) and on viewing distance, and people differ widely. Compare your result with your own control try, and with a repeat on another day, rather than with a published value for a different drawing.
Why does the Penrose triangle close only from one spot?
The ends only line up along one sight line. Move the camera a little and the far end of the first beam and the near end of the third separate in the picture. The readout shows that gap in beam widths, so you can steer back until it says Closed.
Why is there no Rotating Snakes picture?
Kitaoka's images carry his copyright. The catalogue shows a peripheral drift plate drawn by this exhibit, following the published rule, and its source links lead to the research behind it.
Terms
- Lightness: how light or dark a surface's paint looks, as opposed to how much light comes from it.
- Lightness constancy: seeing a surface as the same shade under different lighting.
- Linear value: a number proportional to the amount of light, before conversion to screen codes.
- sRGB: the standard way of turning linear light values into the 0 to 255 codes stored for each pixel.
- Tone mapping: a curve a renderer applies to fit bright scenes into the screen's range. It is switched off for the checkerboard here.
- Ames room: a distorted room that gives the same image as a rectangular room from one viewpoint.
- Size constancy: seeing an object as the same size at different distances, even though its image shrinks.
- Motion aftereffect: apparent motion of a still scene after watching motion in one direction.
- Michelson contrast: the difference between the brightest and darkest luminance divided by their sum.
- Method of adjustment: a way of measuring perception in which the observer changes one figure until it matches another.
- Point of subjective equality: the setting at which the observer judges the two figures equal.
Sources
All addresses checked on 2026-10-16.
Centre for the Study of Perceptual Experience, University of Glasgow, The Illusions Index, Adelson's Checker-Shadow Illusion. https://www.illusionsindex.org/i/adelson-s-checker-shadow-illusion
Lovell, Scott-Brown, Smart and colleagues, Understanding the image cues driving the switch from brightness to lightness responses in the Adelson checker-block illusion, i-Perception 17 (2026), PubMed Central. https://pmc.ncbi.nlm.nih.gov/articles/PMC12876641/
Michael Bach, University of Freiburg, Adelson's Checker-shadow illusion. https://michaelbach.de/ot/lum-adelsonCheckShadow/
Rogers, When is an illusion not an illusion? An alternative view of the illusion concept, Frontiers in Human Neuroscience (2022). https://www.frontiersin.org/articles/10.3389/fnhum.2022.957740/full
Hanover College, ISLE (Schwartz and Krantz, Sensation and Perception), Ames Room. https://isle.hanover.edu/isle3/Ch07DepthSize/Ch07AmesRoom.html
Centre for the Study of Perceptual Experience, University of Glasgow, The Illusions Index, Ponzo Illusion. https://www.illusionsindex.org/i/ponzo-illusion
Centre for the Study of Perceptual Experience, University of Glasgow, The Illusions Index, Ebbinghaus Illusion. https://www.illusionsindex.org/i/ebbinghaus-illusion
Gregory, Distortion of Visual Space as Inappropriate Constancy Scaling, Nature 199 (1963). https://www.nature.com/articles/199678a0
Aglioti, DeSouza and Goodale, Size-contrast illusions deceive the eye but not the hand, Current Biology (1995). https://doi.org/10.1016/S0960-9822(95)00133-3
Schwarzkopf, Song and Rees, The surface area of human V1 predicts the subjective experience of object size, Nature Neuroscience (2011). https://www.nature.com/articles/nn.2706
Anstis, Verstraten and Mather, The motion aftereffect, Trends in Cognitive Sciences (1998). https://doi.org/10.1016/S1364-6613(98)01142-5
Centre for the Study of Perceptual Experience, University of Glasgow, The Illusions Index, Waterfall Illusion. https://www.illusionsindex.org/i/waterfall-illusion
Michael Bach, University of Freiburg, Motion Aftereffect (Waterfall Illusion). https://michaelbach.de/ot/mot-adapt/
Epilepsy Society (UK), Photosensitive epilepsy. https://www.epilepsysociety.org.uk/about-epilepsy/epileptic-seizures/seizure-triggers/photosensitive-epilepsy
W3C Web Accessibility Initiative, Understanding Success Criterion 2.3.1: Three Flashes or Below Threshold (WCAG 2.2). https://www.w3.org/WAI/WCAG22/Understanding/three-flashes-or-below-threshold.html
University of Glasgow, Müller-Lyer illusion. https://www.illusionsindex.org/i/mueller-lyer
MIT, Rosa Lafer-Sousa, Colour perception and cognition uncovered by the dress (2015). https://bcs.mit.edu/events/mechanisms-color-perception-and-cognition-uncovered-thedress
Akiyoshi Kitaoka, Ritsumeikan University, Rotating snakes. https://www.ritsumei.ac.jp/~akitaoka/rotsnakee.html
W3C, CSS Color Module Level 4, sRGB encoding and decoding. https://www.w3.org/TR/css-color-4/#color-conversion-code
Added for the catalogue, the experiments and the 3D station, all addresses checked on 2026-10-27:
Penrose and Penrose, Impossible objects: a special type of visual illusion, British Journal of Psychology 49 (1958). https://doi.org/10.1111/j.2044-8295.1958.tb00634.x
Ramachandran, Perception of shape from shading, Nature 331 (1988). https://doi.org/10.1038/331163a0
Hill and Bruce, Independent effects of lighting, orientation, and stereopsis on the hollow-face illusion, Perception 22 (1993). https://doi.org/10.1068/p220887
Gregory, Knowledge in perception and illusion, Philosophical Transactions of the Royal Society B 352 (1997). https://doi.org/10.1098/rstb.1997.0095
Fraser and Wilcox, Perception of illusory movement, Nature 281 (1979). https://doi.org/10.1038/281565a0
Gregory and Heard, Border locking and the Café Wall illusion, Perception 8 (1979). https://doi.org/10.1068/p080365
Anstis, Footsteps and inchworms: illusions show that contrast affects apparent speed, Perception 30 (2001). https://doi.org/10.1068/p3211
Schrauf, Lingelbach and Wist, The scintillating grid illusion, Vision Research 37 (1997). https://doi.org/10.1016/S0042-6989(96)00255-6
White, A new effect of pattern on perceived lightness, Perception 8 (1979). https://doi.org/10.1068/p080413
Pinna and Brelstaff, A new visual illusion of relative motion, Vision Research 40 (2000). https://doi.org/10.1016/S0042-6989(00)00072-9
Pinna, Brelstaff and Spillmann, Surface color from boundaries: a new watercolor illusion, Vision Research 41 (2001). https://doi.org/10.1016/S0042-6989(01)00105-5
Michael Bach, University of Freiburg, Müller-Lyer Illusion. https://michaelbach.de/ot/sze-muelue/
Michael Bach, University of Freiburg, Impossible Objects. https://michaelbach.de/ot/cog-imposs1/
Michael Bach, University of Freiburg, Rotating face mask. https://michaelbach.de/ot/fcs-hollowFace/
Michael Bach, University of Freiburg, Shape from shading. https://michaelbach.de/ot/lum-shapeFromShading/
Michael Bach, University of Freiburg, Rotating Snakes Illusion. https://michaelbach.de/ot/mot-snakes/
Michael Bach, University of Freiburg, Lilac Chaser. https://michaelbach.de/ot/col-lilacChaser/
Michael Bach, University of Freiburg, Necker Cube. https://michaelbach.de/ot/sze-Necker/
Michael Bach, University of Freiburg, Kanizsa Illusion. https://michaelbach.de/ot/cog-Kanizsa/
Michael Bach, University of Freiburg, Enigma. https://michaelbach.de/ot/mot-enigma/
Centre for the Study of Perceptual Experience, University of Glasgow, The Illusions Index, Vertical-Horizontal Illusion. https://www.illusionsindex.org/i/vertical-horizontal-illusion
Centre for the Study of Perceptual Experience, University of Glasgow, The Illusions Index, Zöllner Illusion. https://www.illusionsindex.org/i/zoellner-illusion
Léviant (1982), Illusory Motion within Still Pictures: The L-Effect, Leonardo 15(3), 222–223. https://www.jstor.org/stable/1574685
Zeki et al. (1993), Going beyond the information given: the relation of illusory visual motion to brain activity. https://doi.org/10.1098/rspb.1993.0068
Illusory motion in Enigma: A psychophysical investigation, PNAS (2006), original design dated 1981. https://pmc.ncbi.nlm.nih.gov/articles/PMC1413651/
National Gallery of Art, Enigma, c. 1984, collection 2015.19.3063. https://www.nga.gov/artworks/170882-enigma
Gathering 4 Gardner, Jerry Andrus, 3-D Paper Dragon (printable model; the exhibit models the same structure itself). https://www.gathering4gardner.org/wp-content/uploads/2021/03/3D-dragon.pdf
Hill and Johnston, The hollow-face illusion: object-specific knowledge, general assumptions or properties of the stimulus?, Perception 36 (2007). https://doi.org/10.1068/p5523
Course 8 of 8
Light and soundMore exhibits
How does the eye focus on near and far objects? Try it in 3D
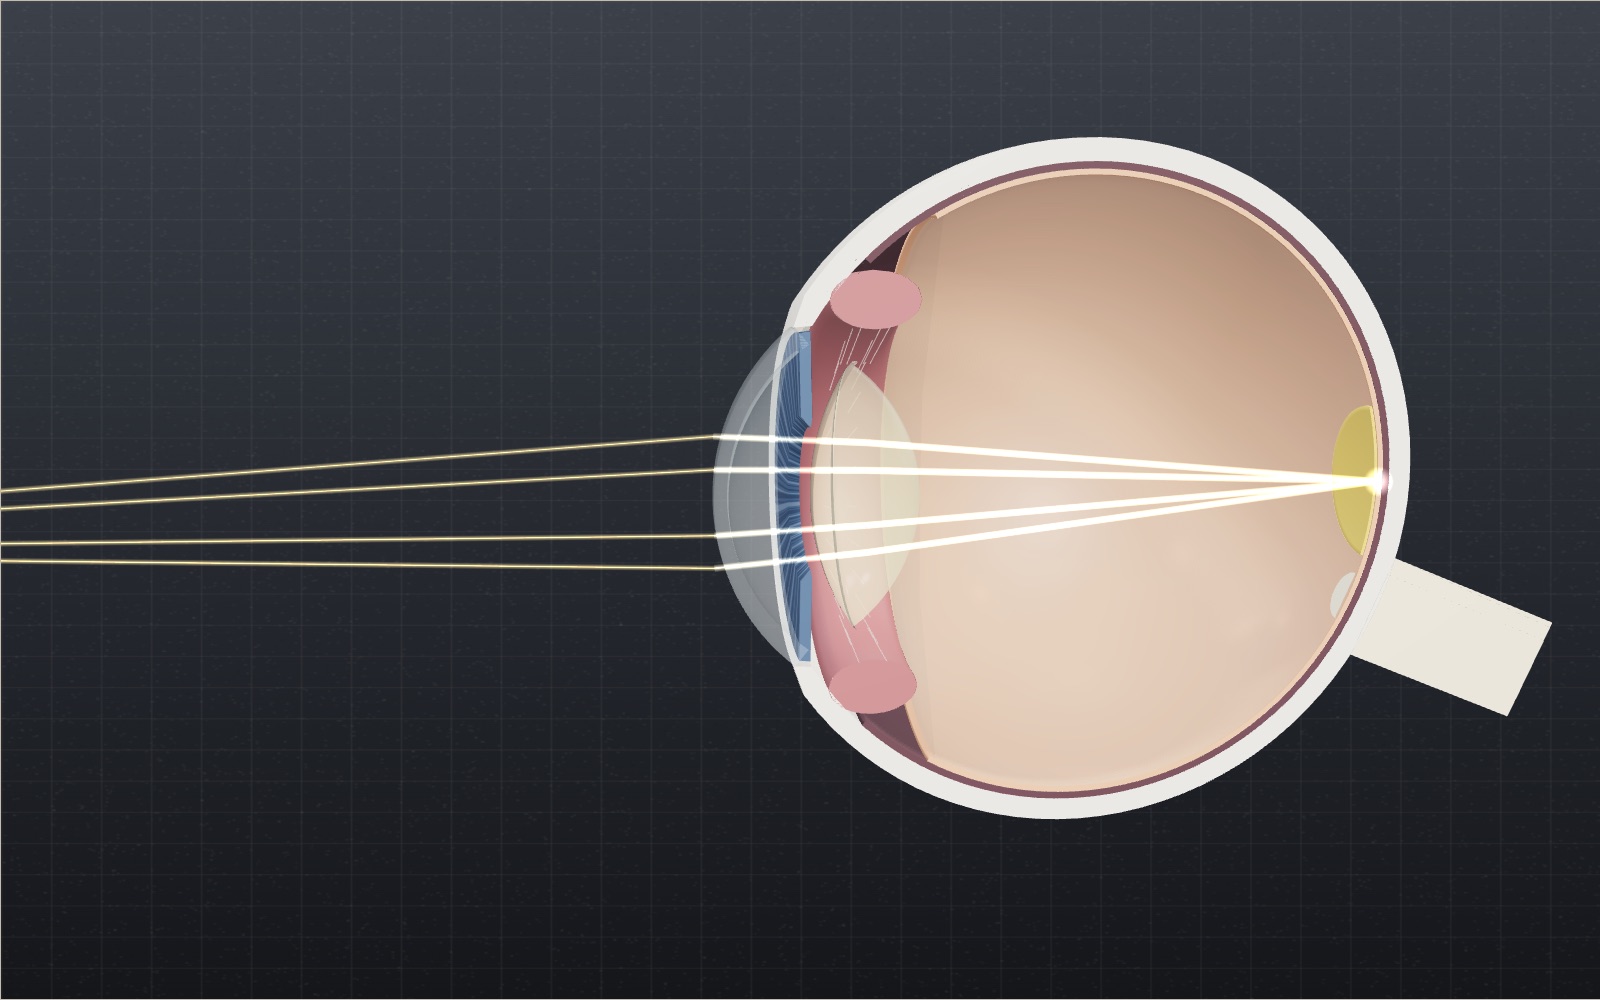
The cornea supplies about 43 of the eye's 60 dioptres, so why does the small lens behind it get all the credit for focusing?
How film cameras and instant cameras work
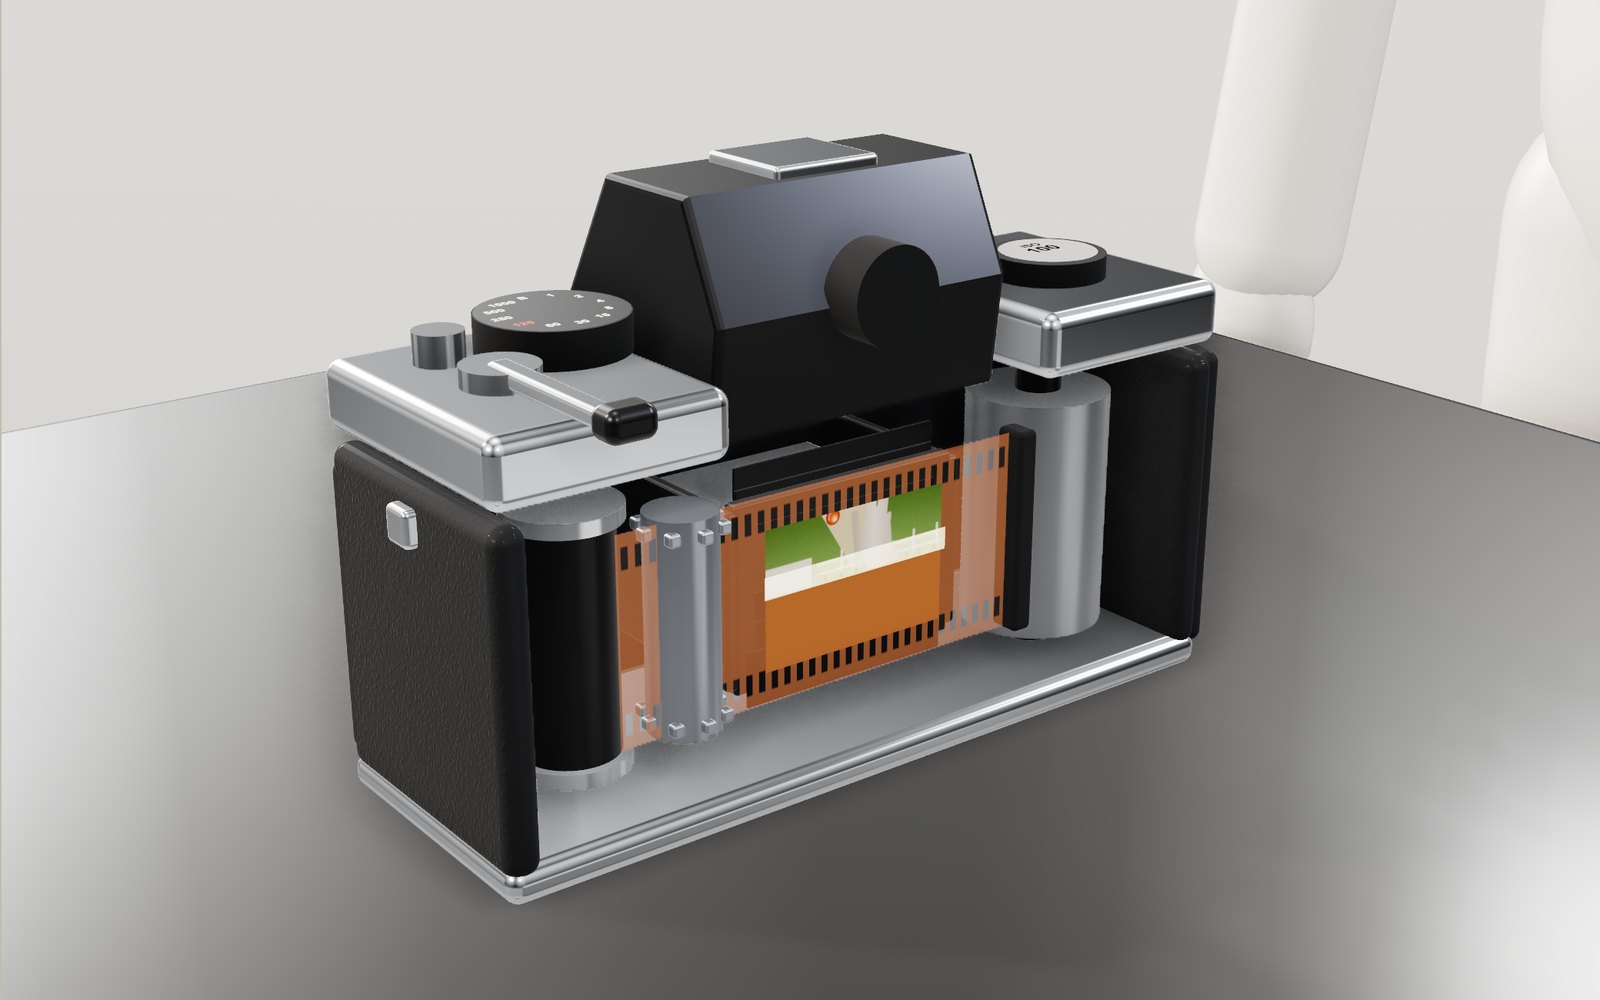
At 1/1000 of a second a camera shutter never uncovers the whole frame at once: a narrow slit sweeps across the film instead.
Travelling at the speed of light
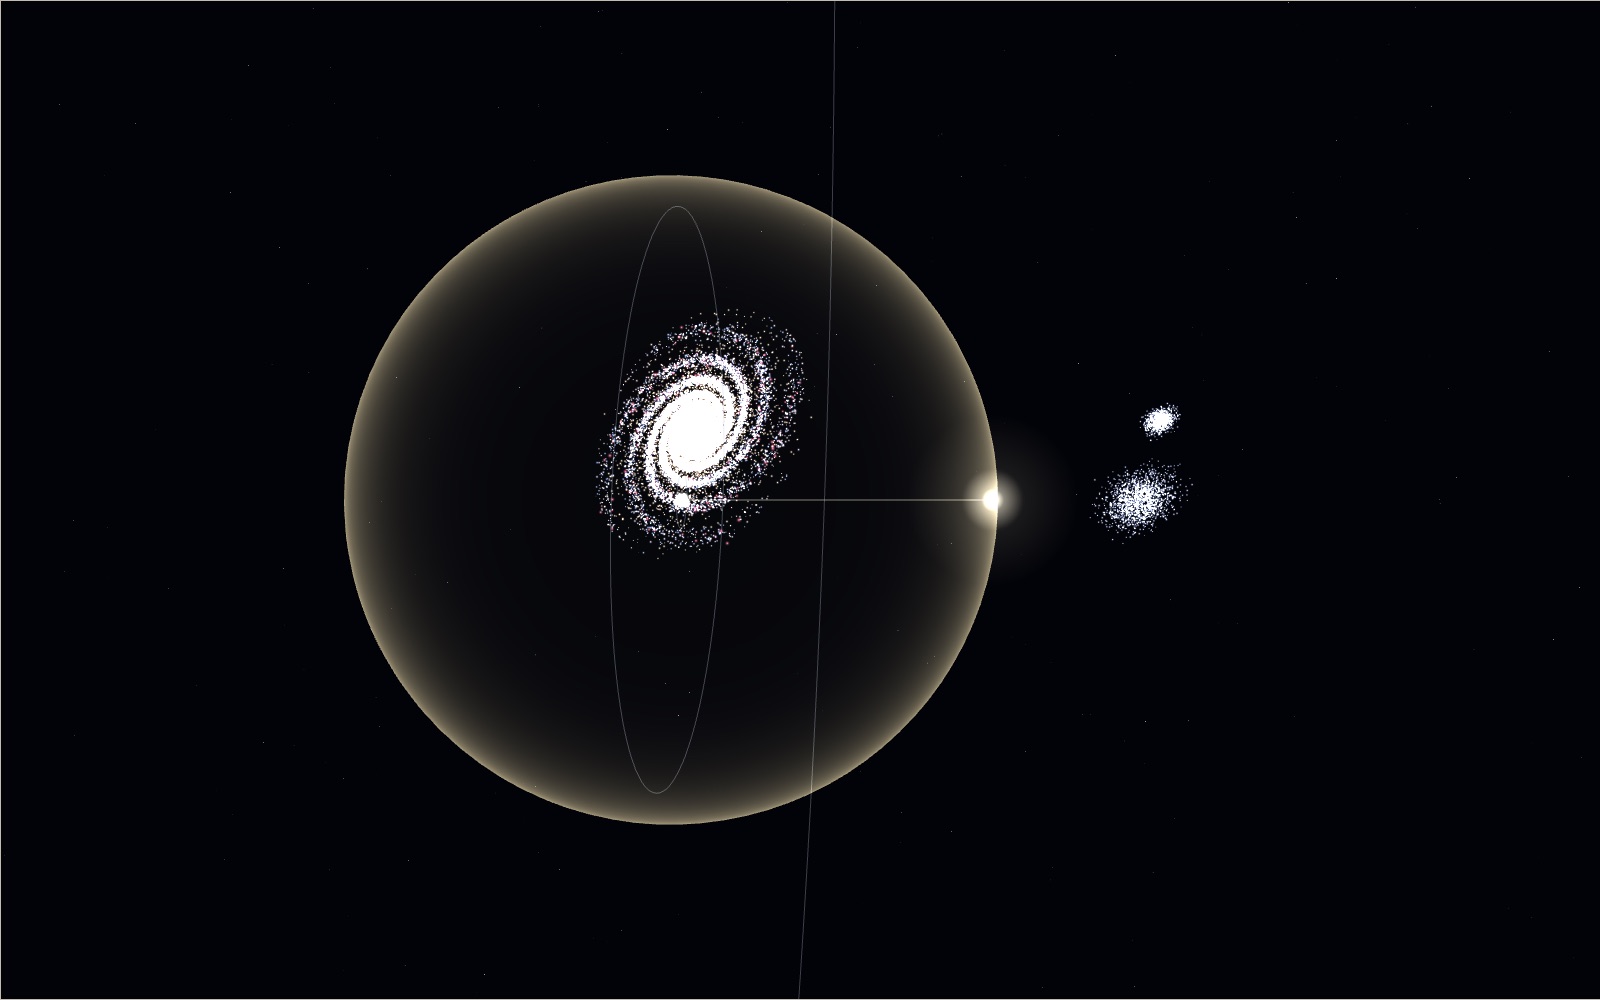
Light goes round the equator 7.5 times in a second, yet the same light needs 2.5 million years to reach the Andromeda galaxy.
Animal vision: see the world through 69 animals’ eyes
A red ball on green grass is easy for you to find and surprisingly hard for a dog. A honeybee sees a pattern in the same flower that you cannot.
Light and colour, from prisms to polarisers
A glass prism bends violet light about 1.6 degrees more than red, and that small gap is all it takes to spread white light into a spectrum.
How fibre optics and submarine cables work
Light in a submarine cable stays inside a glass core 8.2 micrometres wide for thousands of kilometres because it meets the core wall at more than 84.5°.
How a solar panel works
In full sun a 60-cell rooftop panel makes about 300 watts, and all of it comes from an electric field sitting inside each slice of silicon.
How photosynthesis works
A leaf in full sun pulls carbon dioxide out of air that holds only about 426 parts per million of it, and builds sugar from it.
What happens to your body in space without a suit
Without a suit you would have about 10 seconds of useful consciousness, and if air came back within a minute or so you might well recover. You would not explode.
Northern lights over an Arctic village
The green of the northern lights comes from oxygen about 100 km up, and in the biggest storms the red glow above it can be seen as far south as Korea.
How a QR code is read
Cover 30 % of a QR code with your hand and a phone still reads it. Cover one corner and it does not.
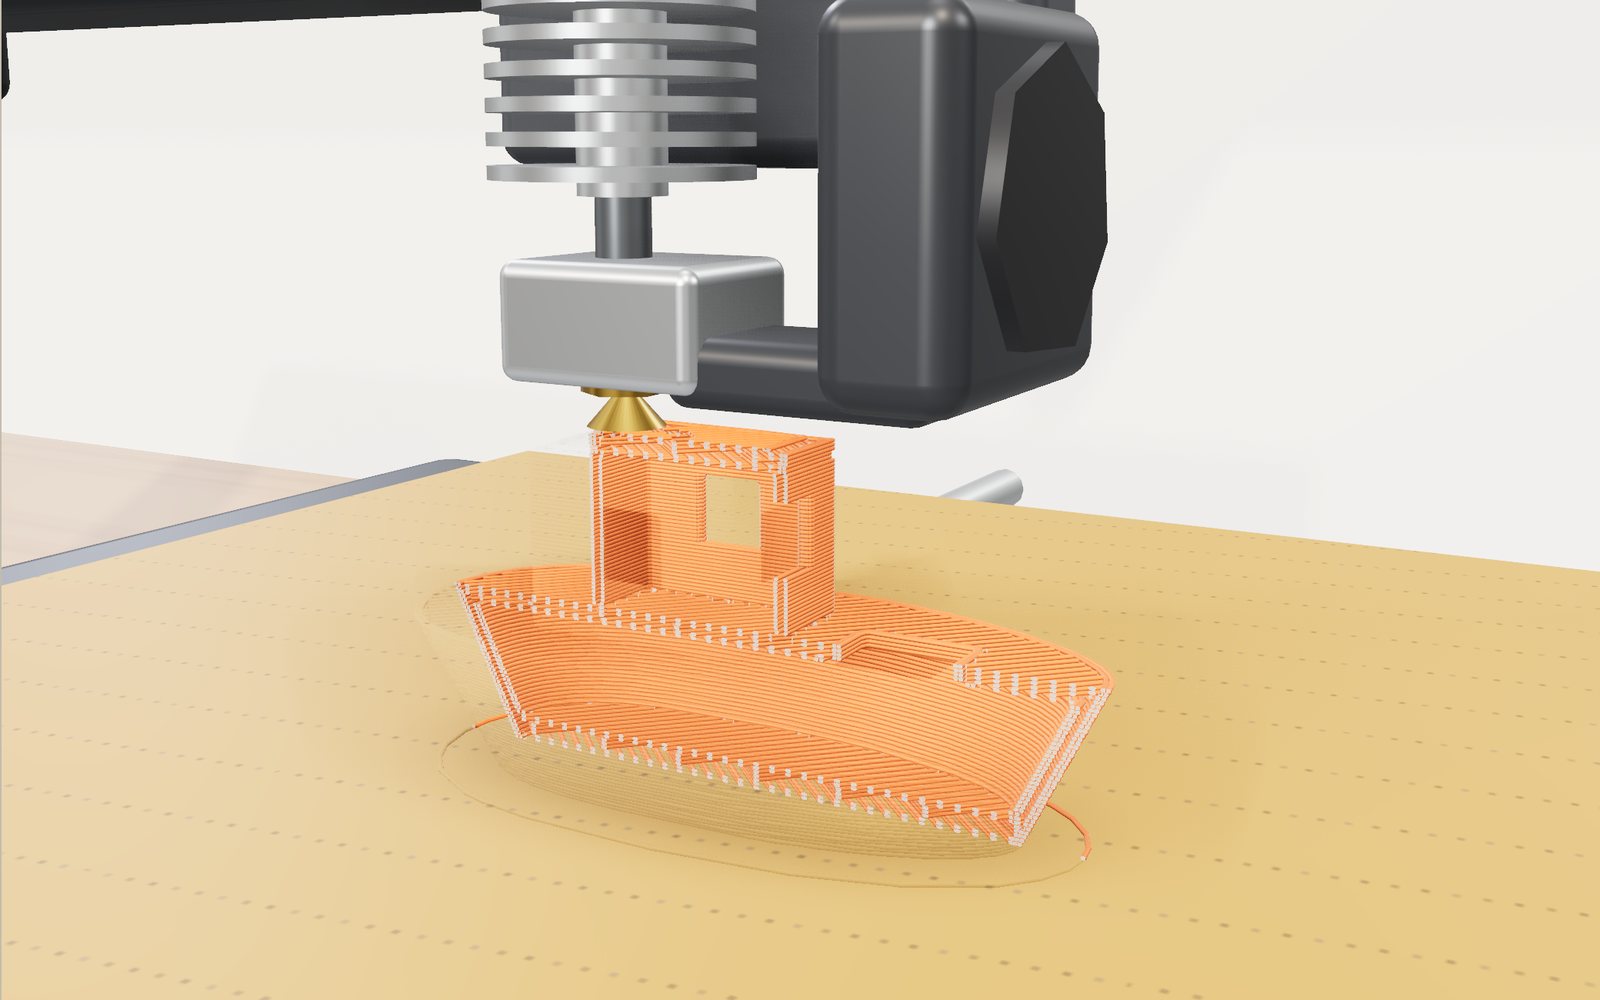
How a 3D printer works, layer by layer
A 20 mm cube printed in 0.2 mm layers is exactly 100 layers, each drawn by a nozzle 0.4 mm wide.