FIG. 20Senses
What sound looks like: sound waves, frequency and decibels
A 440 Hz tone packs the air into dense layers 78 centimetres apart, yet even at 94 dB each bit of air moves less than a thousandth of a millimetre.
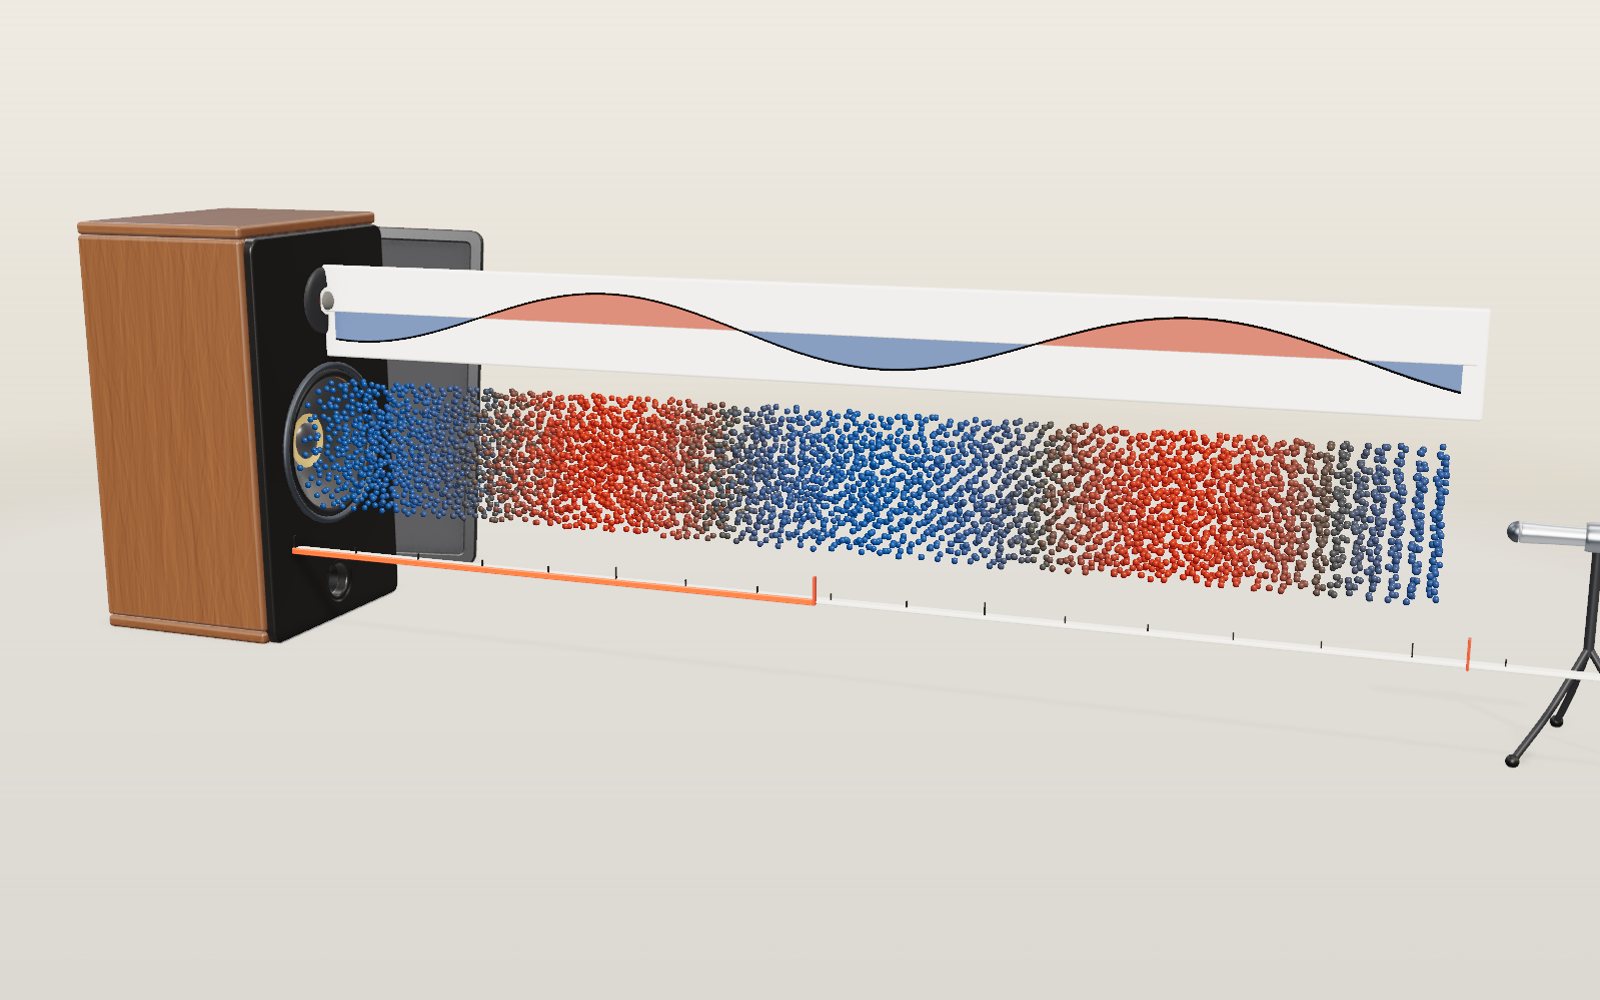
This device cannot show the 3D model. You can read the guide steps below as text.
1 / 18 A speaker and a beam of airThis is a loudspeaker playing a steady tone into a beam of air, at real size and slowed down. The buttons along the top of the stage open eight more scenes; the screens under the stage show the same sound as a waveform, a spectrum and a spectrogram.
Drag to turn. Scroll or pinch to zoom.
What travels from a speaker to your ear
Put your hand in front of a loudspeaker playing a deep bass note and you can feel it push. Turn the music down to a normal level and you feel nothing, yet you still hear every note from across the room. So what is actually crossing the room? Not the air near the speaker: that stays more or less where it is. What crosses the room is a pattern of tiny pressure changes, passed from one layer of air to the next.
The model above makes that pattern visible. A speaker cone pushes on a beam of air, drawn as dots, and the dots bunch up and spread out as the wave goes by. Distances in the model are real: the ruler under the beam is in metres. Time is not. The cone of a real speaker playing 440 Hz moves back and forth 440 times a second, so the model slows it down several hundred times, and it also exaggerates how far each dot moves. The box in the corner of the model prints both factors. Under the model, three screens show the same sound the way an audio engineer would look at it: as a waveform, a spectrum and a spectrogram.
The buttons along the top of the stage open eight more scenes that follow sound further: a ladder of everyday decibel levels, the inside of the ear, a guitar string, a pipe and a drum, a passing ambulance and a supersonic jet, a room that rings after a clap, a tube in which dust gathers into a standing-wave pattern, a race through eight materials, and a noise-cancelling headphone. The screens under the stage always show what the current scene sounds like.
Why the air moves in layers
A loudspeaker is a motor with a paper piston. A coil of copper wire sits in the narrow gap of a permanent magnet. When a current flows through the wire, the magnetic field pushes on it, and because the coil is glued to the cone, the cone moves too. Reverse the current and the cone moves the other way. Feed the coil an alternating current and the cone copies it.
When the cone moves forward it squeezes the air directly in front of it. That squeezed layer pushes on the next layer, which pushes on the next, and so on. When the cone pulls back, it leaves a layer where the air is slightly thinner than normal, and that thinner patch travels outward in the same way. The squeezed layers are called compressions and the thin ones rarefactions. In the model they are coloured orange and blue.
Because the air moves along the same line as the wave travels, sound in air is a longitudinal wave. A wave on a guitar string is different: the string moves sideways while the wave runs along it. Air cannot carry a sideways wave, because one layer of gas sliding past another barely drags it along.
The dots in the model only rock back and forth around their own spot. Watch a single dot and you will see it never goes anywhere. What moves away from the speaker is the pattern, at the speed of sound.
How far the air actually moves
The movement is very small. For a sound wave travelling in one direction, the displacement of the air ξ is linked to the pressure change p by
ξ = p / (ρ c ω)
where ρ = 1.204 kg/m³ is the density of air at 20 °C, c is the speed of sound and ω = 2πf. Take a loud 94 dB tone, which is a pressure swing of 1 pascal, at 440 Hz:
ξ = 1 / (1.204 × 343 × 2π × 440) = 0.00000088 m
That is 0.88 micrometres, about a hundredth of the width of a hair. At 1,000 Hz it is 0.39 micrometres. At the quietest sound a young ear can hear, 20 micropascals at 1,000 Hz, the air moves less than a hundredth of a nanometre, smaller than an atom. The model multiplies the movement by tens of thousands so you can see it at all.
Wavelength, worked out
The distance from one compression to the next is the wavelength, λ. It follows from two numbers: how fast the pattern travels and how often the cone pushes.
λ = c / f
In dry air the speed of sound depends on temperature: c ≈ 331.3 × √(1 + T/273.15) m/s with T in degrees Celsius. At 20 °C that gives 343.2 m/s, which this page rounds to 343 m/s. Then:
| Frequency | Wavelength (343 / f) |
|---|---|
| 20 Hz, lowest audible | 17.15 m |
| 200 Hz | 1.715 m |
| 440 Hz, the A above middle C | 0.780 m |
| 1,000 Hz | 0.343 m |
| 4,000 Hz | 8.6 cm |
| 20,000 Hz, highest audible | 1.7 cm |
Move the pitch slider and the orange bar on the ruler changes length to match. The deepest bass notes have wavelengths longer than a room, which is why bass passes through walls and around corners so easily, while high notes behave more like light and are easily blocked.
Loudness and the decibel
The pressure swings that we hear range from 20 micropascals, the threshold of hearing, to about 200 pascals, where sound becomes painful. That is a factor of ten million. A straight scale would be useless, so sound level is given in decibels, which count powers of ten:
L = 20 × log₁₀(p / p₀), with p₀ = 20 µPa
| Pressure swing (RMS) | Sound level |
|---|---|
| 20 µPa | 0 dB |
| 0.02 Pa | 60 dB, about normal conversation |
| 0.2 Pa | 80 dB |
| 1 Pa | 94 dB |
| 20 Pa | 120 dB |
The factor is 20 rather than 10 because sound energy goes with the square of pressure. Two rules follow from the formula. Doubling the pressure adds 6.02 dB. Doubling the energy, for example by running two identical machines instead of one, adds 3.01 dB. Every step of 10 dB is ten times the energy.
The loudness slider on this page is marked in dB too, but relative to the loudest signal the page will produce, so 0 dB means "full scale". The real level in your room depends on your speakers and your volume knob, which a web page cannot know. For that reason the sound starts at −10.5 dB of an already quiet maximum, and only after you press the button.
How loud is too loud
Health agencies set limits from the same scale. The World Health Organization's safe-listening advice treats 80 dB as safe for up to 40 hours a week. Because 10 dB more is ten times the energy, 90 dB is safe for only 4 hours a week, and 100 dB for 20 minutes. WHO estimates that more than 1 billion young adults are at risk of permanent, avoidable hearing loss from unsafe listening.
For noise at work, the US National Institute for Occupational Safety and Health sets its recommended limit at 85 dBA averaged over an eight-hour day. The A in dBA means the measurement is weighted the way the ear is: low frequencies, which the ear hears poorly, count for less. The National Institute on Deafness and Other Communication Disorders notes that sounds at or below 70 dBA are unlikely to cause hearing loss even after long exposure.
Environmental noise is judged by lower numbers, because the concern is sleep and stress, not damage to the ear. WHO's guidelines for Europe recommend keeping road traffic noise below 53 dB as a day-evening-night average and below 45 dB at night. In Korea, the environmental standard for the quietest residential areas is 50 dB(A) by day (06:00 to 22:00) and 40 dB(A) at night, rising to 65 and 55 dB(A) beside roads. Korea Environment Corporation's national noise information system publishes measurements against these values.
Timbre: why a flute and a violin differ on the same note
Play A at 440 Hz on a flute and on a violin, and you can tell them apart instantly. Both repeat 440 times a second, but the shape of each repeat is different. Any repeating shape can be built from sine waves at whole-number multiples of the basic frequency: 440, 880, 1,320, 1,760 Hz and so on. These are the harmonics, and the mix of their strengths is what we hear as timbre.
The harmonics slider adds partials one by one, and the overtone-strength slider sets how fast they fade, as a_n = 1/n^p. Two classic shapes are built in:
- Square wave: odd harmonics only (1, 3, 5, 7 …), each with strength 1/n. It sounds hollow, a bit like a clarinet.
- Sawtooth: every harmonic, each with strength 1/n. It sounds bright and buzzy, closer to a bowed string.
On the spectrum screen the harmonics stand in a row of evenly spaced peaks, n × f apart. For the square wave every second peak is missing. The fundamental of a square wave is actually 4/π ≈ 1.27 times taller than the square itself, because the higher harmonics trim the corners back down.
Reading the three screens
The waveform is what a microphone records: pressure at one point against time. The screen shows the last four periods of the tone, so at 440 Hz it covers 4 × 2.27 = 9.1 ms. Under it, a thin strip shows the overall loudness over the last two seconds.
The spectrum answers a different question: which frequencies are present, and how strong is each? The page computes it with a fast Fourier transform of 4,096 samples taken 48,000 times a second. That covers 4,096 ÷ 48,000 = 85 ms of sound and splits the frequency range into bins 48,000 ÷ 4,096 = 11.7 Hz wide. The vertical scale is in dB, because quiet harmonics would be invisible on a straight scale.
The spectrogram stacks spectra side by side over time, with frequency going up and darker colour for more energy. Speech, birdsong and music are easier to read this way than in either of the other views.
There is always a trade-off. To tell apart two frequencies that differ by Δf, the analysis has to look at roughly 1/Δf seconds of sound. Finer frequency detail means blurrier timing.
Beats: two notes that almost agree
Set the second-tone slider to 4 Hz. The page now plays 440 Hz and 444 Hz together. Add two sine waves and a little trigonometry gives
sin(2πf₁t) + sin(2πf₂t) = 2 cos(π(f₁ − f₂)t) × sin(π(f₁ + f₂)t)
The result is a tone at the average frequency, 442 Hz, whose loudness swells and fades. The loudness peaks whenever the cosine reaches +1 or −1, which happens |f₁ − f₂| times a second. So the beat period is
T = 1 / |f₁ − f₂| = 1 / 4 = 0.25 s
At 1 Hz apart the beat is one second long; at 10 Hz apart it is a fast flutter. Piano tuners listen for beats between strings and turn the pin until the beating slows to nothing.
The spectrum screen shows the limit described above. With 11.7 Hz bins it cannot separate 440 Hz from 444 Hz, so you see a single peak that grows and shrinks. To split them it would need bins under 4 Hz, which means at least a quarter of a second of sound, for example 16,384 samples (2.9 Hz bins, 0.34 s). The waveform's loudness strip and the spectrogram both show the swelling clearly.
The microphone on this page
Press Microphone and allow access, and the three screens switch to whatever your microphone picks up. Whistle and you will see a nearly pure sine wave with one sharp peak. Hum and you will see a row of harmonics. Say "sss" and the energy spreads into a broad smear above 4 kHz.
The microphone signal is analysed inside your browser with the Web Audio API and is never recorded, stored or sent anywhere. It is not connected to the speakers, and the tone is switched off while the microphone is on, so the speaker cannot feed back into it. The levels are shown in dBFS, relative to the loudest signal the microphone input can take, because a phone or laptop microphone is not calibrated to real sound pressure.
How fast sound travels, and why it changes
Sound is a pressure pattern handed from one bit of matter to the next, so its speed depends on two things: how hard the material pushes back when it is squeezed, and how heavy it is. In a gas both come down to temperature and molecular weight. For an ideal gas
c = √(γ R T / M)
where γ is the ratio of specific heats (1.40 for air), R = 8.314 J/(mol K), T the temperature in kelvin and M the molar mass (0.029 kg/mol for air). At 20 °C that gives 343 m/s. Pressure does not appear: if you squeeze air harder it gets stiffer and denser in the same proportion, and the two cancel. Air at the top of a mountain carries sound more slowly only because it is colder.
A handy rule is c ≈ 331.3 + 0.606 T, with T in degrees Celsius. It is within 0.25 m/s of the exact formula from −20 to 20 °C. The temperature slider on this page uses the exact formula and prints the rule next to it. At −56 °C, the temperature at the height where Chuck Yeager first flew faster than sound, the speed is only 295 m/s.
Light gases are fast. Helium has γ = 5/3 and M = 0.004 kg/mol, so sound in it travels at 1,007 m/s, 2.9 times faster than in air. Heavy gases are slow: sulfur hexafluoride, about five times denser than air, carries sound at roughly 135 m/s. Liquids and solids are much stiffer than gases, so they are faster still, even though they are also much denser. Fresh water at 20 °C carries sound at 1,482 m/s (from the formula of Lubbers and Graaff), sea water at 1,521 m/s (Mackenzie's equation at a salinity of 35 parts per thousand), steel at about 5,960 m/s and aluminium at about 6,420 m/s (Kaye and Laby's tables).
The Speed in materials scene sends the same pulse along eight lanes of equal length at once. The metal pulses arrive almost before the race starts; the sulfur hexafluoride pulse is still crawling twenty seconds later. The readout gives the time each one would need for 100 m and the acoustic impedance, ρc, which decides how much sound is reflected where two materials meet. Air and water differ by a factor of about 3,600 in impedance, which is why almost all of the sound in air bounces off a water surface.
People measured these numbers long before anyone could explain them. Pierre Gassendi in the 17th century timed the gap between a gun's flash and its bang and got about 478 m/s, too high. In the 1650s Giovanni Borelli and Vincenzo Viviani got 350 m/s. In 1738 the Academy of Sciences in Paris fired cannon over a long baseline and, corrected to 0 °C and still air, arrived at 332 m/s, within 1 % of today's value. In 1808 Jean-Baptiste Biot compared sound running through about a kilometre of iron pipe with the sound in the air inside it. In 1826 Daniel Colladon and Charles Sturm struck a bell under Lake Geneva at the same moment as they lit gunpowder above it, and timed the gap across the lake: 1,435 m/s at 8 °C. The formula above gives 1,439 m/s for fresh water at that temperature.
The decibel ladder
The Decibels scene puts fifteen sounds on one scale, using the typical levels the US Centers for Disease Control and Prevention lists: normal breathing at 10 dB, a ticking watch at 20, a soft whisper at 30, a refrigerator at 40, conversation at 60, a washing machine at 70, city traffic heard inside a car at 80 to 85, a petrol lawnmower at 90, a motorcycle at 95, an approaching subway train at 100, a rock concert at 105 to 110, a siren close by at 120 and firecrackers at 140 to 150. The last bar is not a sound you can meet: at 194 dB the pressure swing equals the air pressure itself, and the low half of the wave would need a pressure below 0. Louder blasts exist, but they are shock waves, not ordinary sound.
Two rules make the ladder easy to read. Ten decibels more is ten times the energy, so an approaching train at 100 dB carries ten billion times the energy of the faintest sound a young ear can hear. And in the open, sound from a small source spreads over a sphere, so its intensity falls with the square of the distance. Each doubling of distance costs 20 log₁₀ 2 = 6.02 dB. Move the Distance slider and the meter walks away from the source, reading 6 dB less at twice the distance and 20 dB less at ten times. Indoors the drop is smaller, because reflections from the walls keep adding sound back.
The three coloured rods behind the bars are the limits that agencies use. The WHO and ITU standard for safe listening devices counts 80 dB for 40 hours a week as an adult's allowance. NIOSH, the US occupational health institute, recommends no more than 85 dBA averaged over an 8-hour workday, and halves the time for every 3 dB more. Korea's Occupational Safety and Health Standards Rules call work above 85 dB over 8 hours noise work, and set the line for intense noise work at 90 dB for 8 hours, 95 dB for 4 hours, 100 dB for 2 hours, 105 dB for 1 hour, 110 dB for 30 minutes and 115 dB for 15 minutes: a 5 dB exchange rate. The readout prints all three for the chosen bar. These are reference values for comparing sounds, not a test of anyone's hearing.
Inside the ear
The Inside the ear scene shows the parts ten times life size, cut open. Sound first goes down the ear canal, a tube about 25 mm long closed at the far end by the eardrum. A tube closed at one end resonates when it is a quarter wavelength long, at 343 ÷ (4 × 0.025) ≈ 3.4 kHz, and that is roughly where our hearing is most sensitive.
The eardrum is a thin cone of skin about 9 mm across. Behind it, in the air-filled middle ear, three small bones (the hammer, the anvil and the stirrup) carry its motion to the oval window of the cochlea. They solve a mismatch. The cochlea is full of fluid, and sound arriving straight from air onto fluid would mostly bounce off. The middle ear works like a transformer: the effective area of the eardrum is about 17 times that of the stirrup's footplate, and the bones add a lever of about 1.3. Together that raises the pressure by roughly 22 times, about 27 dB.
The cochlea is a spiral tube of about two and a half turns. Running along it is the basilar membrane, about 35 mm long when unrolled, narrow and stiff near the oval window (the base) and wide and floppy at the far end (the apex). A tone sets up a wave that runs along the membrane, grows, and then dies away quickly past a certain place. Where it peaks depends on the frequency. Georg von Békésy saw this travelling wave in cochleas from human cadavers and received the 1961 Nobel Prize in Physiology or Medicine for it.
Donald Greenwood fitted one formula to that map of place against pitch. For people it is
f = 165.4 × (10^(2.1x) − 0.88)
where x is the distance from the apex as a fraction of the length. At x = 0 the formula gives 20 Hz, at x = 1 it gives 20.7 kHz. A 1,000 Hz tone peaks at x = 0.40, about 21 mm from the base. The scene draws the membrane unrolled and 20 times longer under the cochlea, with the frequency scale printed below it, and moves the peak as you change the pitch. High pitches crowd near the base, which is also where hearing usually starts to fade with age.
Strings, pipes and drums
An instrument is a vibrating object that prefers certain frequencies. The Instruments scene shows three kinds.
A guitar string is fixed at both ends, so it can vibrate only in patterns that fit a whole number of half wavelengths between the nut and the bridge. Those patterns have frequencies f_n = n v / 2L, where v is the speed of waves on the string and L its length. On a guitar with a 648 mm scale tuned to A at 110 Hz, v = 2 × 0.648 × 110 = 143 m/s. A real pluck excites many patterns at once. If you pull the string into a triangle at a point p along its length and let go, partial n starts with an amplitude proportional to sin(nπp) / n². Pluck at the middle (p = 0.5) and every even partial is zero, because each of them has a still point exactly there; the tone turns round and hollow. Pluck near the bridge and many high partials stay strong, so the tone is bright and twangy. The Pluck point slider shows this on the vibrating string and in the spectrum.
In a pipe it is the air that vibrates. At an open end the pressure cannot change much (it meets the room), so the air moves freely there; at a closed end the air cannot move at all. An open pipe therefore resonates at f_n = n c / 2L, every whole multiple of its lowest note, and a pipe closed at one end at f_n = (2n − 1) c / 4L, only the odd multiples, an octave lower. This is the difference between a flute, open at both ends, and a clarinet, closed by the reed: a clarinet plays lower than a flute of the same length, and when it is overblown it jumps a 12th rather than an octave. The air just outside an open end moves too, so the pipe sounds as if it were longer by about 0.61 times its radius at each open end. Levine and Schwinger worked out that end correction in 1948. The dots inside the glass pipe show how the air moves in the first three modes.
A drum skin is fixed around a circle, and its patterns are set by Bessel functions. The lowest, mode (0,1), moves as one dome. Mode (1,1) rocks across a still diameter; mode (0,2) has a still ring. Their frequencies are 1, 1.59, 2.14, 2.30, 2.65 times the lowest, not whole-number multiples, which is why a plain drum gives a less definite pitch than a string or a pipe. Timpani get around this: the air in the kettle shifts the modes so that (1,1), (2,1) and (3,1) come close to the ratios 1 : 1.5 : 2, which the ear hears as a pitch.
Building a tone from overtones
Under the screens, eight sliders build a tone from its first eight partials. Each slider is the strength of one harmonic. Choose Square and the odd sliders fall as 1/n while the even ones drop to zero; choose Triangle and the odd ones fall as 1/n², with every second one inverted, so the corners are softer. The Hollow preset leaves out even partials like a clarinet's low register, and the Organ preset stacks the octaves 1, 2, 4 and 8 like organ stops. The waveform, the spectrum, the air beam and the sound all follow the sliders, so you can hear a timbre change while its picture changes.
The Doppler effect and the sonic boom
When a source moves, each wave crest leaves from a slightly different place. Ahead of the source the crests are squeezed together; behind it they spread out. The Doppler scene draws one ring for each crest on the road, and the rings show the squeeze directly. For a source moving at speed v straight toward a listener the frequency heard is
f' = f × c / (c − v)
and straight away from the listener f' = f × c / (c + v). An ambulance at 25 m/s (90 km/h) with a 700 Hz siren is heard at 755 Hz as it approaches and 652 Hz after it passes, a drop of more than two semitones. A source has to move at c × (1 − 2^(−1/12)) ≈ 19.3 m/s, about 69 km/h, to raise its pitch by exactly one semitone as it comes toward you. The listener at the roadside hears the pitch slide between the two values as the angle changes, and the plot in the corner draws that slide.
Christian Doppler proposed the idea in 1842, for light from double stars. In 1845 Christoph Buys Ballot tested it with sound, by having trumpeters play a steady note on a moving train in the Netherlands while musicians beside the track judged the pitch.
At the speed of sound the formula breaks: the crests ahead pile up into a single shock front. Above it, the source outruns its own sound and the crests overlap along a cone whose half-angle θ obeys sin θ = c / v. At Mach 2 the cone is 30° wide on each side. Someone on the ground hears nothing until the cone sweeps over them, then hears the whole pile-up at once as a boom. On 14 October 1947 Chuck Yeager flew the Bell X-1 at Mach 1.06 at 43,000 ft, the first aircraft to pass the speed of sound. On 15 October 1997 ThrustSSC became the first car to do it, at 1,227.985 km/h. NASA's X-59, which first flew in 2025, is shaped so that the shocks reach the ground as a much quieter thump.
Echoes and reverberation
Clap in an empty stairwell and the sound hangs in the air for seconds; clap in a bedroom full of soft furniture and it stops almost at once. Each surface the sound hits absorbs part of it. The absorption coefficient α is the fraction absorbed: about 0.02 for painted plaster, 0.3 to 0.9 for curtains, carpet and seats with people in them.
Wallace Sabine worked out the rule at Harvard in the 1890s while trying to fix a lecture room where nobody could follow the speaker. The reverberation time, the time for the sound to fall by 60 dB after the source stops, is
T60 = 0.161 × V / A
where V is the volume of the room in cubic metres and A the total absorption, the sum of each surface area times its α, in square metres. Symphony Hall in Boston, opened in 1900, was the first concert hall designed with it.
The room scene builds a box from the dimensions of six rooms and fills it with bouncing particles of sound energy. Every time a particle hits a wall it shrinks by the absorption of that wall, so you can watch the room go quiet. The model classroom, 9 × 7 × 3 m with bare hard surfaces, has a reverberation time of 1.1 s; speech needs well under a second, and an average absorption of about 0.23 brings it to 0.6 s. The Grosser Saal of the Vienna Musikverein, opened in 1870, holds about 15,000 m³ and 1,680 seats; Leo Beranek gives its reverberation time as 2.0 s at mid frequencies when full, and the model reaches that with an average absorption of 0.31. Sabine's formula slightly overestimates the time in very absorbent rooms, so the readout also gives Eyring's version, T60 = 0.161 V / (−S ln(1 − α)).
The open-air theatre is the other extreme. With no roof and no walls the sound that leaves upward never comes back, and the model's reverberation time is a small fraction of a second. At Epidaurus, built in the 4th century BC, Declercq and Dekeyser showed in 2007 that the stepped rows of stone seats hold back low-frequency rustle more than the frequencies of the voice, which helps speech carry to the top rows.
Standing waves and Kundt's tube
Send a wave down a tube with a closed end and it comes back. At most frequencies the returning wave and the outgoing one fall in and out of step and nothing much happens. But when a whole number of half wavelengths fits in the tube exactly, every reflection lines up with the wave already there, and the tube rings: a standing wave. Some places, the nodes, hardly move at all; halfway between them the air swings back and forth at its widest.
In 1866 August Kundt sprinkled fine cork dust along the bottom of a glass tube and set the air inside ringing. The dust was thrown about where the air moved and settled in little heaps at the displacement nodes, half a wavelength apart. Measure the spacing d, know the frequency f, and the speed of sound follows: c = 2 d f. Fill the tube with another gas and the heaps move; that is how Kundt compared the speed of sound in different gases. The scene has a 1 m tube. At 858 Hz in air at 20 °C, five half wavelengths fit (λ/2 = 20 cm), the resonance readout reaches its peak and the dust gathers. The board above the tube shows how far the air moves (blue) and how much the pressure changes (orange): each is largest where the other is zero.
Cancelling noise with more noise
If two waves of the same frequency and size meet exactly out of step, one's crest falls on the other's trough and they add up to 0. Paul Lueg patented the idea of using this against noise in 1936: pick up the noise with a microphone and play it back through a loudspeaker with the opposite phase. In 1953 Harry Olson and Everett May at RCA built a working "electronic sound absorber" that quietened low-frequency sound in a small zone around a listener's head.
Noise-cancelling headphones do the same in a small space. A microphone on the outside of the cup hears the noise; the electronics invert it; the driver plays the result into the ear, and a second microphone inside checks what is left. The difficulty is timing. If the anti-noise is late by a time τ, its phase is off by 360° × f × τ. The scene uses a mismatch of 30 µs. At 100 Hz that is an error of only 1.1°, and more than 99.9 % of the noise power is cancelled (−34 dB); at 1 kHz it is 10.8° and the noise drops only 14 dB; at 5 kHz the error is 54° and almost nothing is gained. That is why active cancelling works best on low hums such as engines and air conditioning, while the cushions handle the high frequencies passively. Turn the phase slider away from 180° and the orange sum grows back; turn it to the value that also makes up for the delay and it almost vanishes.
What the model leaves out
- Time is slowed down. The readout gives the factor, about 1/800 at 440 Hz.
- The movement is exaggerated. The readout gives this factor too; it is usually tens of thousands.
- The wave is kept in a tube. A real speaker sends sound out in all directions, and the level drops by about 6 dB each time the distance doubles. The model shows a straight beam so the layers stay easy to see; the decibel scene shows the spreading.
- No echoes in the air beam. Real rooms add reflections from walls. The room scene adds them back, but treats every surface of a room with one average absorption and ignores the absorption of the air itself, which matters in large halls at high frequencies.
- The ear is simplified. The cut-away is ten times life size, the cochlea is a smooth tube, and the travelling wave on the membrane has a hand-drawn shape that peaks where Greenwood's formula says. Real hearing also involves active amplification by the outer hair cells, which the model leaves out.
- Instruments are ideal. The string has no stiffness, the pipe is a plain cylinder with the textbook end correction, and the drum skin is an ideal membrane without the air loading that tunes a timpani.
- The Doppler road is 1 : 40, slowed eight times, with vehicles drawn eight times larger. The rings mark one crest every fraction of a second, not every single crest.
- The noise canceller is a single tone with a fixed 30 µs mismatch. Real headphones adapt their filters continuously to noise that changes all the time.
- High harmonics are thinned out in 3D. Partials whose wavelength is shorter than three rows of dots are left out of the 3D beam, though they still appear on the screens and in the sound.
Questions
Does the air travel from the speaker to my ear?
No. Each bit of air only rocks back and forth, by less than a micrometre at ordinary levels. What travels is the pattern of compressions and rarefactions, at about 343 m/s at 20 °C.
How do I work out a wavelength?
Divide the speed of sound by the frequency: λ = 343 / f in metres. For 440 Hz that is 0.78 m; for 1,000 Hz it is 0.343 m.
Why is the decibel formula 20 log rather than 10 log?
Decibels compare energies, and sound energy goes with the square of pressure. Writing 10 log₁₀(p²/p₀²) gives the same answer as 20 log₁₀(p/p₀).
How loud is too loud?
WHO treats 80 dB as safe for up to 40 hours a week and 90 dB for only 4 hours a week. The NIOSH limit for workers is 85 dBA averaged over 8 hours.
What makes a beat, and how long is one?
Two tones with nearby frequencies drift in and out of step. The loudness swells once every 1/|f₁ − f₂| seconds, so 440 Hz and 444 Hz beat every 0.25 s.
Why can't the spectrum show 440 Hz and 444 Hz as two peaks?
Its bins are 11.7 Hz wide. Separating peaks 4 Hz apart needs at least about a quarter of a second of sound in each analysis.
Is my microphone recorded?
No. It is analysed in the browser only, nothing is stored or uploaded, and it starts only when you press the button and allow access.
Why does the sound start so quietly?
A web page cannot know how loud your speakers are set. The tone starts at a low level, and only after you press the button.
Why does helium make my voice sound high?
It does not change the pitch: the vocal folds vibrate at the same rate. Sound travels about 2.9 times faster in helium, so the resonances of the throat and mouth, which shape the vowels, move up by the same factor. The voice sounds thin and squeaky even though its fundamental is unchanged.
Why does a siren drop in pitch as it passes?
While it comes toward you its wave crests are squeezed together, and after it passes they are stretched. At 25 m/s a 700 Hz siren is heard at 755 Hz approaching and 652 Hz going away.
What is a sonic boom?
An aircraft faster than sound outruns its own pressure waves, which pile up along a cone behind it. When that cone sweeps over you, you hear all of the piled-up pressure at once as a boom.
Why does a concert hall need reverberation at all?
A completely dead room makes music sound dry and thin, because the sound stops the instant the note ends. Halls for orchestras aim for about 2 seconds, which blends successive notes; lecture rooms aim for well under a second so that syllables stay distinct.
How do noise-cancelling headphones work, and why do voices still get through?
A microphone picks up the outside noise and the headphone plays it back inverted, so the two cancel. Any small delay matters more at high frequencies, where the wavelength is short, so cancelling works best on low steady hums. Voices are mostly higher and change quickly, and the cushions block only part of them.
Why does a clarinet play lower than a flute of the same length?
A flute is open at both ends and a clarinet is closed at the reed. A closed pipe's lowest resonance has a wavelength of four times its length instead of two, so its lowest note is an octave lower, and it has mostly odd harmonics.
Terms
- Frequency: how many times per second the pressure repeats, in hertz (Hz). We hear it as pitch.
- Wavelength: the distance between two neighbouring compressions, λ = c / f.
- Compression and rarefaction: layers where the air is squeezed above, or thinned below, its normal pressure.
- Longitudinal wave: a wave in which the medium moves along the direction the wave travels.
- Decibel (dB): a logarithmic scale; sound pressure level is 20 log₁₀(p / 20 µPa).
- dBA: decibels weighted to match the ear's lower sensitivity to low and very high frequencies.
- dBFS: decibels relative to the largest signal a digital system can hold (0 dBFS).
- Harmonic: a component at a whole-number multiple of the fundamental frequency.
- Timbre: the quality that tells instruments apart on the same note, set mostly by the harmonic mix.
- Beat: the slow rise and fall in loudness when two nearby frequencies sound together.
- Spectrogram: a picture of frequency content over time.
- Speed of sound: in a gas c = √(γRT/M); about 343 m/s in air at 20 °C, 1,482 m/s in fresh water, about 5,960 m/s in steel.
- Inverse square law: in the open, intensity falls with the square of the distance, 6 dB for each doubling.
- Exchange rate: how many decibels more halve the permitted exposure time (3 dB for NIOSH, 5 dB in the Korean rule).
- Basilar membrane: the strip along the cochlea whose place of greatest motion depends on pitch.
- Ossicles: the three middle-ear bones (hammer, anvil, stirrup).
- Mode: one of the patterns in which a string, pipe or skin can vibrate on its own.
- End correction: the extra effective length of an open pipe end, about 0.61 times the radius.
- Doppler effect: the change in received frequency when the source or the listener moves.
- Mach number: speed divided by the speed of sound in the surrounding air.
- Reverberation time (T60): the time for sound in a room to fall by 60 dB after the source stops.
- Absorption coefficient: the fraction of sound energy a surface absorbs, from 0 to 1.
- Standing wave: a wave pattern that stays in place because a wave and its reflection overlap.
- Node: a place in a standing wave where the displacement stays zero.
- Active noise control: cancelling sound by adding sound of opposite phase.
Sources
- World Health Organization, Deafness and hearing loss: safe listening (questions and answers; 80 dB for 40 hours a week, 90 dB for 4 hours, example levels). https://www.who.int/news-room/questions-and-answers/item/deafness-and-hearing-loss-safe-listening (checked 16 October 2026)
- World Health Organization, Deafness and hearing loss fact sheet (over 1 billion young adults at risk). https://www.who.int/news-room/fact-sheets/detail/deafness-and-hearing-loss (checked 16 October 2026)
- WHO Regional Office for Europe, Environmental noise guidelines for the European Region (2018; road traffic 53 dB Lden, 45 dB Lnight). https://www.who.int/europe/publications/i/item/9789289053563 (checked 16 October 2026)
- CDC, National Institute for Occupational Safety and Health, About Occupational Hearing Loss (REL 85 dBA over eight hours). https://www.cdc.gov/niosh/noise/about/index.html (checked 16 October 2026)
- CDC, National Center for Environmental Health, What Causes Noise-Induced Hearing Loss. https://www.cdc.gov/hearing-loss/causes/index.html (checked 16 October 2026)
- National Institutes of Health, NIDCD, Noise-Induced Hearing Loss (70 dBA, 85 dBA). https://www.nidcd.nih.gov/health/noise-induced-hearing-loss (checked 16 October 2026)
- Korea Environment Corporation, National Noise Information System (environmental noise standards by area, day and night). https://www.noiseinfo.or.kr/ (checked 16 October 2026)
- Korea Ministry of Government Legislation, National Law Information Center, ministry interpretation on roadside areas under the Framework Act on Environmental Policy (cites the National Institute of Environmental Research noise test standard). https://www.law.go.kr/LSW/cgmExpcInfoP.do?cgmExpcDatSeq=20564&mode=2&ofiClsCd=350103 (checked 16 October 2026)
- Georgia State University, HyperPhysics, Speed of Sound in Air. http://hyperphysics.phy-astr.gsu.edu/hbase/Sound/souspe.html (checked 16 October 2026)
- Georgia State University, HyperPhysics, Beats. http://hyperphysics.phy-astr.gsu.edu/hbase/Sound/beat.html (checked 16 October 2026)
- Georgia State University, HyperPhysics, Sound Intensity. http://hyperphysics.phy-astr.gsu.edu/hbase/Sound/intens.html (checked 16 October 2026)
- UNSW Sydney, School of Physics, What is a decibel? https://newt.phys.unsw.edu.au/jw/dB.html (checked 16 October 2026)
- MDN Web Docs (Mozilla), AnalyserNode and MediaDevices: getUserMedia(). https://developer.mozilla.org/en-US/docs/Web/API/AnalyserNode and https://developer.mozilla.org/en-US/docs/Web/API/MediaDevices/getUserMedia (checked 16 October 2026)
- W3C, Web Audio API. https://www.w3.org/TR/webaudio/ (checked 16 October 2026)
- Encyclopaedia Britannica, Acoustics: Measuring the speed of sound (Gassendi, Borelli and Viviani, Paris 1738, Biot 1808, Colladon 1826). https://www.britannica.com/science/acoustics/Measuring-the-speed-of-sound (checked 19 October 2026)
- J. Lubbers and R. Graaff (1998), A simple and accurate formula for the sound velocity in water, Ultrasound in Medicine and Biology 24, 1065–1068. https://doi.org/10.1016/S0301-5629(98)00091-X (checked 19 October 2026)
- K. V. Mackenzie (1981), Nine-term equation for sound speed in the oceans, Journal of the Acoustical Society of America 70, 807–812. https://doi.org/10.1121/1.386920 (checked 19 October 2026)
- National Physical Laboratory, Kaye & Laby Tables of Physical and Chemical Constants, 2.4.1 The speed and attenuation of sound (archived). https://web.archive.org/web/2019/http://www.kayelaby.npl.co.uk/general_physics/2_4/2_4_1.html (checked 19 October 2026)
- CDC National Center for Environmental Health, What noises cause hearing loss (typical levels of everyday sounds). https://www.cdc.gov/hearing-loss/causes/index.html (checked 19 October 2026)
- Korea Ministry of Government Legislation, National Law Information Center, Occupational Safety and Health Standards Rules, Article 512 (noise work and intense noise work). https://www.law.go.kr/법령/산업안전보건기준에관한규칙 (checked 19 October 2026)
- ITU-T and WHO, H.870 Safe listening devices and systems. https://www.itu.int/rec/T-REC-H.870 (checked 19 October 2026)
- D. D. Greenwood (1990), A cochlear frequency-position function for several species, 29 years later, Journal of the Acoustical Society of America 87, 2592–2605. https://doi.org/10.1121/1.399052 (checked 19 October 2026)
- Nobel Prize Outreach, The Nobel Prize in Physiology or Medicine 1961 (Georg von Békésy). https://www.nobelprize.org/prizes/medicine/1961/summary/ (checked 19 October 2026)
- Georgia State University, HyperPhysics, The Ossicles and Place theory. http://hyperphysics.phy-astr.gsu.edu/hbase/Sound/oss.html and http://hyperphysics.phy-astr.gsu.edu/hbase/Sound/place.html (checked 19 October 2026)
- N. H. Fletcher and T. D. Rossing, The Physics of Musical Instruments, 2nd ed. (Springer, 1998). https://doi.org/10.1007/978-0-387-21603-4 (checked 19 October 2026)
- UNSW Sydney, Music Acoustics, Flutes vs clarinets, Open and closed pipes and Speech and helium speech. https://newt.phys.unsw.edu.au/jw/flutes.v.clarinets.html, https://newt.phys.unsw.edu.au/jw/pipes.html and https://newt.phys.unsw.edu.au/jw/speechmodel.html (checked 19 October 2026)
- H. Levine and J. Schwinger (1948), On the radiation of sound from an unflanged circular pipe, Physical Review 73, 383. https://doi.org/10.1103/PhysRev.73.383 (checked 19 October 2026)
- Georgia State University, HyperPhysics, Circular membrane and Doppler effect. http://hyperphysics.phy-astr.gsu.edu/hbase/Music/cirmem.html and http://hyperphysics.phy-astr.gsu.edu/hbase/Sound/dopp.html (checked 19 October 2026)
- Encyclopaedia Britannica, Doppler effect (Doppler 1842, Buys Ballot 1845). https://www.britannica.com/science/Doppler-effect (checked 19 October 2026)
- Smithsonian National Air and Space Museum, Bell X-1 Glamorous Glennis (Mach 1.06 at 13,000 m, 14 October 1947). https://airandspace.si.edu/collection-objects/bell-x-1-glamorous-glennis/nasm_A19510007000 (checked 19 October 2026)
- Guinness World Records, Fastest car (ThrustSSC). https://www.guinnessworldrecords.com/world-records/fastest-car (checked 19 October 2026)
- NASA, Quesst mission (X-59, first flight 2025). https://www.nasa.gov/mission/quesst/ (checked 19 October 2026)
- W. C. Sabine, Collected Papers on Acoustics (Harvard University Press, 1922), Internet Archive. https://archive.org/details/collectedpaperso00sabi (checked 19 October 2026)
- L. Beranek, Concert hall design: new findings, Proceedings of the Institute of Acoustics 36 (2014) (Musikverein 1,680 seats, 2.0 s occupied). https://www.arauacustica.com/files/publicaciones_relacionados/pdf_esp_543.pdf (checked 19 October 2026)
- Georgia State University, HyperPhysics, Reverberation time. http://hyperphysics.phy-astr.gsu.edu/hbase/Acoustic/revtim.html (checked 19 October 2026)
- N. F. Declercq and C. S. A. Dekeyser (2007), Acoustic diffraction effects at the Hellenistic amphitheater of Epidaurus, Journal of the Acoustical Society of America 121, 2011–2022. https://doi.org/10.1121/1.2709842 (checked 19 October 2026)
- A. Kundt (1866), Ueber eine neue Art akustischer Staubfiguren, Annalen der Physik 203, 497–523. https://doi.org/10.1002/andp.18662030402 (checked 19 October 2026)
- P. Lueg, US patent 2,043,416, Process of silencing sound oscillations (1936). https://patents.google.com/patent/US2043416A/en (checked 19 October 2026)
- H. F. Olson and E. G. May (1953), Electronic sound absorber, Journal of the Acoustical Society of America 25, 1130–1136. https://doi.org/10.1121/1.1907249 (checked 19 October 2026)
- Calculations on this page: λ = c / f with c = √(γRT/M) = 343.2 m/s in air at 20 °C; L = 20 log₁₀(p / 20 µPa); ξ = p / (ρ c ω) with ρ = 1.204 kg/m³; beat period 1/|f₁ − f₂|; FFT bin width = 48,000 / 4,096 = 11.7 Hz; Doppler f' = f c / (c ∓ v); Sabine T60 = 0.161 V / A; Greenwood f = 165.4 (10^(2.1x) − 0.88); pipes f = n c / 2L' (open) and (2n − 1) c / 4L' (closed), L' with 0.6133 r per open end; drum modes from the zeros of the Bessel functions; noise left over |1 + e^(i(φ − 2πfτ))|. All of these were also worked through by hand.
More exhibits
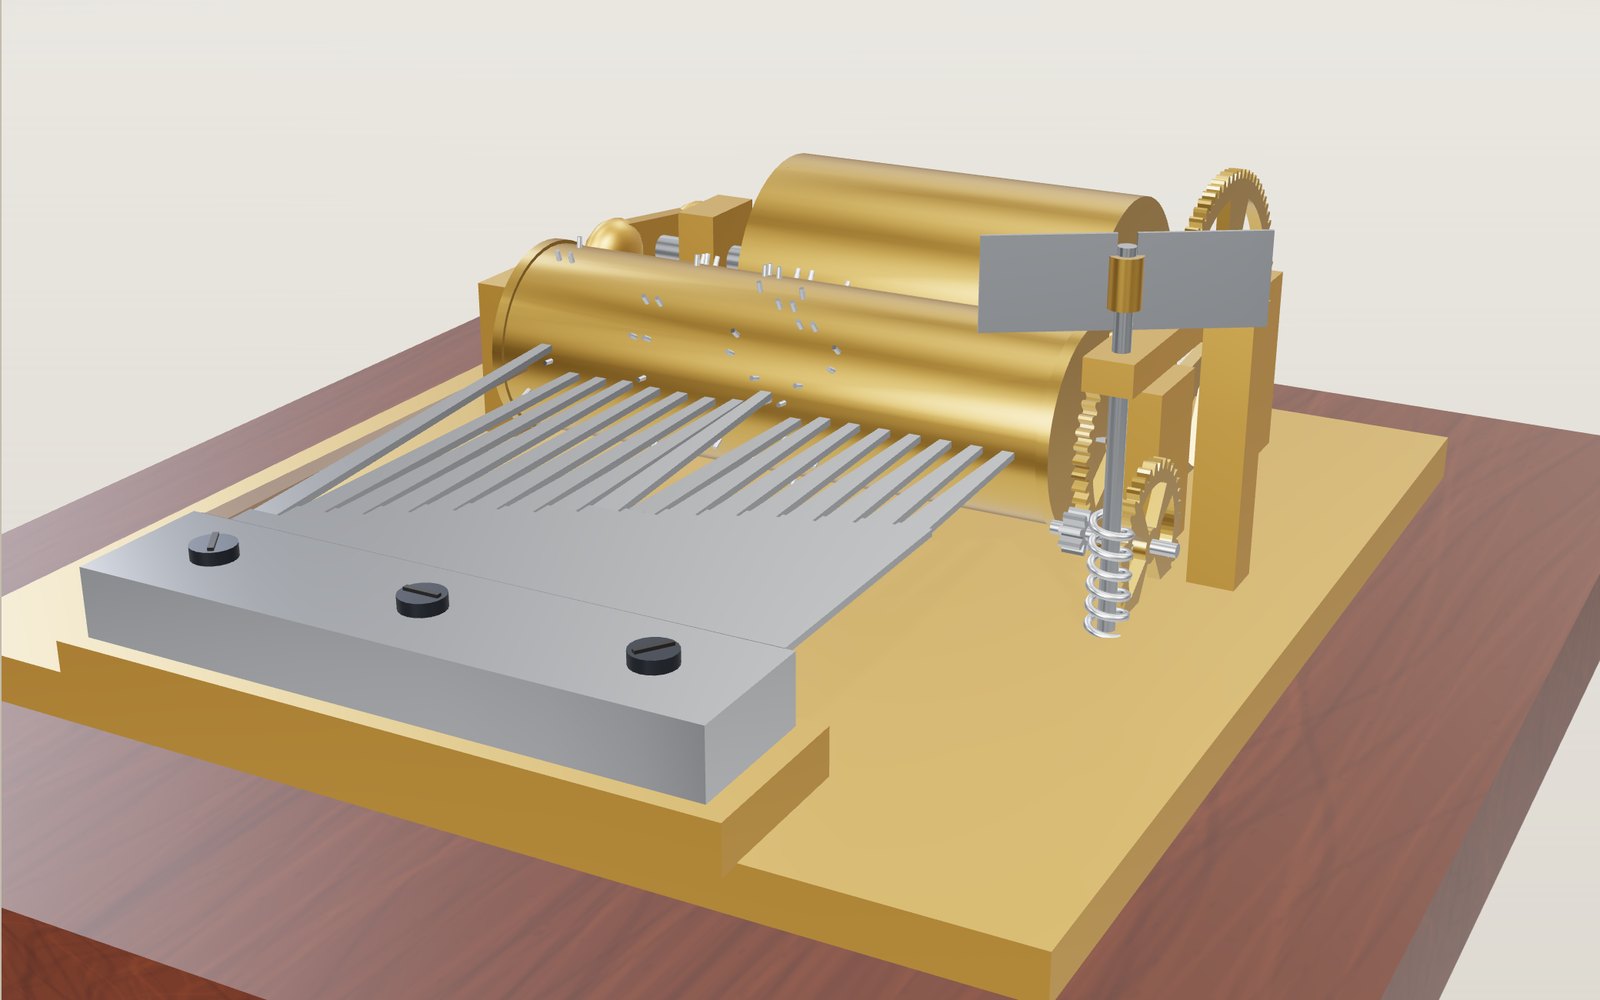
How a music box works
A steel tooth 30.6 mm long rings at 261.6 Hz, and cutting it to half that length would raise the note two octaves.
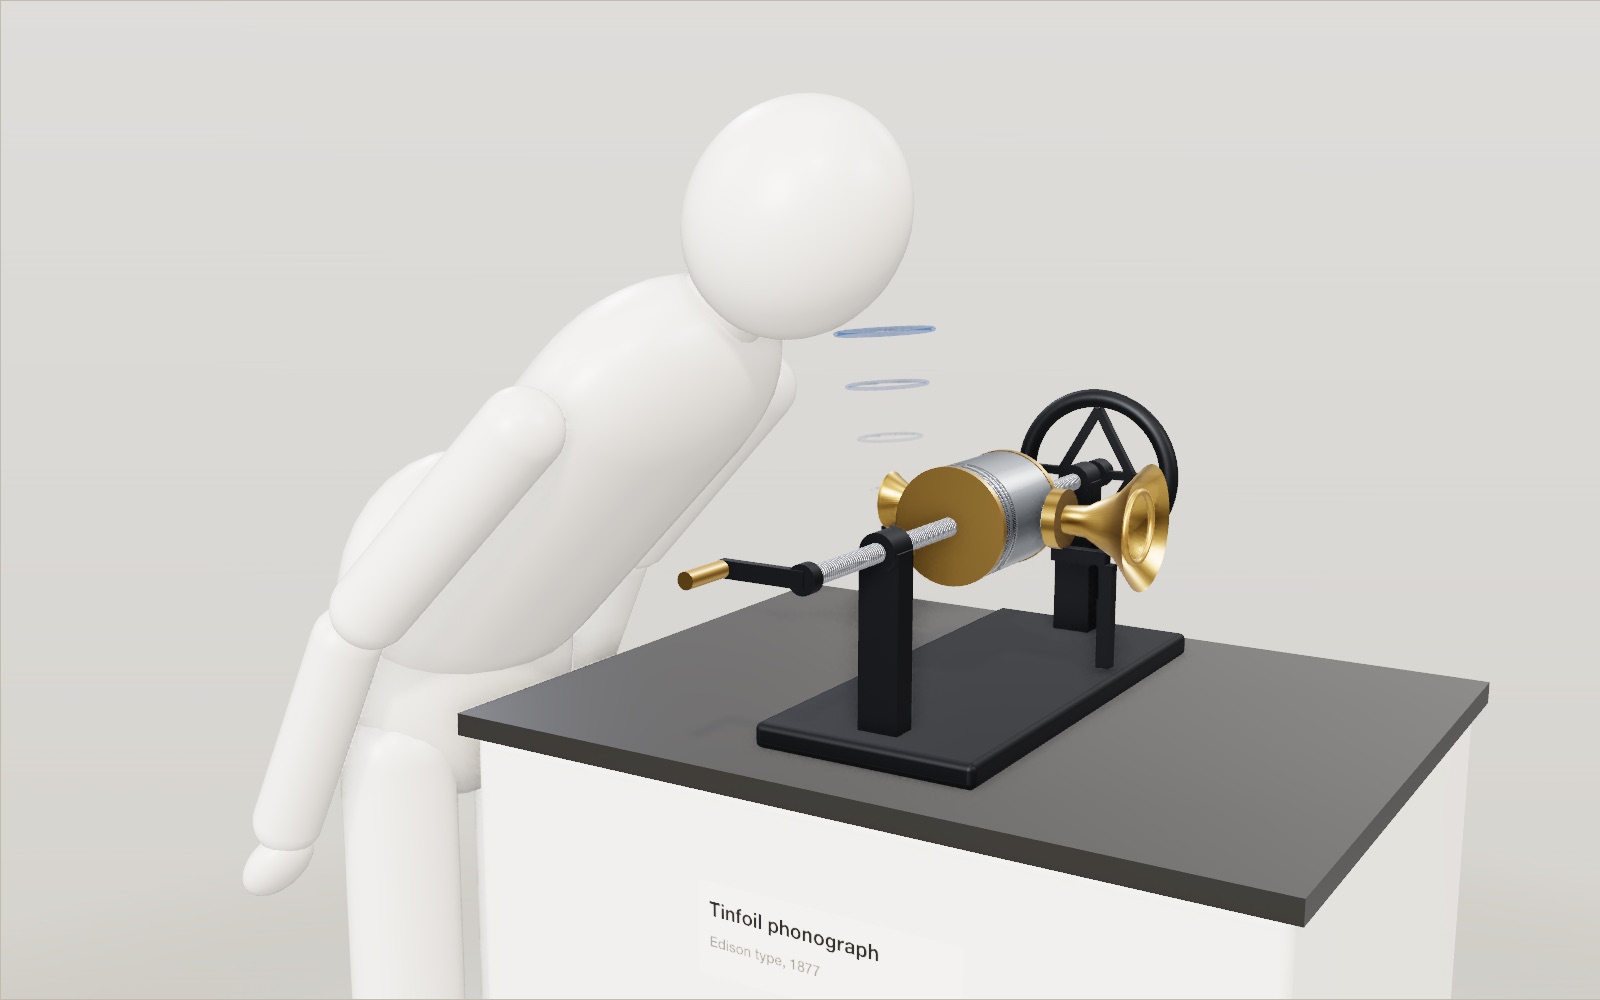
How a phonograph works: from tinfoil to cassette and CD
Edison's first phonograph cut a voice into tinfoil in 1877, and the same needle played it back from a groove 2.54 mm apart.
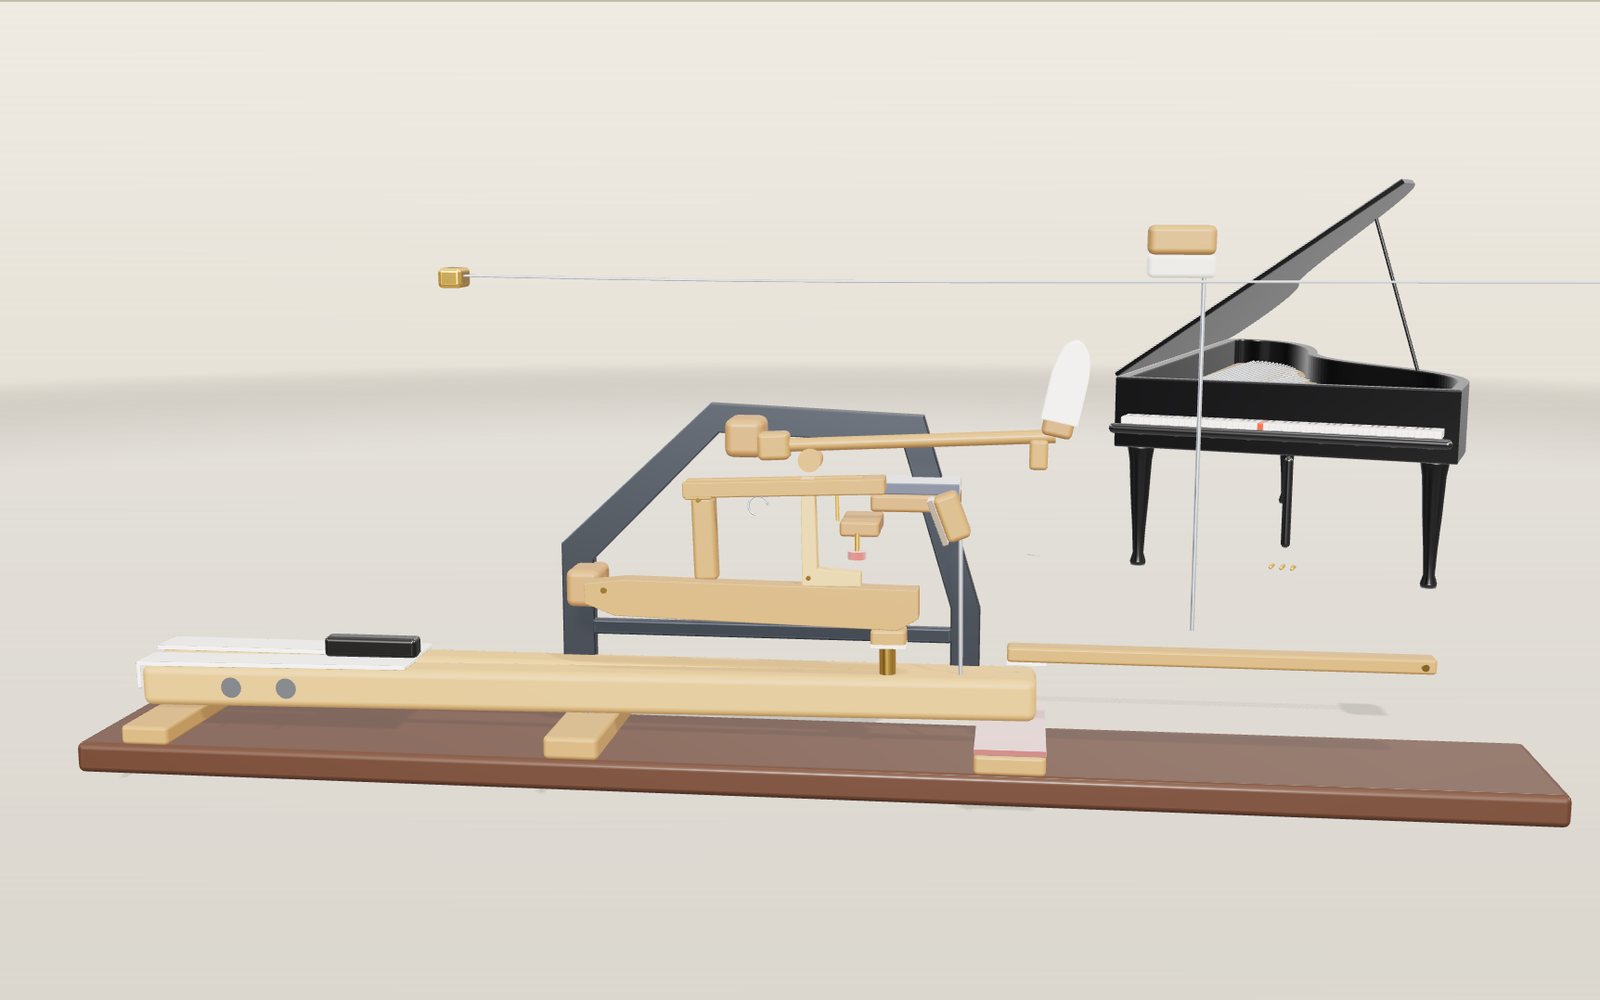
How a piano works: the grand action and equal temperament
Press a key 10 millimetres and a felt hammer flies to the string, hits it and falls away before it can stop the note.
How does a vinyl record work? Grooves, stereo and RIAA
At the outer edge of an LP the groove slides under the stylus at half a metre per second, and by the last song it has slowed to 21 centimetres.

How do bats see with sound? Echolocation explained
An echo from a moth 1 m away comes back to a bat in under 6 thousandths of a second, and that delay is how the bat knows the distance.
How lightning and thunder work
A lightning channel heats the air to about five times the temperature of the Sun’s surface, and its thunder needs about 3 seconds to cover each kilometre to you.