FIG. 65How It Works
Turbocharger: interactive model, take it apart
On this model 2.0-litre engine, a shaft spinning at 142,000 rpm squeezes almost twice as much air into each cylinder.
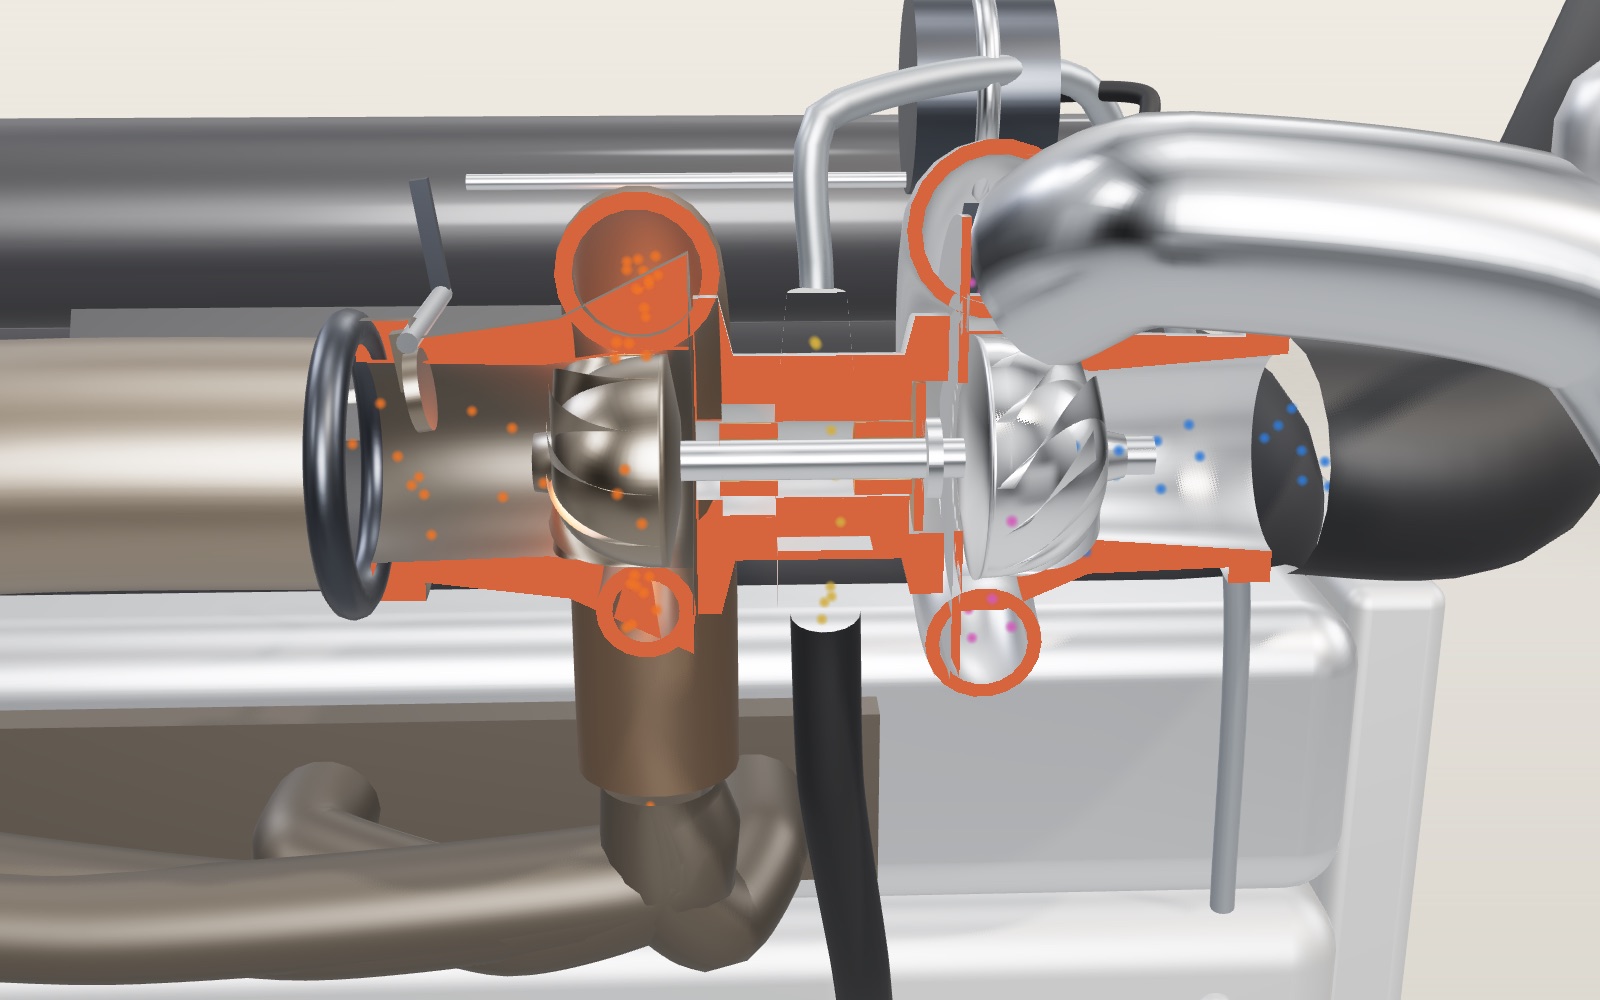
This device cannot show the 3D model. You can read the guide steps below as text.
1 / 8 A turbo on a four-cylinder engineThe turbo between the engine and the intercooler is cut along its shaft, and the red faces are where it was cut. Orange dots are exhaust; blue dots are fresh air and turn purple as they heat. The readout is worked out from the settings in Controls.
Drag to turn. Scroll or pinch to zoom.
What the model shows
Press the accelerator of a small turbocharged car at low speed and, for a second or so, not much happens. Then the car pulls as if the engine had grown. That pause and that push both come from the part in the middle of this model: a turbocharger, a small fan driven by the engine's own exhaust that blows extra air into the cylinders.
The model is a 2.0-litre four-cylinder petrol engine with one turbo, a front-mounted intercooler and the pipes that join them. The turbo is cut along its shaft, and the red faces are where it was cut. Orange dots are exhaust gas. Blue dots are fresh air, and they turn purple as the air heats up and back towards blue as it cools. Yellow dots are oil. The readout gives the speed of the turbo shaft, the boost pressure, the air temperature after the compressor and after the intercooler, the air each cylinder takes in, and the power. All of it is worked out from the settings in Controls with the formulas further down this page. The chart underneath shows the last eight seconds, so you can watch the turbo catch up when you move the throttle.
The numbers are model values for a typical small turbo petrol engine. They are not taken from any manufacturer's data, and the section near the end lists what the model leaves out.
Why an engine wants denser air
A petrol engine burns fuel with the oxygen in the air it draws in, and the fuel it can burn is limited by that air. In the four-stroke engine exhibit each cylinder fills once every two turns of the crankshaft. The volume it fills is fixed by the bore and stroke, so the only way to get more air in is to make the air denser before it arrives.
In this model each of the four cylinders sweeps half a litre and fills to 90 percent of that (its volumetric efficiency). Outside air at 25 °C and normal sea-level pressure has a density of 1.184 kg/m³, so a cylinder breathing on its own takes in
0.9 × 0.0005 m³ × 1.184 kg/m³ = 533 mg of air per intake stroke.
At 6,000 rpm that is 107 grams of air a second for the whole engine. Burned at an air-fuel ratio of 14.7 with a brake efficiency of 30 percent, the fuel that air can burn gives 94 kW. With the turbo set to one bar of boost and the intercooler working, the same cylinder gets 984 mg and the engine makes 173 kW. The engine has not grown; the air has been packed tighter.
Exhaust turns the turbine, the shaft turns the compressor
The exhaust leaving the cylinders is hot and under pressure, and in an engine without a turbo that energy goes down the tailpipe. Here the four runners of the exhaust manifold feed it into the turbine housing, a cast-iron scroll that wraps once around the turbine wheel and gets narrower as it goes. The narrowing speeds the gas up and sets it swirling, and it runs inwards through the wheel's eleven blades before leaving along the axis into the downpipe. The push of the gas on the blades turns the wheel.
On the other end of the same steel shaft is the compressor wheel, so it turns at exactly the same speed. Air from the filter enters it along the axis, and the curved blades throw it outwards at the rim. The aluminium scroll around the compressor widens as it goes, which slows that fast air and turns its speed into pressure. The same pair of ideas, a turbine taking work out of hot gas and a compressor putting it into cold air, runs a jet engine, only here there is no burner between them; the engine's cylinders do the burning.
How fast does it turn? Garrett, one of the largest makers, says its biggest turbos spin at up to 63,000 rpm and its smallest at more than 300,000 rpm. The model's compressor wheel is 50 mm across, and to give one bar of boost it has to turn at about 142,000 rpm. Its rim then moves at
2π × 0.025 m × 142,300 / 60 s = 373 m/s,
faster than the speed of sound in the outside air. On screen the wheels turn 2,000 times slower than the readout says.
A shaft that floats on oil
Most turbos carry the shaft on plain bushes and a film of oil, and some performance turbos use special ball bearings instead. In the model a braided line brings engine oil from the main gallery to the top of the centre housing. The oil fills the gap around two bronze bushes, which float between the shaft and the housing, and the shaft rides on that film without touching metal. A thrust bearing next to the compressor takes the push along the shaft. The oil then falls out of the large drain at the bottom and runs back to the sump, so the drain hose is fat and points straight down.
The oil also carries heat. The turbine side sits in exhaust gas while the compressor side breathes outside air, and the centre housing is the bridge between them. Some turbos add a coolant jacket to the centre housing for the same reason, to protect the oil from overheating.
Squeezing air makes it hot
Pump up a bicycle tyre and the pump barrel gets warm. A compressor does the same thing much faster, and the air has no time to give the heat away. For an ideal, loss-free compressor the outlet temperature is
T₂ = T₁ × PR^((γ−1)/γ),
where PR is the pressure ratio and γ is 1.4 for air. One bar of boost on top of 1.013 bar outside is a pressure ratio of 1.987. Starting from 298.15 K (25 °C):
298.15 K × 1.987^0.286 = 362.8 K, or about 90 °C.
A real compressor wastes some of its work as extra heat. The model uses an efficiency of 72 percent, which divides the temperature rise:
T₂ = 298.15 × (1 + (1.2168 − 1) / 0.72) = 387.9 K, or about 115 °C.
That is the "After compressor" line in the readout. Push the boost limit to 1.5 bar and it climbs to 148 °C. Doing that work takes power: 90 kJ for every kilogram of air, about 18 kW at 6,000 rpm, all of it taken from the exhaust by the turbine.
Cooling the charge puts the density back
Hot air is thin air. The ideal gas law ties the three together as ρ = p / (R T), with R = 287 J/(kg·K) for air. At one bar of boost the air leaving the compressor is at 201,325 Pa and 387.9 K:
ρ = 201,325 / (287.05 × 387.9) = 1.808 kg/m³.
The pressure has nearly doubled, but the density has gone up only 1.53 times, because a good part of the gain has gone into heat. Hot air entering the cylinders also brings the mixture closer to knock, where the fuel lights by itself before the spark.
The intercooler is a radiator for the intake air. The charge runs through flat tubes while the air stream at the front of the car blows past the fins between them. The model's intercooler removes 75 percent of the temperature rise:
T₃ = 387.9 − 0.75 × (387.9 − 298.15) = 320.6 K, or about 47 °C.
At the same pressure the density is now 201,325 / (287.05 × 320.6) = 2.188 kg/m³, 1.85 times the outside air. Switch the intercooler off in Controls and the power at 4,000 rpm falls from 115 kW to 95 kW without any change in boost.
Holding the boost at a limit
At high engine speed there is far more exhaust than the turbo needs. In the model, at 6,000 rpm and full throttle, the exhaust could drive the compressor to a pressure ratio of about 3, well beyond what the engine is built to take. The wastegate stops that. It is a flap inside the turbine housing that opens a passage straight to the outlet, so part of the gas skips the turbine wheel. An actuator, a sealed can with a spring and a diaphragm, pushes the flap open when the boost pressure reaches the limit. Garrett describes it this way: at a preset level the wastegate opens and lets the exhaust gas bypass the turbine.
The "Boost limit" slider moves that preset. At 4,000 rpm the flap is open about 16 percent; at 6,000 rpm it is open about half way, and the readout shows the boost staying at one bar while the engine speed rises. Set the limit to zero and the flap stays wide open; the engine then breathes like a non-turbo engine and makes about 94 kW at 6,000 rpm.
Why the power arrives late
The turbo can only spin up as fast as the exhaust can push it, and when you are cruising on light throttle there is not much exhaust. Floor the throttle and the engine first gets only the air it can draw in itself. That gives a bit more exhaust, which spins the turbo a little faster, which gives a bit more boost, and so on until it reaches the limit. The wait is called turbo lag.
The model treats the shaft speed as rising towards its target with a delay that is longer when there is less exhaust. At 2,000 rpm, going from 15 percent to full throttle, the shaft climbs from about 19,800 to 101,600 rpm; it is half way there after 0.7 seconds and at 90 percent after 2.4 seconds. At 3,500 rpm the same step takes 1.7 seconds to reach 90 percent. The last tour step runs this test, and the chart shows the red shaft-speed line and the blue boost line lagging behind the grey throttle line.
There is a second, separate effect. At low engine speed the exhaust cannot turn the turbo fast enough for full boost however long you wait. In the model full throttle at 2,000 rpm gives only 0.45 bar, and full boost arrives only above about 3,500 rpm. That is the boost threshold. Makers fight both with smaller and lighter wheels, twin-scroll housings, variable vanes in the turbine and, more recently, electric motors on the shaft.
How this model differs from a real turbo
- The turbo is drawn roughly to scale, but the housing walls, blade shapes and pipe routes are simplified.
- In the main readout the compressor efficiency, the intercooler effectiveness and the engine's volumetric efficiency are fixed numbers. In a real engine they change with flow and speed. The compressor map panel shows that change on a model map drawn for a 50 mm wheel in the shape of published maps; it is not any one maker's data.
- The exhaust side is a single formula for how much pressure the turbine could give, with the wastegate taking the rest. Pulses from each cylinder, back pressure and exhaust temperature are not modelled.
- The engine burns its fuel at a fixed air-fuel ratio of 14.7 and a fixed efficiency of 30 percent. Real turbo engines run richer at full boost and pull the spark back to avoid knock.
- Pressure losses in the filter, pipes and intercooler are left out. The blow-off valve is drawn on the stage, and its effect is worked out only in the compressor map panel: switch it off, snap the throttle shut and the operating point crosses the surge line.
From ship engines to small petrol cars
The Swiss engineer Alfred Büchi's 1905 patent is usually taken as the start of turbocharging. Brown Boveri finished its first turbocharger for large engines, the VT402, in June 1924, and the German liners Preussen and Hansestadt Danzig, launched in 1926, were the first ships with turbocharged engines, built under Büchi's supervision. Aircraft followed: from the late 1930s the Boeing B-17 flew with General Electric turbos, which kept its engines' power in the thin air at altitude. In cars, turbo lag and bulk held them back for a long time. Today a turbo is a common way to get more power out of a smaller engine, which engineers call downsizing.
Why one bar does not quite double the air
A boost gauge normally measures pressure above the surrounding atmosphere, whereas the gas law uses pressure measured from a vacuum. For a deliberately rounded example, assume the atmosphere is 1 bar absolute and the intake temperature stays unchanged. A boost of 1 bar then means 2 bar absolute. From ρ = p / (R T), doubling absolute pressure doubles density, so the same cylinder volume contains twice the air mass. It does not mean that an extra bar always doubles the air: starting at 2 bar absolute and adding another bar gives a ratio of 3 / 2 instead.
Temperature changes the result. Imagine that compression takes air from 300 K to 400 K while doubling its absolute pressure. These are illustrative assumptions, not a second set of model settings. The density ratio becomes 2 × 300 / 400 = 1.50. Cooling that charge to 330 K at the same pressure changes the ratio to 2 × 300 / 330 = 1.82. The cooler has added no pressure in this calculation. It has allowed more mass to occupy the volume already available. Kelvin must be used here; dividing temperatures expressed in Celsius would give the wrong answer because that scale does not start at absolute zero.
The exhibit uses atmospheric pressure of 1.013 bar rather than the rounded 1 bar. Consequently its 1 bar boost is a pressure ratio just below 2. Its temperature and density readings therefore differ slightly from this classroom example. A real intercooler also causes some pressure loss, and a clogged filter lowers compressor inlet pressure. Garrett's compressor-mapping guide includes both inlet and outlet losses when finding the actual compressor pressure ratio. The number on the dashboard alone cannot tell an engineer how hard the compressor is working.
There is a related misunderstanding about power. Extra oxygen permits extra fuel to burn; it does not replace the fuel. With the exhibit's fixed mixture and efficiency, a proportional rise in air mass produces a proportional rise in calculated power. A real engine controller may instead limit torque, retard ignition or change the mixture. Two engines with the same boost gauge reading can have different intake temperatures, displacement and power. Boost is useful information, but it is not a direct measurement of horsepower or of mechanical safety.
Why a larger wheel cannot simply spin faster
The earlier rim-speed calculation connects the shaft readout with a physical speed at the blade tip. For the model's 50 mm diameter wheel, 100,000 rpm gives about 262 m/s. At 250,000 rpm the same calculation gives about 654 m/s. These are geometry examples across a plausible small-turbo speed range, not approved operating points for this particular wheel. The material, blade shape and manufacturer speed limit determine whether a real wheel can survive. The exhibit's coloured particles and deliberately slowed rotation cannot show those stresses.
At a fixed radius, the acceleration needed to hold a blade element in circular motion rises with the square of angular speed. Doubling speed therefore requires four times the centripetal acceleration. Larger radius also raises the tip speed at a given rpm. This explains why a large industrial turbo can turn far more slowly than a small automotive unit without doing less useful work. The MIT lecture discusses centrifugal stress as a compressor-speed constraint; quoting a high rpm without wheel size leaves out much of the engineering problem.
A compressor map adds another constraint. Garrett plots mass flow across the horizontal axis and absolute pressure ratio vertically. Curves show shaft speed, while efficiency islands mark regions where less shaft work is wasted as heat. Towards the low-flow side, surge means an unstable operating condition rather than simply low output. At the high-flow boundary, choking and falling efficiency restrict useful operation, and pushing for more pressure can produce overspeed. A bigger compressor is not automatically better: the engine's operating points must fit its map over the required speed range.
Closing the throttle abruptly can move an operating point towards surge because the engine stops accepting much air while the wheel is still spinning. Real installations use a compressor bypass or blow-off arrangement to relieve that condition. It is separate from the exhaust wastegate. The exhibit's map panel lets you switch a blow-off valve off and watch the operating point cross the model surge line, but its map is a model, so it cannot predict surge noises or validate a turbo replacement. Its throttle test demonstrates delayed boost, not every instability that can occur in a real intake system.
Separating exhaust pulses or changing the turbine inlet
A twin-scroll turbine still has a single turbine wheel. Its housing has separate exhaust passages, and a divided manifold keeps selected cylinder groups apart before the gas reaches the wheel. That separation preserves useful exhaust pulses and reduces interference between cylinders. BorgWarner's technical description of a production six-cylinder application explains why separate passages improve low-speed response. Twin-scroll does not mean twin-turbo, and adding a divider to the housing without maintaining the matching manifold passages would not reproduce the complete arrangement.
Variable geometry tackles a different part of the problem. Movable vanes around the turbine alter the effective inlet passage. Garrett describes its diesel VGT vanes as closing at low engine speed to increase turbine power and boost, then opening at high engine speed to pass more exhaust and avoid overspeed. The wheel itself does not grow or shrink. The controller can adapt the turbine to a wider range of flow conditions than a fixed housing, although actuator complexity and the hot exhaust environment still have to be managed.
Neither design removes the need to supply energy to accelerate the rotor. Better use of exhaust pulses or a more suitable inlet can shorten response, but a weak exhaust flow still limits what is available. A smaller turbine can help the low-speed response while becoming restrictive at high flow. A larger one may reduce that restriction while being harder to accelerate. The appropriate choice depends on the engine and its duty rather than on a universal ranking of turbo designs. The type comparison in the panel lets you switch the stage between wastegate, twin-scroll, variable-geometry and electrically assisted turbos and compare their model boost and response; the starting turbine is the fixed-geometry, wastegated example described above.
When downsizing saves fuel
Downsizing means replacing a larger engine with a smaller one that uses boost when high power is required. The attraction is that much ordinary driving needs only a fraction of peak output. A smaller engine can have lower friction and, at the same road demand, operate with less throttling. The turbo then helps recover the performance that would otherwise have been lost by reducing displacement. This is a comparison between complete engine systems doing the same job, not a claim that fitting a turbo to any engine automatically saves fuel.
The EPA Automotive Trends report groups turbocharging with other engine technologies and discusses their combined effects on vehicle performance and efficiency. Such fleet data describe technology adoption and complete vehicles; they do not isolate a guaranteed fuel saving caused by the turbo alone. Vehicle mass, gearing, road load and calibration all affect the outcome. A fair comparison therefore uses equivalent vehicles on the same driving schedule. No single percentage of fuel saving can be inferred from this exhibit's power readout, which has no vehicle or driving-cycle model.
Heavy boost also brings limits. Higher intake pressure and temperature can make the unburned mixture in a petrol engine more likely to autoignite before the normal flame has consumed it. The resulting rapid pressure oscillations are knock, not the intended spark ignition. Cooling the charge helps, as can fuel with adequate knock resistance and suitable ignition timing. Compression ratio matters too, but it is a geometric cylinder-volume ratio, not the compressor pressure ratio. Those ratios describe different processes and should not be added together. The model holds efficiency and mixture fixed and does not calculate knock, so a rising power number is not permission to raise a real car's boost limit.
A belt-driven supercharger supplies compressor work from the crankshaft and can respond without waiting for an exhaust turbine to accelerate. That shaft demand still costs engine power. An electrically assisted turbo instead adds motor torque to the common turbine-compressor shaft. BorgWarner's eTurbo documentation also describes generator operation using excess turbine energy. Its separate eBooster product is an electrically driven compressor that supplements the regular turbo; it is not the same hardware as a motor on the turbo shaft. Battery energy, electrical losses and heat rejection remain part of the balance. None of these devices creates free compressed air.
Three comparisons on the screen
For a cooling comparison, hold engine speed at 4,000 rpm, use full throttle and set Boost limit to 1 bar. Wait for the shaft and boost traces to settle before recording the power. Change only the intercooler setting. The model gives approximately 115 kW with cooling and 95 kW without it. Compare the temperature entering the engine and the air per cylinder as well as the boost. This tests density at nearly unchanged pressure, not a change in engine size.
For a response comparison, set 2,000 rpm and let the system settle at 15 percent throttle. Move to full throttle and watch the last 8 s chart. The throttle trace moves first; boost follows the rotor response. Repeat at 3,500 rpm with the same starting throttle. Do not compare traces taken immediately after changing several settings, because their initial shaft speeds would differ. The exhibit's simple delay law makes this repeatable, but it is not a measured acceleration test for a production engine.
For a wastegate comparison, keep full throttle and the same boost limit while raising engine speed from 4,000 rpm to 6,000 rpm. The wastegate opening grows while the steady boost remains limited. More opening does not mean that the turbo has stopped working: exhaust still drives the wheel, but a larger share bypasses it. Finally set the boost limit to zero and compare power after the system settles. These experiments distinguish cooling, transient response and boost control without claiming that the model simulates fuel economy or knock. The compressor map and the four kinds of turbo described below are drawn models too, and their numbers are marked as such.
Reading a compressor map
Turbo makers describe a compressor with one chart, the compressor map, and the Controls tab draws one for the model's 50 mm wheel. Across the bottom is the air flowing through the compressor; up the side is the pressure ratio, the outlet pressure divided by the inlet pressure, both absolute. Garrett's catalogue explains the parts of such a chart. Lines of constant shaft speed climb the map as the turbo spins faster. Rings of equal efficiency, the efficiency islands, surround the best point, and the efficiency falls ring by ring towards the edges. The right-hand edge is the choke line, which Garrett draws where the efficiency drops below 58 percent; past it the efficiency collapses and the shaft speed nears its limit. The left-hand edge is the surge line.
Flow on a map is corrected flow: the flow the compressor would pass if its inlet air were at a fixed reference temperature and pressure, so that maps measured on different days can be compared. Garrett's reference is 545 °R (302.8 K) and 13.95 psi (96.2 kPa). The model's outside air is warmer and at higher pressure than that, so its corrected flow is 0.942 times the real flow.
The red dot is the point where the compressor is working at this moment. With one bar of boost at 6,000 rpm the engine draws 0.197 kg of air a second; corrected, that is 0.186 kg/s, or 24.5 lb/min. The pressure ratio is 1.99, and the dot sits in the middle island, where the drawn map gives 78 percent. At 1.5 bar the dot moves to 0.226 kg/s (29.9 lb/min) at a pressure ratio of 2.48, and the island under it is 76 percent. The dashed line joins the full-throttle points from 1,500 to 6,000 rpm, so you can see the whole engine's path across the map at once.
The readout keeps one fixed compressor efficiency, 0.72, so that its formulas stay simple. The map row shows what the island under the dot would mean instead. At one bar and 6,000 rpm, 0.78 instead of 0.72 brings the air leaving the compressor down from 115 °C to 108 °C. The island shapes and the surge line are drawn for this model; they are not a maker's measured map, and the map panel says so.
Surge, choke and the blow-off valve
Surge happens on the left of the map, where the pressure ratio is high but the flow is small. Garrett describes it as a region of flow instability that ranges from mild flutter to wildly changing boost, and warns that running there for long can wreck a turbo through heavy thrust loads. The easiest way to get there is to shut the throttle suddenly at full boost. The shaft is still spinning, so the compressor still pushes out the same pressure ratio, but the closed throttle lets almost no air through.
The model shows this with numbers. At 4,000 rpm and one bar the shaft turns at about 142,300 rpm, which gives a pressure ratio of 1.99. Shut the throttle to 10 percent and the engine takes only 0.029 kg/s. At that pressure ratio the drawn surge line is at 0.059 kg/s, so the point jumps far to its left. On screen the dot shakes, the surge warning comes up and a red ring pulses at the compressor inlet.
A blow-off valve, or a bypass valve, is the usual cure. Garrett describes both: a blow-off valve vents the trapped charge to the air, and a recirculating bypass valve returns it to the compressor inlet. Either way the flow through the compressor can ramp down smoothly instead of stopping. The model's valve sits on the charge pipe with a hose back to the inlet; with it switched on, the pressure ratio falls together with the flow and the dot never crosses the surge line.
Choke is the opposite edge. There the compressor is asked for more air than its wheel can pass. The efficiency drops quickly, the outlet air gets hotter for the same boost, and the shaft speed climbs towards its limit. Garrett's advice is short: if your operating point is past choke, you need a larger compressor. Garrett gives 185,000 rpm as the highest allowed speed of its G25-550, for example, and the model's 50 mm wheel needs about 166,400 rpm for 1.5 bar.
Thin air and the pressure ratio
The pressure ratio counts from the air the compressor breathes, not from sea level. Garrett works through an example: 12 psi of boost on a gauge at sea level, where the air is at 14.7 psi absolute, is a pressure ratio of (12 + 14.7) / 14.7 = 1.82. A filter and intake that pull the inlet down by 1 psi raise that to 1.95. In Denver, where the air is about 12.4 psi, the same gauge reading needs (12 + 12.4) / (12.4 − 1) = 2.14.
The map's altitude buttons use NASA's model of the lower atmosphere, in which temperature falls by about 6.5 °C per kilometre and the pressure follows from it. At 1,524 m, Denver's height, the model gives 5.2 °C and 84.4 kPa; at 3,000 m it gives −4.4 °C and 70.2 kPa. Keeping the 201 kPa manifold pressure of one bar at 6,000 rpm then needs a pressure ratio of 2.39 at 1,524 m and 2.87 at 3,000 m, and the corrected flow rises as well. On the map the whole dashed line slides up and to the right, towards higher shaft speeds and the choke line. The readout itself stays at sea level; only the map shows the altitude.
Four ways to drive the turbine
The engine in this exhibit uses the simplest arrangement: one scroll and a wastegate flap. Real engines often use one of three others, and the Controls tab can switch between all four on the same engine and compressor.
A twin-scroll turbine splits the scroll in two with a wall, so the exhaust pulses of cylinders that fire one after another reach the wheel separately instead of disturbing each other. BorgWarner describes its twin-scroll turbochargers as giving both power and quicker response. In 3D the divider appears as a wall through both cut sections of the scroll.
A variable geometry turbine, or VGT, has a ring of guide vanes around the turbine wheel. Garrett describes how it works: at low engine speeds the vanes close, which restricts the exhaust flow, raises the turbine's power and raises the boost; at high speeds they open, which lets the flow through and keeps the turbo from over-speeding. Garrett says its variable geometry turbos have been matched to more than 70 million diesel engines in the last three decades. In the model the vanes also do the wastegate's job, so the flap and its actuator disappear when you pick this kind. Porsche says the 997 generation 911 Turbo of 2006 was the first petrol production car with it, and Volkswagen says its 1.5 TSI evo put it into a high-volume petrol engine for the first time, with absolute charge pressures up to 2.3 bar.
An electric turbo puts a motor on the shaft between the two wheels. Mercedes-AMG calls its M139l engine the first series-production engine with an electric exhaust gas turbocharger: a 1.6-inch thin motor on the shaft spins the turbo up before the exhaust can, at speeds up to 175,000 rpm. Garrett, which builds electric turbos as well, puts the reason simply: with a motor on the shaft the turbine no longer has to be small enough to drive the compressor at low flow, so it can be sized for full power. Among its E-Turbo results Garrett lists four times the torque gradient at 1,500 rpm.
The model changes two things for each kind: how much extra drive the turbine gets when the exhaust flow is small, and how fast the shaft winds up. At 2,000 rpm and full throttle the wastegated turbo reaches 0.45 bar, twin scroll 0.53 bar, the VGT 0.83 bar and the electric turbo the full one bar. After flooring the throttle from 15 percent, the boost reaches 90 percent of its final value in 2.16 s, 1.75 s, 1.48 s and 0.40 s. These are model parameters chosen to show the direction of each change. They are not test results for any engine.
Charge cooling in numbers
The cooling lab uses the same formulas as the readout and lets you change the outside air, the boost and how well the intercooler works. At 1.5 bar on a 25 °C day the air leaves the compressor at 148 °C. An intercooler that removes 75 percent of the rise brings it to 56 °C; 80 percent brings it to 50 °C and 85 percent to 43 °C. In power at 6,000 rpm that is 210 kW, 214 kW and 218 kW, against 164 kW for the same boost with no intercooler and 94 kW with no turbo at all. At one bar the intercooler lets 21 percent more air into each cylinder.
Porsche fitted the first charge-air cooler to a production car in the 911 Turbo 3.3 of 1978, under the rear spoiler; Porsche writes that lowering the charge temperature was vital to reach 221 kW at 5,500 rpm.
Choosing a turbo by its air flow
A turbo is chosen by the air the engine needs, not by the size of the engine alone. Garrett's rule of thumb is that a turbocharged petrol engine makes 10 to 11 horsepower at the flywheel for every lb/min of air, so a 400 hp target needs 36 to 40 lb/min. Garrett also says the horsepower figures in its catalogue are worked out from the choke flow of each compressor map. Turned around, that gives a rough choke flow for any turbo in the catalogue: its top horsepower divided by 10.5. The catalogue panel marks this value as an estimate.
The model engine needs 24.5 lb/min at 6,000 rpm and one bar, and 29.9 lb/min at 1.5 bar. A turbo is a sensible match when that peak sits well inside its range, at about 60 to 85 percent of the choke flow. At 1.5 bar the GTX2860R Gen II, rated by Garrett at 200 to 475 hp, has an estimated choke flow of 45.2 lb/min, and the engine's peak uses 66 percent of it. Its compressor wheel measures 46 mm at the inlet and 60 mm at the outlet; the model's is 50 mm at the outlet. The model makes 282 hp from 29.9 lb/min, 9.4 hp per lb/min, a little under Garrett's rule because the model's brake efficiency is a modest 0.30.
The 911 Turbo over 50 years
Porsche's own history of the 911 Turbo reads like a summary of this page. The first 911 Turbo, the 930 of 1974, made 191 kW from 3.0 litres with a single boost-controlled turbo. The 3.3-litre version of 1978 added the intercooler and made 221 kW. The 964 of 1992 grew to 3.6 litres and 265 kW so that boost built sooner. The 993 of 1995 replaced one large turbo with two smaller ones to cut lag and made 300 kW. The 996 of 1999 was the first water-cooled one, at 309 kW. The 997 of 2006 brought variable turbine geometry and 353 kW, the 991 of 2013 made 383 kW, and the 992 of 2020 makes 427 kW. Over those generations the power more than doubled, and each step used one of the ideas in this exhibit.
Where the catalogue numbers come from
The catalogue holds 61 entries. Of these, 50 are Garrett turbochargers from its Performance Catalog, Volume 9 of 2023: the G, GTX, GT, GBC and GTW families. For each one it gives Garrett's horsepower range, the engine sizes Garrett suggests, and the inlet and outlet diameters of the compressor and turbine wheels, exactly as printed; where Garrett lists two wheel options for one frame, both appear. The other eleven are turbocharged engines from their makers' own pages: eight generations of the Porsche 911 Turbo, two Volkswagen TSI evo engines and the Mercedes-AMG M139l. Power is given in the unit each maker uses. The only computed values are the estimated choke flow (horsepower divided by 10.5) and the share of it the model engine would use. Opening an engine sets the model to its kind of turbo, and the two early 911s set the intercooler as they were built.
Questions
How does a turbocharger make more power?
It packs more air into each cylinder. More air lets the engine burn more fuel on each stroke. In the model one bar of boost with the intercooler working raises the air per cylinder from 533 mg to 984 mg.
Is the turbo powered by the engine's crankshaft?
No. The turbine is turned by the exhaust gas, and the compressor sits on the same shaft. A supercharger is the version driven from the crankshaft by a belt or gears.
How fast does a turbocharger spin?
Garrett gives a range from up to 63,000 rpm for its largest turbos to more than 300,000 rpm for its smallest. The model's 50 mm compressor needs about 142,000 rpm for one bar of boost and 166,000 rpm for 1.5 bar.
Why does compressed air get hot?
The compressor does work on the air, and with no time to lose heat that work raises its temperature. From 25 °C, one bar of boost gives about 90 °C in an ideal compressor and about 115 °C in the model's 72 percent efficient one.
What does an intercooler do?
It cools the air between the compressor and the engine. Cooler air at the same pressure is denser, so more of it fits into each cylinder, and it also lowers the risk of knock. In the model it brings the air from 115 °C to 47 °C and the density from 1.53 to 1.85 times the outside air.
What is a wastegate for?
It limits the boost. When the pressure reaches the set limit, the wastegate opens a path that lets some of the exhaust bypass the turbine, so the shaft stops speeding up.
What is turbo lag?
The delay between opening the throttle and the boost arriving, because the exhaust needs time to spin the turbo up. It is different from the boost threshold, the engine speed below which the turbo cannot make full boost at all.
Does one bar of boost always double engine power?
No. It approximately doubles absolute intake pressure near sea level, but heating reduces the density gain. Power also depends on fuel delivery, engine efficiency and control limits.
Is twin-scroll the same as twin-turbo?
No. Twin-scroll separates exhaust passages feeding a single turbine wheel. Twin-turbo means two turbochargers.
Is an electric compressor the same as an electric turbo?
No. An electric compressor can be a separate unit in the intake. An electrically assisted turbo adds a motor to the turbine-compressor shaft and may also recover electrical energy.
Can the model predict fuel savings or safe tuning limits?
No. It has no driving cycle or knock calculation, and its compressor map is a shape drawn for the model wheel, not a measured map. Its power and lag outputs explain the stated simplified model, not the safe operating limits of a real engine.
What is compressor surge?
Surge is unstable flow in the compressor when the pressure ratio is high but the flow is small, for example when the throttle shuts at full boost. Flow stalls and reverses in pulses. A blow-off or bypass valve prevents it by letting the trapped air out or back to the inlet.
Why does a turbo work harder at altitude?
The compressor starts from thinner air, so it needs a higher pressure ratio to give the engine the same manifold pressure. Garrett's example: 12 psi of boost is a pressure ratio of 1.82 at sea level but 2.14 in Denver.
What is a variable geometry turbo?
A turbo with a ring of movable guide vanes around the turbine wheel. Garrett describes the vanes closing at low engine speeds, which raises turbine power and boost, and opening at high speeds, which keeps the turbo from over-speeding.
Terms
- Boost: intake pressure above the outside air pressure, given here in bar.
- Pressure ratio (PR): compressor outlet pressure divided by inlet pressure.
- Compressor efficiency: the ideal (loss-free) work divided by the work the compressor really does.
- Intercooler effectiveness: the share of the compression temperature rise the intercooler removes.
- Volumetric efficiency: the air a cylinder takes in as a share of what its swept volume would hold at intake conditions.
- Wastegate: a valve that lets exhaust bypass the turbine to limit boost.
- Turbo lag: the delay before boost builds after the throttle opens.
- Boost threshold: the engine speed below which the turbo cannot reach full boost.
- Centre housing: the body between the turbine and compressor that holds the bearings and oil passages.
- Compressor map: a chart of pressure ratio against corrected flow with speed lines, efficiency islands and the surge and choke limits.
- Corrected flow: air flow scaled to a fixed reference inlet temperature and pressure, so that maps can be compared.
- Surge: unstable, pulsing flow at high pressure ratio and low flow, on the left edge of the map.
- Choke: the right edge of the map, where the compressor cannot pass more air efficiently.
- Variable geometry turbine (VGT): a turbine with movable guide vanes that change how the exhaust reaches the wheel.
Sources
NASA Glenn Research Center, Isentropic Compression or Expansion (T₂/T₁ = (p₂/p₁)^((γ−1)/γ)). https://www.grc.nasa.gov/www/k-12/airplane/compexp.html
NASA Glenn Research Center, Equation of State (ideal gas law). https://www.grc.nasa.gov/www/k-12/airplane/eqstat.html
NASA Glenn Research Center, Gas Properties. https://www.grc.nasa.gov/www/k-12/airplane/gasprop.html
NASA Glenn Research Center, Otto Cycle (four-stroke petrol cycle). https://www.grc.nasa.gov/www/k-12/airplane/otto.html
Garrett Motion, Types of turbo in service replacement (shaft speeds from 63,000 to over 300,000 rpm, wastegate). https://www.garrettmotion.com/knowledge-center-category/turbo-replacement/types-of-turbo-in-service-replacement/
Wai Cheng, Internal Combustion Engines, Lecture 20: Turbocharging, MIT OpenCourseWare 2.61, 2017 (turbocharger parts with oil inlet and return, wastegate, turbo lag, intercooler, volumetric efficiency in the power equation, compressor speeds limited by centrifugal stress, downsizing). https://ocw.mit.edu/courses/2-61-internal-combustion-engines-spring-2017/resources/mit2_61s17_lec20/
Accelleron (successor to Brown, Boveri & Cie), 100 Years of Industrial Turbocharging, 2024 (Büchi's 1905 German patent; BBC's VT402 of June 1924; the liners Preussen and Hansestadt Danzig, launched 1926, the first ships with turbocharged engines). https://accelleron.com/charge-magazine/100-years-of-industrial-turbocharging
The Museum of Flight, A Short History of the B-17 (General Electric turbosuperchargers for power at altitude). https://blog.museumofflight.org/a-short-history-of-the-b17
Calculations on this page: model values (2.0 L, four cylinders, volumetric efficiency 0.9, air-fuel ratio 14.7, brake efficiency 0.30, compressor efficiency 0.72, intercooler effectiveness 0.75, compressor wheel 50 mm, outside air 25 °C and 1.013 bar). Pages checked 16 October 2026.
Garrett Motion, Performance Catalog Volume 9, 2023 (how to read a compressor map: choke below 58 percent efficiency, surge, 10 to 11 hp per lb/min, pressure ratio examples 1.82 and 2.14; horsepower, engine size and wheel diameters of the G, GTX, GT, GBC and GTW turbochargers). https://www.garrettmotion.com/wp-content/uploads/2023/03/Garrett_Performance_Catalog_Volume_9_2023_3_22.pdf
Garrett Motion, G-Series G25-550 (maximum allowable speed 185,000 rpm; horsepower worked out from the choke flow). https://www.garrettmotion.com/racing-and-performance/performance-catalog/turbo/g-series-g25-550
Garrett Motion, E-Turbo (an electrified turbo no longer needs a small turbine to drive the compressor at low flow; four times the torque gradient at 1,500 rpm in its demonstrators). https://www.garrettmotion.com/emission-reduction/garrett-e-turbo/
Porsche Newsroom, The 911 Turbo generations (930 to 992: power, the 1978 charge-air cooler, twin turbos in 1995, variable turbine geometry in 2006). https://newsroom.porsche.com/en/press-kits/50-years-porsche-turbo/The-911-Turbo-generations.html
Volkswagen Newsroom, The compact all-rounder: TSI evo engine with a capacity of 1.0 and 1.5 litres, 2020 (variable turbine geometry in high-volume petrol engines, absolute charge pressure up to 2.3 and 2.8 bar, 289,000 rpm). https://www.volkswagen-newsroom.com/en/press-releases/the-compact-all-rounder-tsi-evo-engine-with-a-capacity-of-10-and-15-litres-6695
Mercedes-Benz USA, 2024 Mercedes-AMG C 63 S E PERFORMANCE press information (M139l, first series-production engine with an electric exhaust gas turbocharger, 1.6-inch motor, up to 175,000 rpm, 469 hp at 6,750 rpm). https://media.mbusa.com/storage/media/api/1/releases/2f4468bf3e26c13ea97feb134903da22-2024-amg-c-63-s-e-performance-press-release-rev.pdf
NASA Glenn Research Center, Earth Atmosphere Model (temperature and pressure in the troposphere). https://www.grc.nasa.gov/www/k-12/airplane/atmosmet.html
Compressor map, surge line, efficiency islands and the four turbo kinds on this page: model values for the 50 mm model wheel, drawn to show the shape and direction of each effect. Pages checked 27 October 2026.
Additional technical references
- Garrett Motion, Turbo Tech 103: Expert Compressor Mapping. https://www.garrettmotion.com/wp-content/uploads/2019/10/GAM_Turbo-Tech-103_Expert-1.pdf
- BorgWarner, Electric Boosting Technologies. https://www.borgwarner.com/technologies/electric-boosting-technologies
- BorgWarner, eTurbo for Passenger Cars. https://www.borgwarner.com/docs/default-source/default-document-library/eturbo-for-passenger-cars-product-sheet.pdf?sfvrsn=93bccf3c_19
- Garrett Motion, Variable Geometry Turbos for Diesel (vanes close at low speed, open at high speed; more than 70 million diesel engines in three decades). https://www.garrettmotion.com/turbocharger-technology/diesel-turbochargers/variable-geometry-turbos-for-diesel-engines/
- US EPA, The 2025 Automotive Trends Report, 2026, Chapter 4. https://www.epa.gov/system/files/documents/2026-02/420r26001.pdf
- BorgWarner, First Mass-market eTurbo Application, 2020. https://www.borgwarner.com/newsroom/press-releases/2020/01/23/borgwarner-secures-business-win-for-its-first-mass-market-eturbo-application
- BorgWarner, Twin Scroll Turbocharger Delivers Power and Response, 2020. https://www.borgwarner.com/newsroom/press-releases/2020/02/18/borgwarner-s-twin-scroll-turbocharger-delivers-power-and-response-for-premium-manufacturers
More exhibits
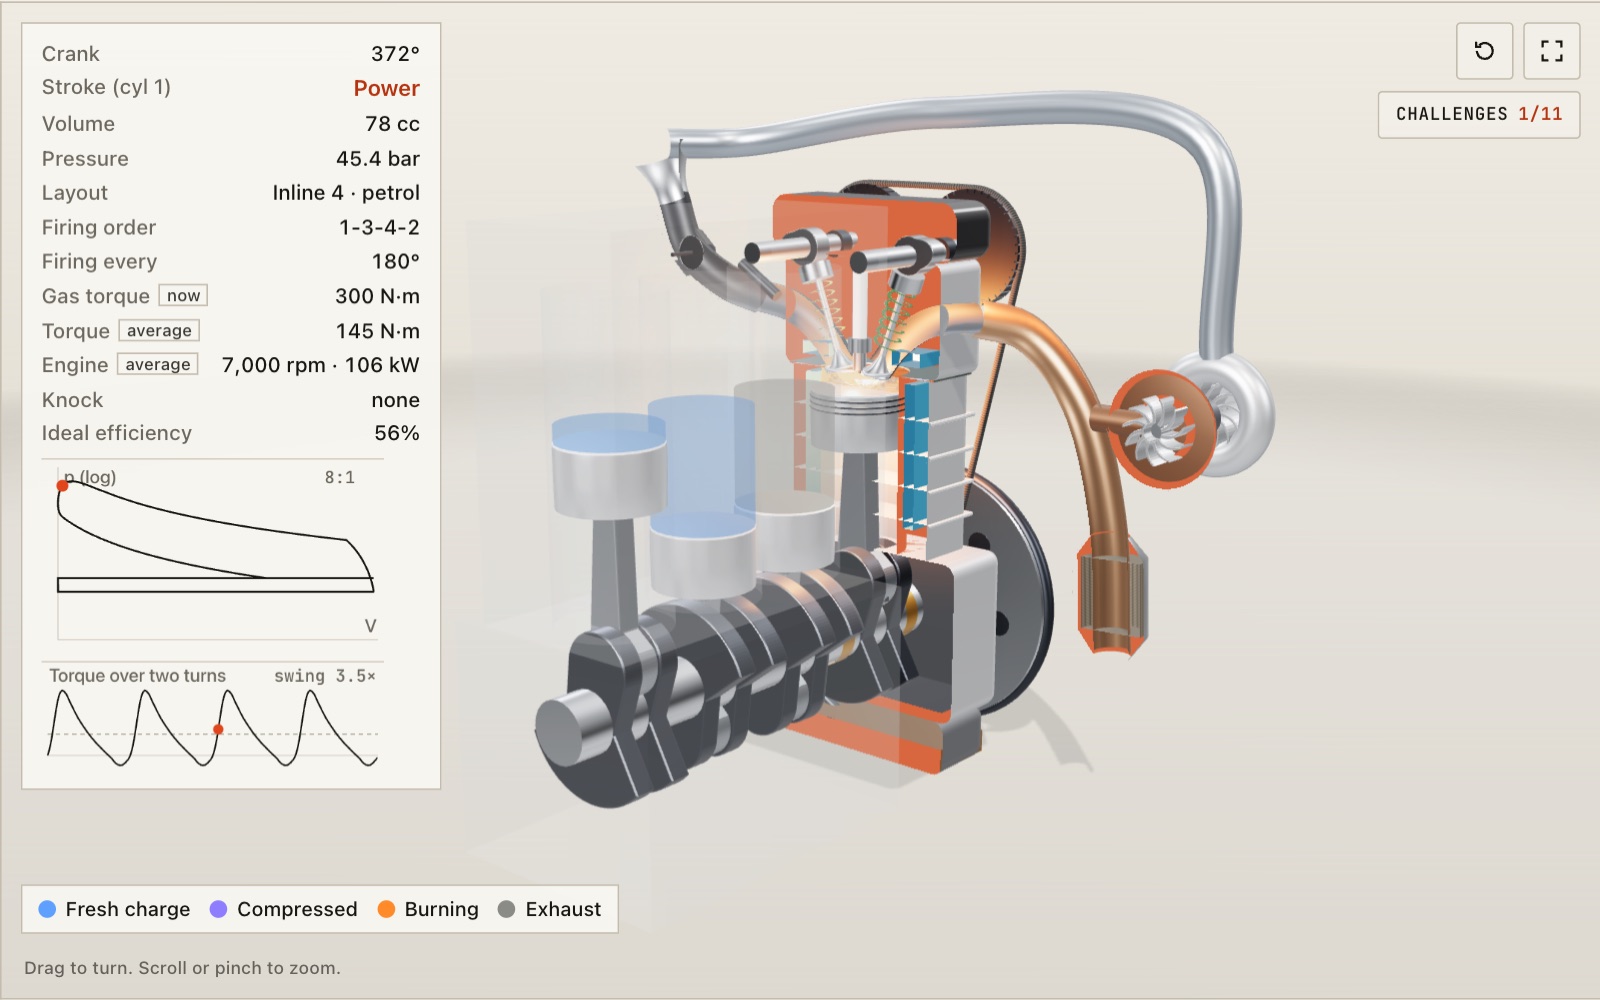
How a four-stroke engine works: two crank turns per cycle
At 3,000 rpm each cylinder fires 25 times a second. Here the engine turns slowly enough to follow every stroke, laid out as anything from a single to a V8 with its own firing order.
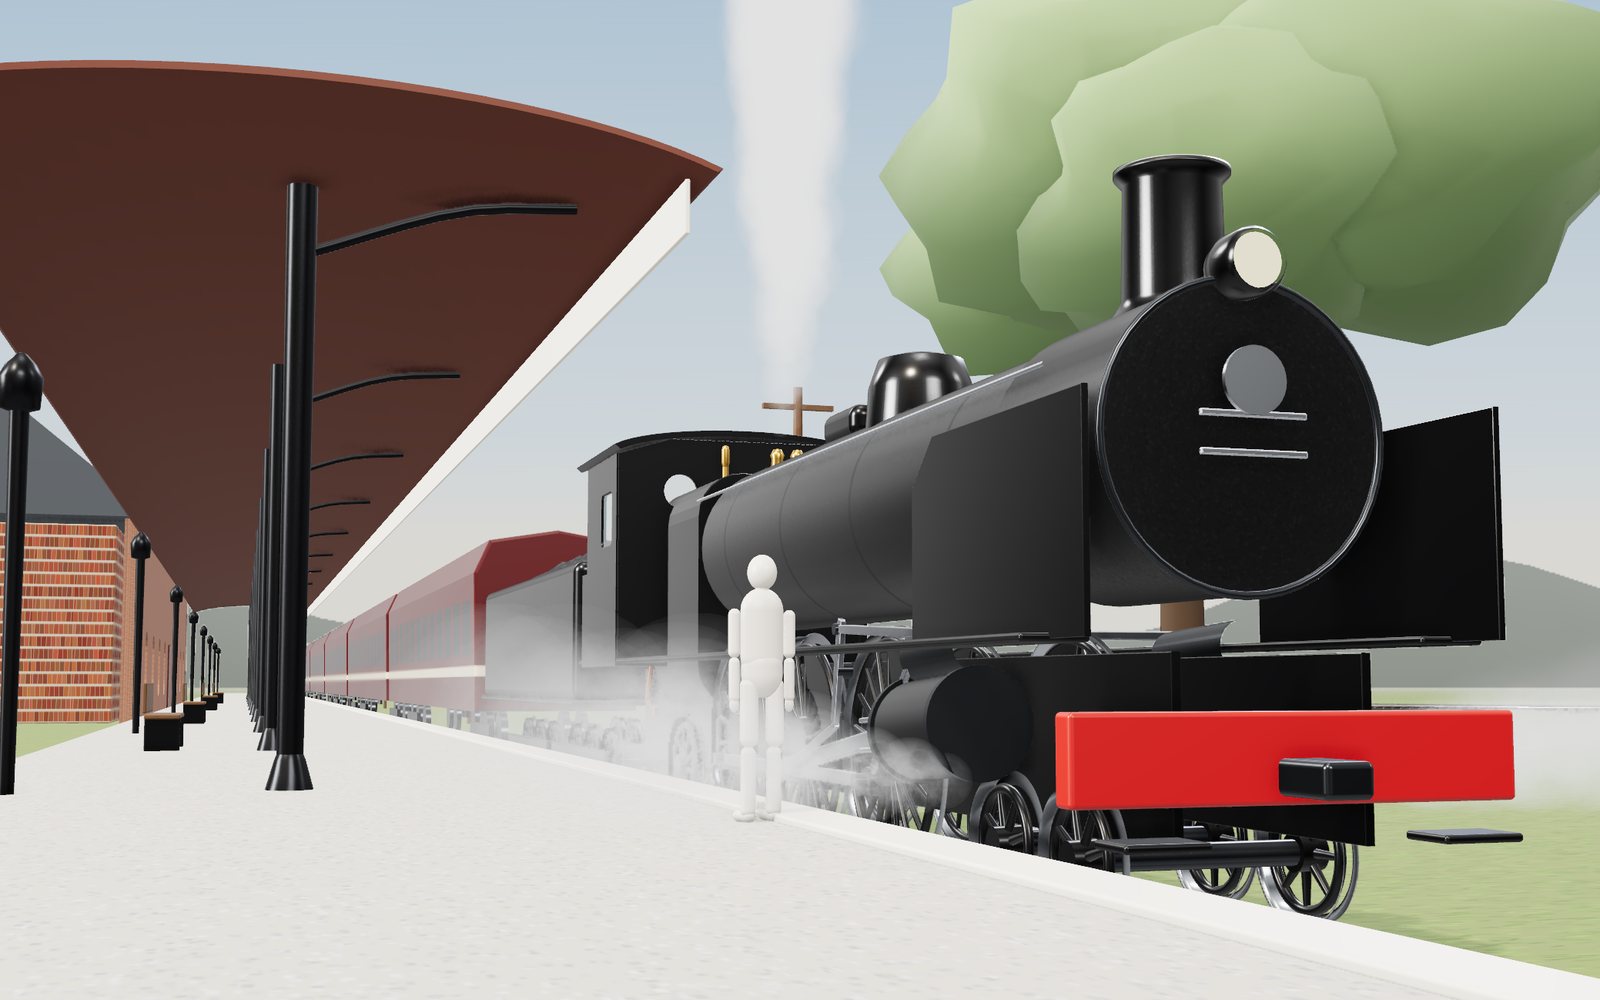
How a steam locomotive works
Mallard's driving wheels are 2.03 m across, taller than most people, and at its record 126 mph they turned almost nine times a second.
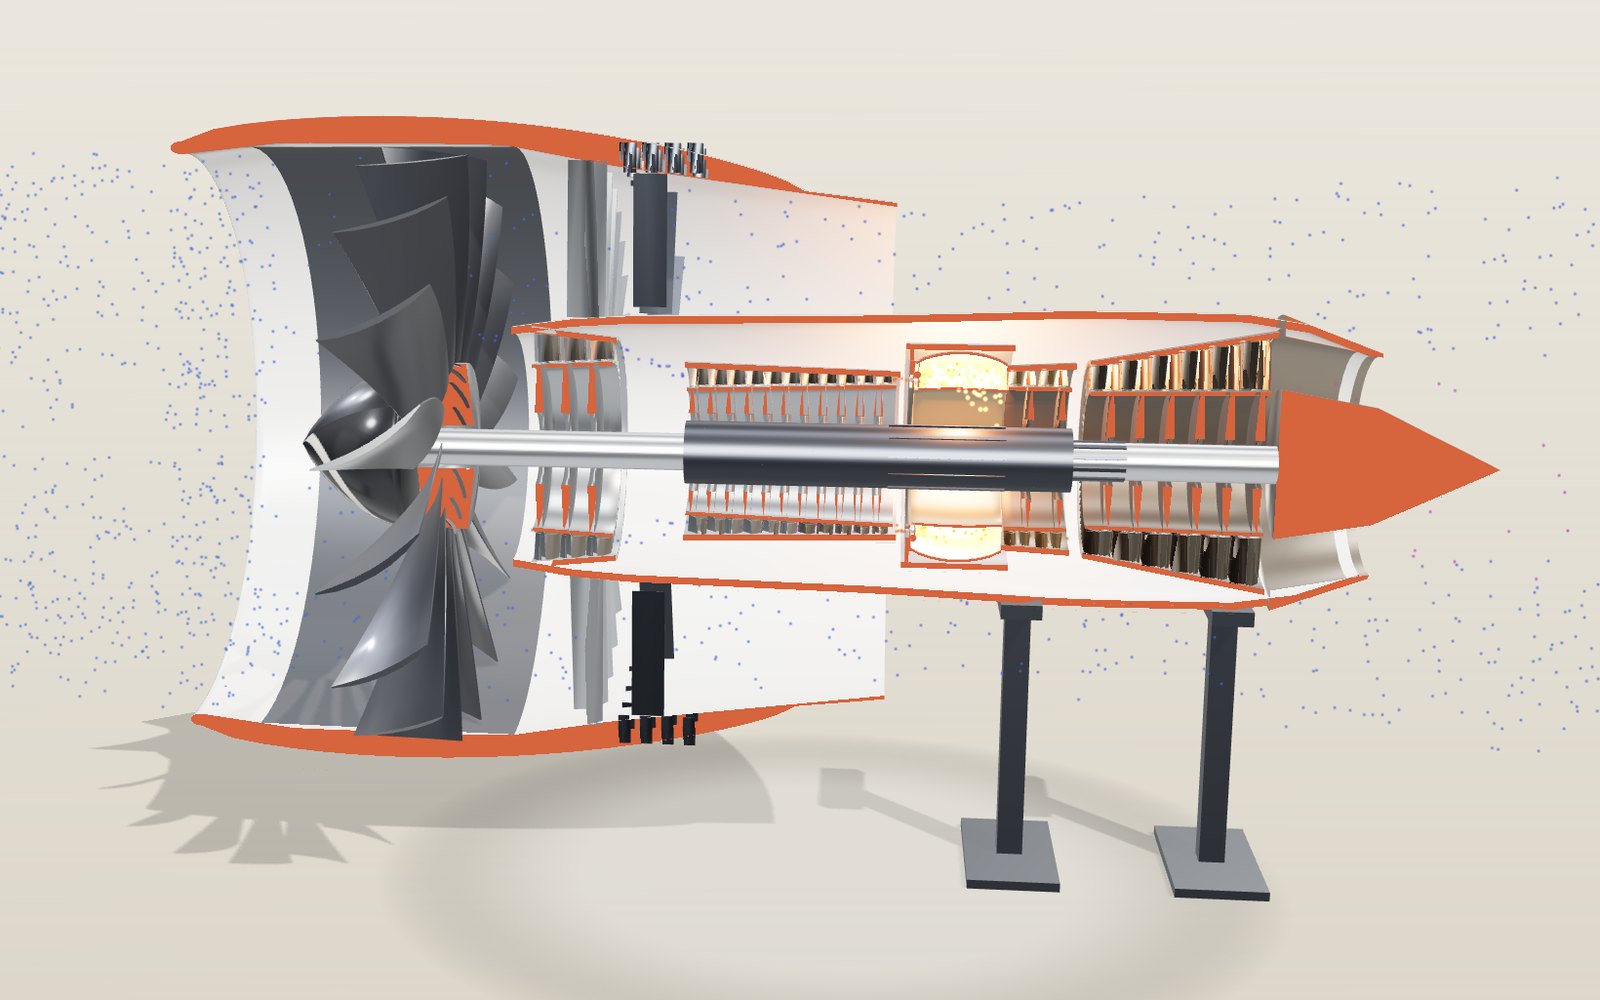
How a jet engine works: where an airliner’s thrust comes from
In an airliner's turbofan only one kilogram of air in eleven passes through the flame. Six other kinds of jet engine split the work differently, and you can open each one here.
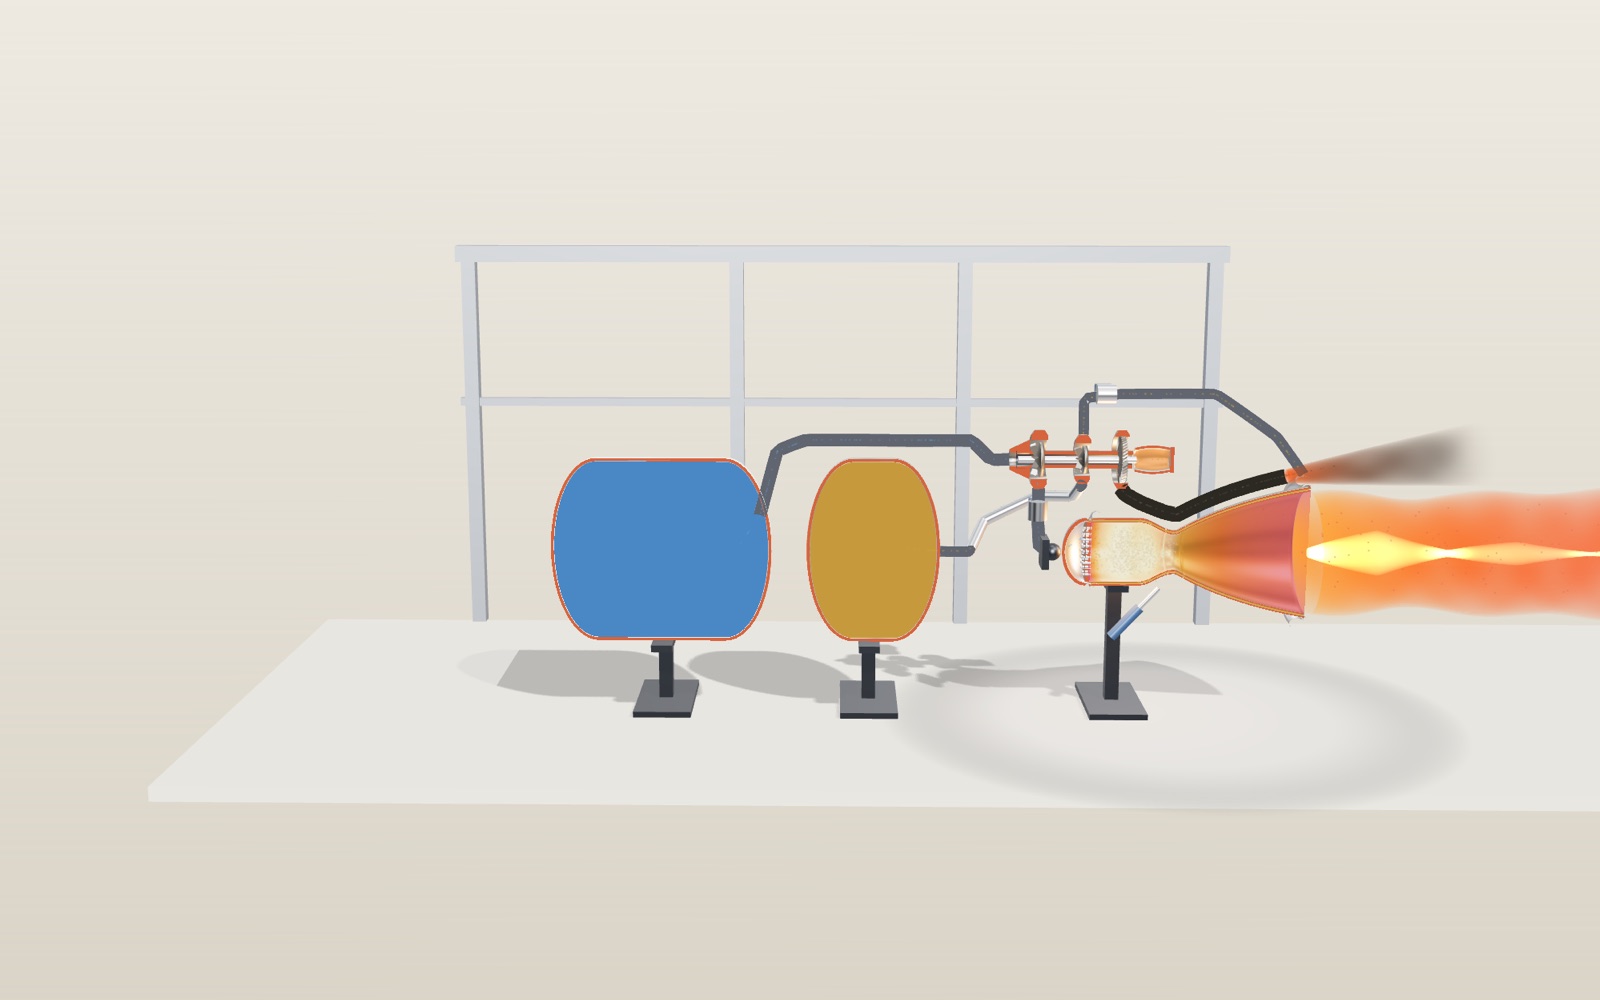
Liquid rocket engine: interactive model, how it works
Nuri's 75-tonne engine burns 255 kg of kerosene and liquid oxygen every second, and the same engine pushes about 13 percent harder in space than at sea level.
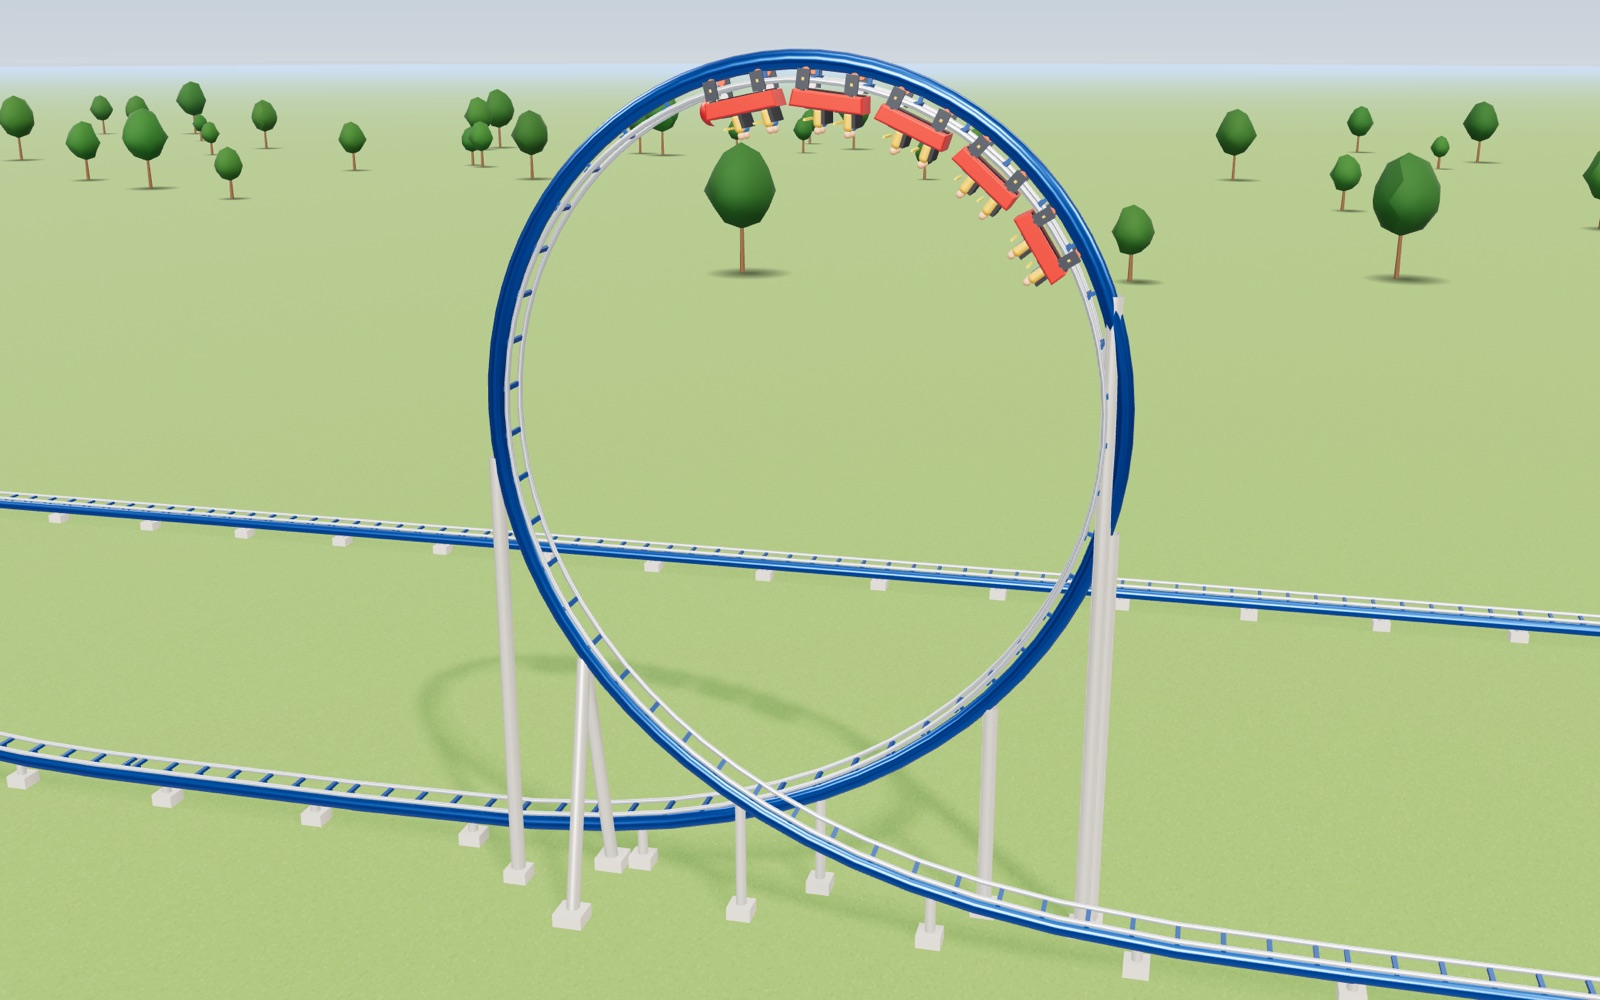
Roller coaster physics: how roller coasters work
A train that creeps over a 42 m lift hill at 3 m/s is doing 99 km/h at the bottom, and nothing but gravity has pushed it.
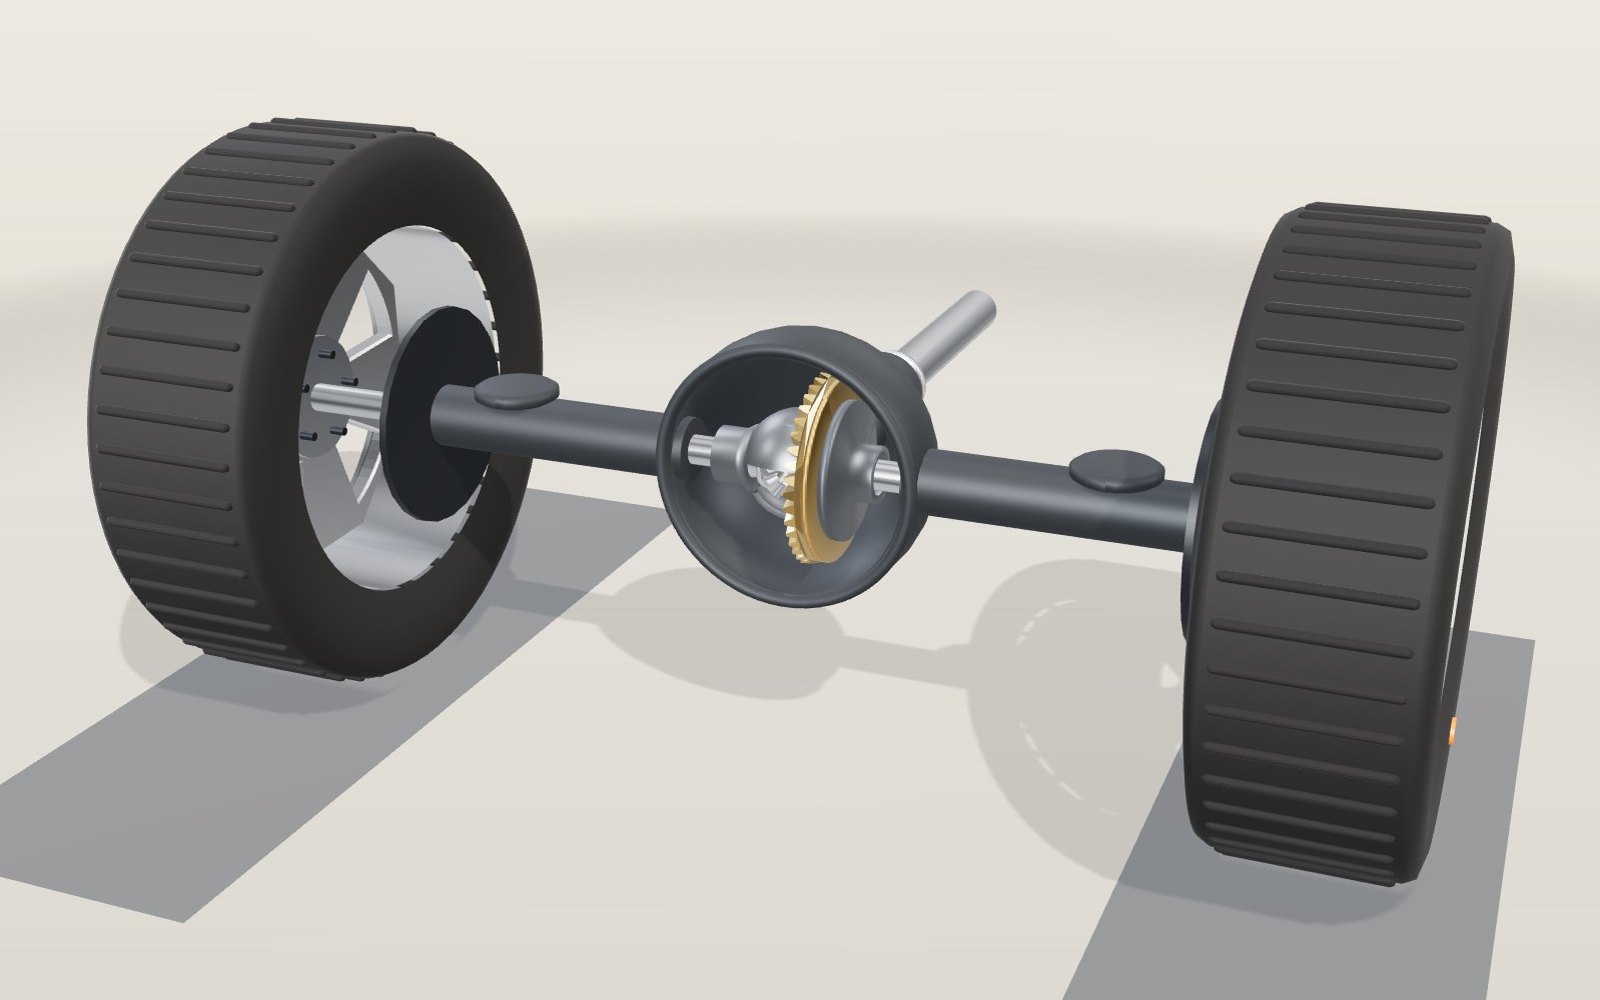
How does a differential work in a car? A 3D gear model
Round a 10 m bend at 50 km/h and the outer rear wheel turns 17% faster than the inner one, yet both are driven from the same shaft.