FIG. 10How It Works
How a wing makes lift, and what changes as the angle grows
Air over the top of a wing reaches the trailing edge first. It does not wait for the air underneath.
This device cannot show the 3D model. You can read the guide steps below as text.
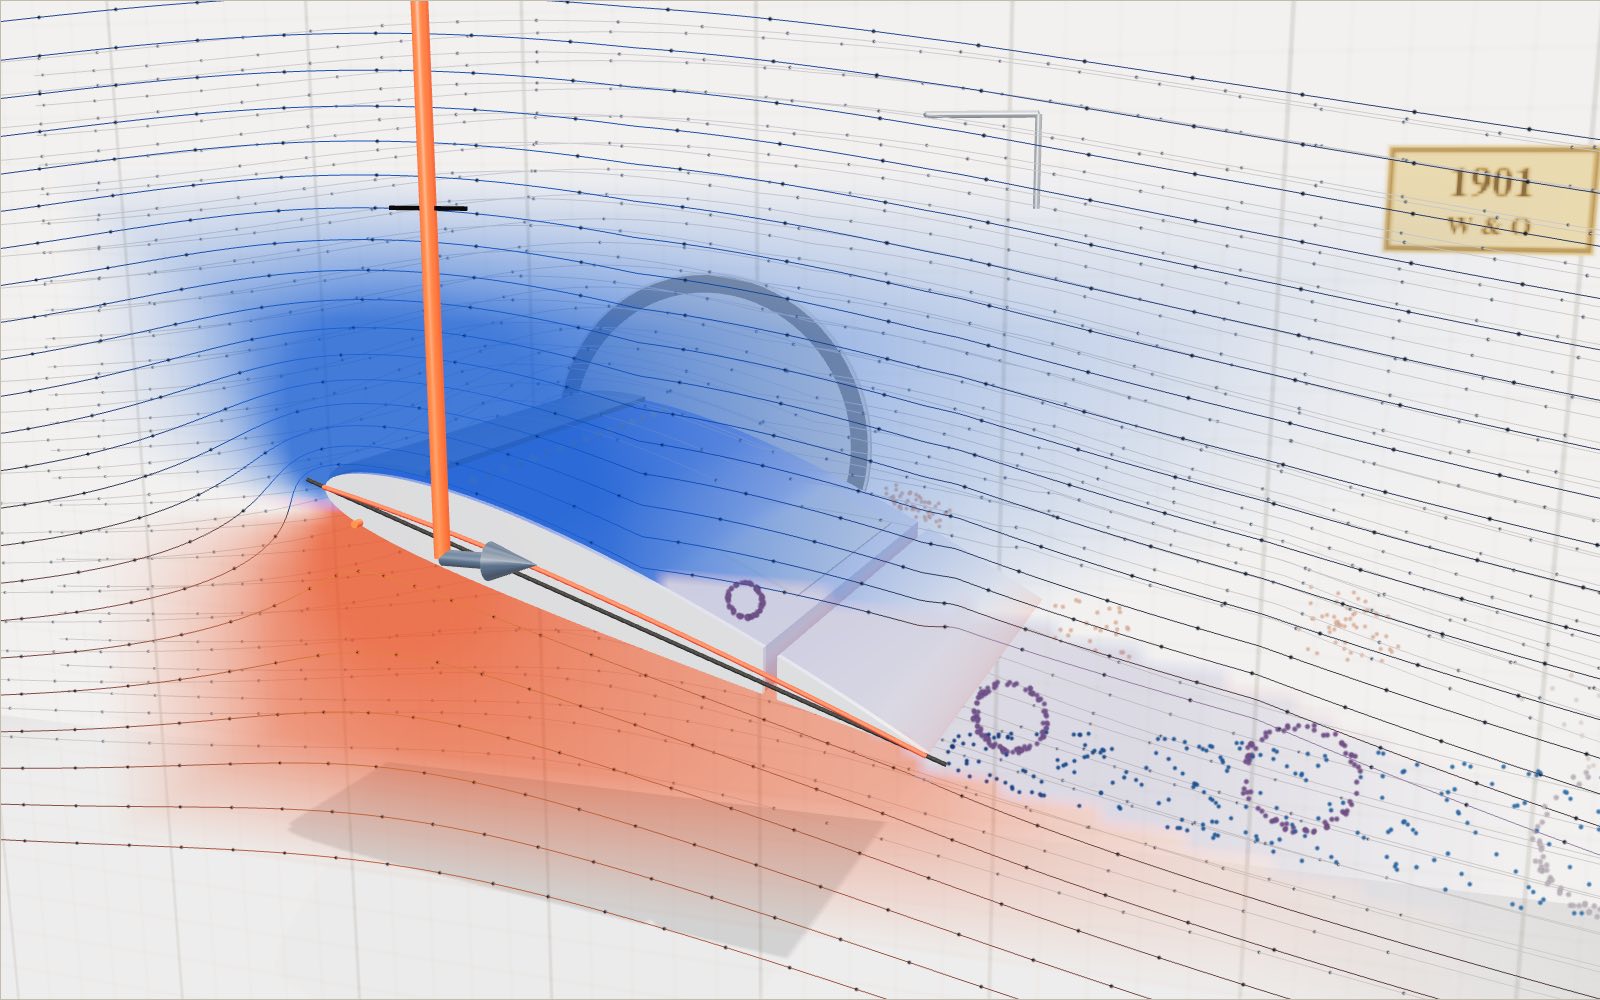
1 / 11 A wing in a wind tunnelThis is a slice of a light-aircraft wing with air blowing past it from the left. The dots ride along the streamlines, and the colours on the skin show the pressure.
Drag to turn. Scroll or pinch to zoom.
What the model shows
An airplane wing produces lift by changing the air’s motion and the pressure around its surface. Increasing the angle of attack raises lift over the normal range, but too large an angle causes separation and stall. The wing’s upper and lower air streams do not have to meet at the trailing edge.
A light aircraft weighing more than a tonne leaves the runway at around 100 km/h, held up by two thin aluminium wings. This exhibit puts a slice of such a wing in a wind tunnel so you can see what the air is doing around it, and how much force that adds up to.
The section on the stage is a NACA 2412, the airfoil family used on the Cessna 172. The streamlines, the moving dots and the colours on the skin all come from a calculation that runs in your browser each time you change the angle of attack or the flap. The numbers in the corner apply the same angle and airspeed to a whole aircraft: a 1,111 kg Cessna 172R with 16.2 m² of wing and an 11.0 m span.
Blue on the skin means the pressure is lower than the undisturbed air around the wing, and red means it is higher. The red arrow is lift, the grey arrow is drag, and the black tick above the wing marks the aircraft's weight. When the tip of the red arrow reaches the tick, the wing is holding the aircraft up.
A wing shape you can write down
In 1933 the US National Advisory Committee for Aeronautics (NACA) published wind tunnel tests of 78 related airfoils in Report 460. The whole family is built from two simple formulas. Each section is named by four digits. In 2412 the first digit is the maximum camber, 2% of the chord. The second digit puts that maximum 40% of the way back from the nose. The last two digits are the thickness, 12% of the chord.
The camber line is two parabolas joined at x = p, with x measured along the chord from 0 at the nose to 1 at the tail:
- for x < p: y_c = (m / p²)(2px − x²)
- for x ≥ p: y_c = (m / (1 − p)²)((1 − 2p) + 2px − x²)
with m = 0.02 and p = 0.4. The thickness is then wrapped around that line:
y_t = 5t (0.2969√x − 0.1260x − 0.3516x² + 0.2843x³ − 0.1036x⁴), with t = 0.12.
Report 460 uses −0.1015 for the last coefficient, which leaves a trailing edge of finite thickness. The model uses −0.1036 so the top and bottom meet in a sharp point, which the flow calculation needs. The upper and lower surfaces are found by stepping out from the camber line by y_t at right angles to it. The points are spaced more closely near the nose and tail, where the surface curves most.
Why the air does not meet up again
The most widely repeated explanation of lift says that the top of a wing is longer than the bottom, so air going over the top must travel faster to meet the air from underneath at the trailing edge at the same moment. Faster air has lower pressure, and so the wing is pushed up.
NASA's Glenn Research Center lists this "equal transit time" theory as one of the most common incorrect explanations of lift. Its pages point out two problems. Nothing in physics requires the two parcels of air to meet again. And the speed that the theory predicts is far too low to produce the lift that wings actually make. In reality the air over the top moves much faster than equal transit would need, and it reaches the trailing edge first.
You can check this on the model. Turn on "Time markers": the orange lines join dots that set off from the left at the same instant. As they pass the wing, the line bends forward over the top and stays behind underneath. At 3.5° angle of attack, two parcels that start 0.02 chord apart on either side of the line that divides the flow arrive at the trailing edge 0.24 chord-lengths of travel time apart. When the upper one reaches the trailing edge, the lower one is still only about 80% of the way along. At 180 km/h on a 1.47 m chord, that gap is 0.24 × 1.47 m ÷ 50 m/s = 7 milliseconds. The two parcels never come back together.
The numbers show why equal transit cannot be the explanation. On this section the upper surface is only 1.4% longer than the lower one (1.028 against 1.014 chord lengths). If the air over the top went just 1.4% faster, the pressure difference would be about (1.014² − 1) = 0.029 of the dynamic pressure, which gives a lift coefficient near 0.03. The flow calculation gives 0.99 at 6°, more than 30 times as much, with air on the upper surface reaching 1.9 times the free-stream speed. The Wright brothers' wings, as NASA notes, were thin curved plates with the same length on top and bottom, and they lifted perfectly well.
What really makes the lift
A wing at an angle to the airflow, or a curved one, turns the air that passes it downwards. Watch the streamlines behind the trailing edge: they leave the wing pointing slightly down. NASA puts it directly: lift occurs when a flow of gas is turned by a solid object.
There are two equivalent ways of adding this up. You can add the pressure over the whole surface, which is what the colours on the skin show: lower pressure on top and higher pressure underneath. Or you can add up the change in the air's momentum as it is turned, which is Newton's third law. Both give the same force. NASA's page on the "Bernoulli or Newton" argument says that both camps are correct, and that the arguments come from misapplying one of them.
Notice where the flow divides. At 6° the air meets the nose at the orange stagnation line, slightly underneath. Air just above that line has to run forward around the nose before heading back over the top. That sharp turn is where the pressure is lowest. The calculation finds a pressure coefficient of −2.5 just behind the nose, against +1 at the stagnation line itself.
How the flow lines are calculated
The streamlines come from a panel method. The section is split into 120 straight panels. Each panel carries a sheet of sources, and the whole outline carries a uniform swirl, or vortex, of one strength. The strengths are chosen so that no air passes through any panel and the flow leaves the sharp trailing edge smoothly. That last requirement is called the Kutta condition, and it is what fixes the amount of lift. Once the strengths are known, the velocity can be found at any point, and the streamlines are traced step by step from the left.
This is potential flow. It treats air as frictionless and incompressible, so it has no boundary layer and cannot predict stall or drag on its own. For a wing at low angles and at light-aircraft speeds it gives a good picture of the streamlines and the pressure. For the section alone it gives a lift coefficient of 0.26 at 0° and rises by about 0.12 per degree.
Two parts of the exhibit are simplified on purpose:
- Past the stall the solver is held at an angle just below the stall, the whole picture is turned to the angle you chose, and the separated region behind the upper surface is drawn by a rule, not computed. The swirling dots there show where the flow has broken away, not a calculated wake.
- The numbers in the readout do not come from the panel method. They use a finite-wing lift curve, described below, because a real wing loses lift at its tips and to friction.
Checking the numbers with the lift equation
The lift on a wing is
L = ½ ρ v² S C_L
where ρ is the air density, v the airspeed, S the wing area and C_L the lift coefficient. The readout writes this out with the current values. The model uses sea-level standard air, ρ = 1.225 kg/m³, and the Cessna's 16.2 m² wing. The weight is 1,111 kg × 9.81 m/s² = 10,899 N, or 10.9 kN.
Level flight at 220 km/h. 220 km/h is 61.1 m/s, so ½ρv² = 0.5 × 1.225 × 61.1² = 2,287 Pa. The lift coefficient needed is 10,899 ÷ (2,287 × 16.2) = 0.294.
The lift curve. For the whole wing, C_L = a (α − α₀). The zero-lift angle α₀ for a 2412 section from thin-airfoil theory is −2.08°: the cambered section still lifts at 0°. The slope a starts from the thin-airfoil value of 2π per radian for the section, reduced for the finite span with a = 2π ÷ (1 + 2π ÷ (π e AR)). The aspect ratio is AR = b² ÷ S = 11.0² ÷ 16.2 = 7.47, and e = 0.8 is an assumed span efficiency. That gives a = 4.71 per radian, or 0.0822 per degree. NASA's downwash page gives a correction of the same shape, C_L = C_L0 ÷ (1 + C_L0 ÷ (π AR)), which is the case e = 1.
So the angle needed is α = −2.08° + 0.294 ÷ 0.0822 = 1.5°, the value used in step 5 of the guide. At the Cessna's published cruising speed of 122 knots (226 km/h) the same working gives C_L = 0.279 and α = 1.3°.
Speed squared. Doubling the speed from 110 to 220 km/h multiplies the dynamic pressure by four. Move the airspeed slider and watch the lift change much faster than the speed.
Stall
Lift rises in a straight line with angle only up to a point. NASA's guide says that for thin airfoils the lift is proportional to angle within about ±10°, and that predicting the stall point mathematically is very difficult, so engineers rely on wind tunnel tests. Beyond the stall the boundary layer separates from the upper surface, the effective shape of the wing changes, and lift drops.
The model assumes a maximum lift coefficient of 1.5 for the clean wing, reached at 17.2°, and rounds the curve over in the last 2°. The stall speed is then
v_s = √(2W ÷ (ρ S C_Lmax)) = √(2 × 10,899 ÷ (1.225 × 16.2 × 1.5)) = 27.1 m/s, or 97 km/h.
Push the angle past 17° and three things happen at once on the stage: the streamlines lift away from the rear of the upper surface, the blue on the skin fades, and the drag arrow grows. The dot on the lift curve slides down the far side of the peak.
Flaps
The flap is the rear 25% of the section, hinged at 75% of the chord. Lowering it bends the camber line down at the back, which makes the section lift more at every angle. NASA describes flaps this way: they increase the effective camber, which raises the lift, and their large rear-facing area adds drag that helps the aircraft slow down to land.
In the readout, 30° of flap adds 0.6 to the lift coefficient at a given angle, which moves the zero-lift angle from −2.08° to −2.08° − 0.6 ÷ 0.0822 = −9.4°. The maximum lift coefficient rises to 1.88, a value chosen so that the full-flap stall speed comes out at 87 km/h (47 knots), the power-off, flaps-down stall speed published for the Cessna 172R. Both flap numbers are model assumptions tuned to that one published figure, not measurements.
At 100 km/h, ½ρv² is 473 Pa and the wing needs C_L = 1.42. With the flap down, α = −9.4° + 1.42 ÷ 0.0822 = 7.9°, a comfortable 6.6° below the stall. With the flap up the same lift needs about 15°, within 2° of the stall. That difference is why aircraft land with flaps down.
The panel method on its own predicts a much bigger jump from the flap (the section's lift coefficient at 0° goes from 0.26 to 2.40), because it knows nothing about the boundary layer. On a real flap the boundary layer keeps the air from following the bend at the hinge completely, so the gain is smaller.
Inside the wing
Turn on "See inside" to make the skin transparent. A light-aircraft wing is a thin shell held in shape from inside. The main spar is a beam near the thickest part of the section that carries most of the bending load into the fuselage. The rear spar closes the box and carries the flap hinges. The ribs hold the skin to the airfoil shape, with holes cut in them to save weight. In this model the spars sit at 27% and 71% of the chord. Those positions are drawn for clarity, not copied from Cessna drawings.
What a takeoff calculation can tell you
At 100 km/h the wing needs C_L = 1.42 to carry the model's weight. This is not a prescribed takeoff speed. It is a force balance at a chosen speed and density. A takeoff also requires acceleration along the runway, enough elevator authority to rotate, and a climb path that clears obstacles. The lift equation contains none of those requirements. It cannot supply a safe runway length by itself, even when its arithmetic is correct.
For a second calculation, keep the model's density and area but set the speed to 120 km/h. This is 33.3 m/s, giving a dynamic pressure near 681 Pa. The coefficient required for level flight becomes 10,899 ÷ (681 × 16.2) = 0.988. Compared with the 100 km/h case, the pilot can carry the same weight at a smaller angle. The extra speed has not made the aircraft lighter; it has increased the pressure scale acting on the wing. Conversely, at a fixed angle, the extra lift would accelerate the aircraft rather than automatically give level flight.
There is a useful distinction between a calculated threshold and an operating speed. The Cessna 172R information manual lists power-off stall speeds of 51 KCAS with flaps up and 47 KCAS with flaps down. KCAS means calibrated airspeed in knots, not groundspeed. The model's clean-wing estimate of 97 km/h is therefore an approximation, not a reproduction of every handbook value. Its full-flap coefficient was adjusted to agree with the published flaps-down figure. Matching that figure does not validate the whole aerodynamic model.
Do not use the drawing as a cockpit checklist. The manual's performance tables specify weight, flap setting and atmospheric conditions, and distinguish ground roll from distance over an obstacle. A real pilot uses the current manual for that particular aircraft. The archived information manual linked below is suitable for explaining the numbers, not for operating an aircraft.
Why the critical angle matters more than a speed label
A maximum C_L near 1.5 is a useful assumption for this display, not a universal property of wings. The attainable maximum depends on the section shape and on the state of the boundary layer. Surface contamination can change it. Reynolds number changes how viscous effects compare with inertial effects; neither a smooth potential-flow picture nor a single maximum coefficient captures all of that. Wind tunnel tests and flight tests are needed to establish the limits of an actual wing.
The boundary layer is the thin region close to the skin where friction slows the air. Behind the suction peak near the leading edge, pressure generally rises again towards the trailing edge. Air in the boundary layer must travel into that rising pressure. If it loses too much momentum, the flow can separate. Increasing the angle steepens the pressure recovery and can produce a large separated region. That is why simply tilting the wing farther does not keep increasing lift indefinitely.
A flap increases camber, but a leading-edge slat works differently. A slat opens a slot near the front of the wing and changes the flow and pressure distribution so that the main element can operate at a larger angle before separation. Some high-lift systems also increase effective area. Those devices need their own test data; there is no single multiplier that applies to every aircraft. This exhibit now has a slat as well as the trailing-edge flap, but its effect is a rule, not part of the panel calculation: it adds 0.45 to the maximum lift coefficient, which moves the stall about 5° later. A real slat needs its own test data.
Stall also depends on how much force the wing is asked to produce. In a coordinated level turn it must support a resultant force greater than weight. With unchanged maximum coefficient, stall speed increases with the square root of load factor. The same aircraft can therefore reach its critical angle at a higher speed while turning. The readout here compares lift with weight only; it does not simulate bank angle or a manoeuvring load. That missing load is one reason a green-looking balance on the display is not a flight-safety indication.
The cost of the vortices at the tips
Air below a lifting wing is generally at higher pressure than air above it. Near a free tip, the flow curves around the end, and a rolled-up wake develops behind the wing. Its downward motion changes the local direction of the relative wind. The aerodynamic force then has a rearward component as well as an upward component. That rearward component is induced drag, the drag associated with producing lift on a finite wing.
NASA gives C_Di = C_L² ÷ (π e AR). Using this display's AR = 7.47 and assumed e = 0.8, a lift coefficient of 0.294 gives C_Di about 0.0046. At C_L = 1.42 it is about 0.107. The much larger coefficient at low speed does not mean the same force ratio, because dynamic pressure has also changed. For the same weight and wing, induced drag in level flight increases as speed decreases. Parasite drag has the opposite general trend, so neither flying as slowly as possible nor as quickly as possible guarantees minimum total drag.
A winglet changes the loading and flow near the tip. It is not a plug that stops all air from crossing around the end, and it does not remove the wake that a lifting aircraft leaves. NASA reports a 6.5% fuel-use reduction in flight tests on a Boeing 707-type aircraft fitted with winglets. That is a result for a particular test programme, not a promised saving for every airliner, route or winglet shape. The same NASA page notes that some small test configurations made drag worse by adding surface area.
The cutaway here shows a section, not a full aircraft wake. Its finite-span correction influences the numerical lift curve, but the coloured streamlines do not resolve tip vortices. The spiral drawn at the near tip on the stage follows a rule that grows with the lift coefficient; it is an illustration, not a computed wake. There is no winglet control. Long glider wings, airport gate-span limits and the bending loads carried by a wing all matter when designers choose between extra span and a tip device. A drag benefit has to justify the added structure and wetted area as well.
Thin air and a longer takeoff run
With the Altitude slider at sea level the display uses 1.225 kg/m³; the slider follows the standard atmosphere and gives about 0.475 kg/m³ at 8,849 m, the height of Everest. To estimate the effect of thinner air on paper, assume instead ρ = 1.0 kg/m³ while keeping weight, wing area and coefficient unchanged. Lift at the same true airspeed becomes 1.0 ÷ 1.225 = 0.816 of the original value. Recovering the same lift requires a speed ratio √(1.225 ÷ 1.0) = 1.107. Thus a condition requiring 100 km/h in the denser air requires about 111 km/h true airspeed in this example. These densities are assumed comparison conditions, not a claimed altitude setting on the stage.
Indicated airspeed is based on the pressure sensed by the aircraft's instruments. Neglecting instrument and compressibility corrections, the indicated speed needed for the same lift remains approximately unchanged as density falls, while true airspeed rises. With no wind, groundspeed rises with it. A pilot cannot interpret the higher true speed as extra stall margin merely because the numerical value is larger. What matters aerodynamically is the dynamic pressure and the angle of attack.
The FAA calls the corresponding atmospheric measure density altitude. A high airport and a hot day can both produce a high density altitude. Reduced density can also reduce the thrust or power available from the propulsion system. The aircraft may then need to reach a higher groundspeed while accelerating less strongly. Both effects lengthen the takeoff run. Climb performance after leaving the ground may also be worse, which matters when an obstacle lies beyond the runway.
There is no universal percentage to add to every runway distance. Wind changes groundspeed without changing the airspeed needed for lift. Runway slope and surface change acceleration, while weight changes the force required. The relevant performance chart combines the stated conditions and its correction rules. The Takeoff scene on the stage changes altitude and weight with rounded model values; it ignores temperature, wind and runway slope and does not calculate an obstacle clearance distance.
Experiments using the controls
Start with the flap at 0° and compare 110 km/h with 220 km/h without touching the angle of attack. The lift should change by a factor of four because dynamic pressure changes by that factor. This is a fixed-angle experiment, not a comparison of two steady level-flight conditions. If you then reduce the angle to make lift equal weight again, the coefficient changes too, so the original fourfold relation no longer applies to the final force.
Next hold 100 km/h and compare the flap at 0° and 30°. Adjust the angle until the red lift arrow reaches the black weight tick in each case. The lower angle needed with flap shows the effect of increased camber. It does not demonstrate free lift: the flap also increases drag, and the model's maximum coefficient and stall angle are separately prescribed. Watch the lift-curve dot as well as the arrows so that a force balance beyond the peak is not mistaken for a normal operating point.
Finally turn on Time markers at 3.5°. Follow an orange line that connects particles released together, rather than choosing unrelated dots that happen to lie opposite each other. The upper part runs ahead. This tests the equal-transit claim directly, but does not measure all the pressures or the downstream momentum flux. The pressure colours provide a separate view of the same calculated flow. Turning off the colours does not turn off pressure in the physics.
Keep the limits of each view distinct. See inside reveals spars and ribs that carry loads; it does not change the aerodynamic equations. A streamline is a path in the steady velocity field, not a rigid rail of air. The separated-flow drawing past stall is illustrative. If its vortices look convincing, that still does not make them measured turbulence or a prediction of an aircraft's buffet.
The stage can also be handled directly. Drag the wing itself to change the angle of attack, or drag the glowing handles to lower the flap, slide the slat out and raise the spoiler. With the slat out, try 19° at 140 km/h: the bare wing has stalled there, the wing with the slat has not. Raise the spoiler at 180 km/h and lift falls below the weight although the angle has not changed. The Takeoff button switches to a runway: choose a Cessna 172R, an A320, a 747-400 or an ASK 21 glider, a weight and an airport height, and the run ends when lift at the take-off attitude reaches the weight. At 8,849 m an A320 at full weight runs out of a 4,000 m runway in this model; lighter, it gets airborne. These runs use rounded model values, not certified performance figures.
Questions
Do the air over and under a wing meet at the trailing edge?
No. Air that goes over the top reaches the trailing edge first, and the two parcels never meet again. NASA Glenn describes the equal transit time idea as one of the most common incorrect theories of lift. Turn on "Time markers" to see it in the model.
Is it Bernoulli or Newton?
Both. Adding up the pressure over the surface (Bernoulli) and adding up the change in momentum of the turned air (Newton) give the same force. The mistakes come from using either one with the wrong velocity or only half of the wing.
Why can a plane fly upside down?
Lift depends mostly on the angle of attack, not on which side of the wing is curved. Flying inverted, a pilot holds the nose high enough that the wing still meets the air at a positive angle. In the model, the 2412 section still lifts at 0° because of its camber, and stops lifting at about −2°.
What is a stall?
A stall happens when the angle of attack is too large for the air to follow the upper surface. The flow separates, lift drops and drag rises. It depends on angle, not directly on speed. A wing can stall at any speed if the angle is pushed past the critical value.
Why does lift grow with the square of speed?
The dynamic pressure ½ρv² measures the momentum carried by the oncoming air per unit area. Twice the speed means twice as much air reaching the wing each second, each parcel moving twice as fast, so four times the force at the same angle.
Why don't the streamline shapes change with the airspeed slider?
In frictionless, incompressible flow the pattern of streamlines depends only on the shape and the angle, not on the speed. The dots move faster and the lift grows, but the lines stay where they are. At much higher speeds, close to the speed of sound, compressibility would change the pattern too.
What does NACA 2412 mean?
2% maximum camber, located 40% of the chord back from the leading edge, with a maximum thickness of 12% of the chord. The shape is generated from the formulas in NACA Report 460.
Is 1.5 the maximum lift coefficient of every wing?
No. It is the clean-wing assumption used here. Section shape, surface condition and high-lift devices change the maximum. The display is not a substitute for measured aircraft data.
Do winglets always save 6.5% of fuel?
No. NASA's figure describes a particular Boeing 707-type flight-test programme. Benefits depend on the wing and operating conditions; a poorly matched device can add drag.
Why does a hot airport require more runway?
Lower density means a higher true airspeed for the same dynamic pressure, and can reduce available propulsion. Reaching that speed can take longer. The appropriate aircraft performance chart is needed; the lift equation alone cannot provide it.
Can I adjust altitude or slats here?
Yes. The Altitude control lowers the air density from sea level up to 8,849 m, and the slat and spoiler can be moved with their sliders or by dragging the glowing handles on the wing. Their effects are drawn as model values; the takeoff scene adds aircraft, weight and airport height.
Terms
- Airfoil: the cross-section shape of a wing.
- Chord: the straight line from the leading edge to the trailing edge, and its length.
- Camber: how much the mean line of the section curves above the chord.
- Angle of attack: the angle between the chord line and the oncoming air.
- Lift coefficient (C_L): lift divided by dynamic pressure and wing area. It folds the effects of shape and angle into one number.
- Dynamic pressure: ½ρv², the pressure the oncoming air could exert if brought to rest.
- Stagnation point: the place on the nose where the air comes to rest and divides.
- Kutta condition: the requirement that the flow leaves a sharp trailing edge smoothly. It fixes the lift in a potential-flow calculation.
- Stall: loss of lift when the flow separates from the upper surface.
- Flap: a hinged rear part of the wing that is lowered to add camber, lift and drag.
- Aspect ratio: span squared divided by wing area. Long thin wings have high aspect ratios.
Sources
NASA Glenn Research Center, Incorrect Lift Theory (equal transit). https://www.grc.nasa.gov/WWW/k-12/VirtualAero/BottleRocket/airplane/wrong1.html (checked 15 October 2026)
NASA Glenn Research Center, Bernoulli and Newton. https://www1.grc.nasa.gov/beginners-guide-to-aeronautics/bernoulli-and-newton/ (checked 15 October 2026)
NASA Glenn Research Center, Lift. https://www1.grc.nasa.gov/beginners-guide-to-aeronautics/lift-3/ (checked 15 October 2026)
NASA Glenn Research Center, Lift Equation. https://www1.grc.nasa.gov/beginners-guide-to-aeronautics/lift-equation/ (checked 15 October 2026)
NASA Glenn Research Center, Fluid Dynamics Interactive: Angle of Attack, Wing Stall. https://www1.grc.nasa.gov/beginners-guide-to-aeronautics/foilinc/ (checked 15 October 2026)
NASA Glenn Research Center, Downwash Effects on Lift. https://www1.grc.nasa.gov/beginners-guide-to-aeronautics/downwash-effects-on-lift/ (checked 15 October 2026)
NASA Glenn Research Center, Flaps and Slats Interactive. https://www1.grc.nasa.gov/beginners-guide-to-aeronautics/flaps-and-slats/ (checked 15 October 2026)
Jacobs, Ward and Pinkerton, The characteristics of 78 related airfoil sections from tests in the variable-density wind tunnel, NACA Report 460, 1933, NASA Technical Reports Server. https://ntrs.nasa.gov/citations/19930091108 (checked 15 October 2026)
University of Illinois Urbana-Champaign, UIUC Applied Aerodynamics Group, The Incomplete Guide to Airfoil Usage (Cessna 172: NACA 2412). https://m-selig.ae.illinois.edu/ads/aircraft.html (checked 15 October 2026)
Cessna Aircraft Company, Cessna 172R Information Manual (archived by Wayman College; specifications and performance conditions). https://wayman.edu/files/172R-POH.pdf (2026-10-22)
NASA, NOAA and US Air Force, U.S. Standard Atmosphere, 1976 (sea-level density 1.225 kg/m³), NASA Technical Reports Server. https://ntrs.nasa.gov/citations/19770009539 (checked 17 October 2026)
Calculations on this page: section shape from the NACA 4-digit formulas above; flow from a source-and-vortex panel method with the Kutta condition (120 panels); lift from L = ½ρv²SC_L; stall speed from v_s = √(2W ÷ (ρSC_Lmax)).
NASA Glenn Research Center, Winglets (Boeing 707-type flight tests). https://www1.grc.nasa.gov/beginners-guide-to-aeronautics/winglets/ (2026-10-22)
NASA Glenn Research Center, Induced Drag Coefficient. https://www1.grc.nasa.gov/beginners-guide-to-aeronautics/induced-drag-coefficient/ (2026-10-22)
FAA, Pilot’s Handbook of Aeronautical Knowledge, Chapter 4: Principles of Flight. https://www.faa.gov/sites/faa.gov/files/06_phak_ch4_0.pdf (2026-10-22)
FAA, Pilot’s Handbook of Aeronautical Knowledge, Chapter 11: Aircraft Performance. https://www.faa.gov/sites/faa.gov/files/13_phak_ch11.pdf (2026-10-22)
Airbus, A320ceo (dimensions and weights). https://www.aircraft.airbus.com/en/aircraft/a320-family/a320ceo (2026-10-27)
Boeing, 747-400 Airplane Characteristics for Airport Planning, D6-58326-1 Rev F. https://www.boeing.com/content/dam/boeing/v2/airports/acaps/747-400_Rev_F.pdf (2026-10-27)
Alexander Schleicher, ASK 21 technical data. https://www.alexander-schleicher.de/en/flugzeuge/ask-21/ (2026-10-27)
Airbus, A380 facts and figures (February 2022). https://www.airbus.com/sites/g/files/jlcbta136/files/2025-01/airbus-a380-facts-and-figures-february-2022.pdf (2026-10-27)
Heritage Concorde, Airframe dimensions. https://www.heritageconcorde.com/airframe-dimensions (2026-10-27)
Smithsonian National Air and Space Museum, 1903 Wright Flyer. https://airandspace.si.edu/collection-objects/1903-wright-flyer/nasm_A19610048000 (2026-10-27)
J. A. D. Ackroyd, The Aerodynamics of the Spitfire, Royal Aeronautical Society. https://www.aerosociety.com/media/4953/the-aerodynamics-of-the-spitfire.pdf (2026-10-27)
S. Lee, J. Kim, H. Park, P. G. Jabłoński and H. Choi, The Function of the Alula in Avian Flight, Scientific Reports 5, 9914 (2015). https://www.nature.com/articles/srep09914 (2026-10-27)
FAA, Pilot’s Handbook of Aeronautical Knowledge, Chapter 5: Aerodynamics of Flight. https://www.faa.gov/sites/faa.gov/files/07_phak_ch5_0.pdf (2026-10-27)
FAA, Advisory Circular 90-23G, Aircraft Wake Turbulence. https://www.faa.gov/documentLibrary/media/Advisory_Circular/AC_90-23G.pdf (2026-10-27)
FAA, Aeronautical Information Publication AD 2, Denver International (KDEN), elevation 5,433.8 ft. https://www.faa.gov/air_traffic/publications/atpubs/aip_html/part3_ad_2.0_colorado.html (2026-10-27)
Guinness World Records, Highest airport (Daocheng Yading, 4,411 m). https://www.guinnessworldrecords.com/world-records/63153-highest-airport (2026-10-27)
More exhibits
Roller coaster physics: how roller coasters work
A train that creeps over a 42 m lift hill at 3 m/s is doing 99 km/h at the bottom, and nothing but gravity has pushed it.
Bicycle gears: which gear makes climbing a hill easier
In a 50 by 11 gear one turn of the pedals moves a road bike 9.57 metres; in 34 by 32 it moves 2.24 metres.
How does a differential work in a car? A 3D gear model
Round a 10 m bend at 50 km/h and the outer rear wheel turns 17% faster than the inner one, yet both are driven from the same shaft.
Why do ships float?
A 1,900-tonne steel ship floats, yet the same 1,900 tonnes of steel pressed into a cube goes straight to the bottom.
Billiards angles: aiming, spin and the diamond system, step by step
Two equal balls that meet without spin part at a right angle, and a ball struck at its centre slides for 12/49 of v²/μg before it starts to roll.
How a steam locomotive works
Mallard's driving wheels are 2.03 m across, taller than most people, and at its record 126 mph they turned almost nine times a second.