FIG. 124Senses
Wind chill chart and calculator: how wind steals body heat
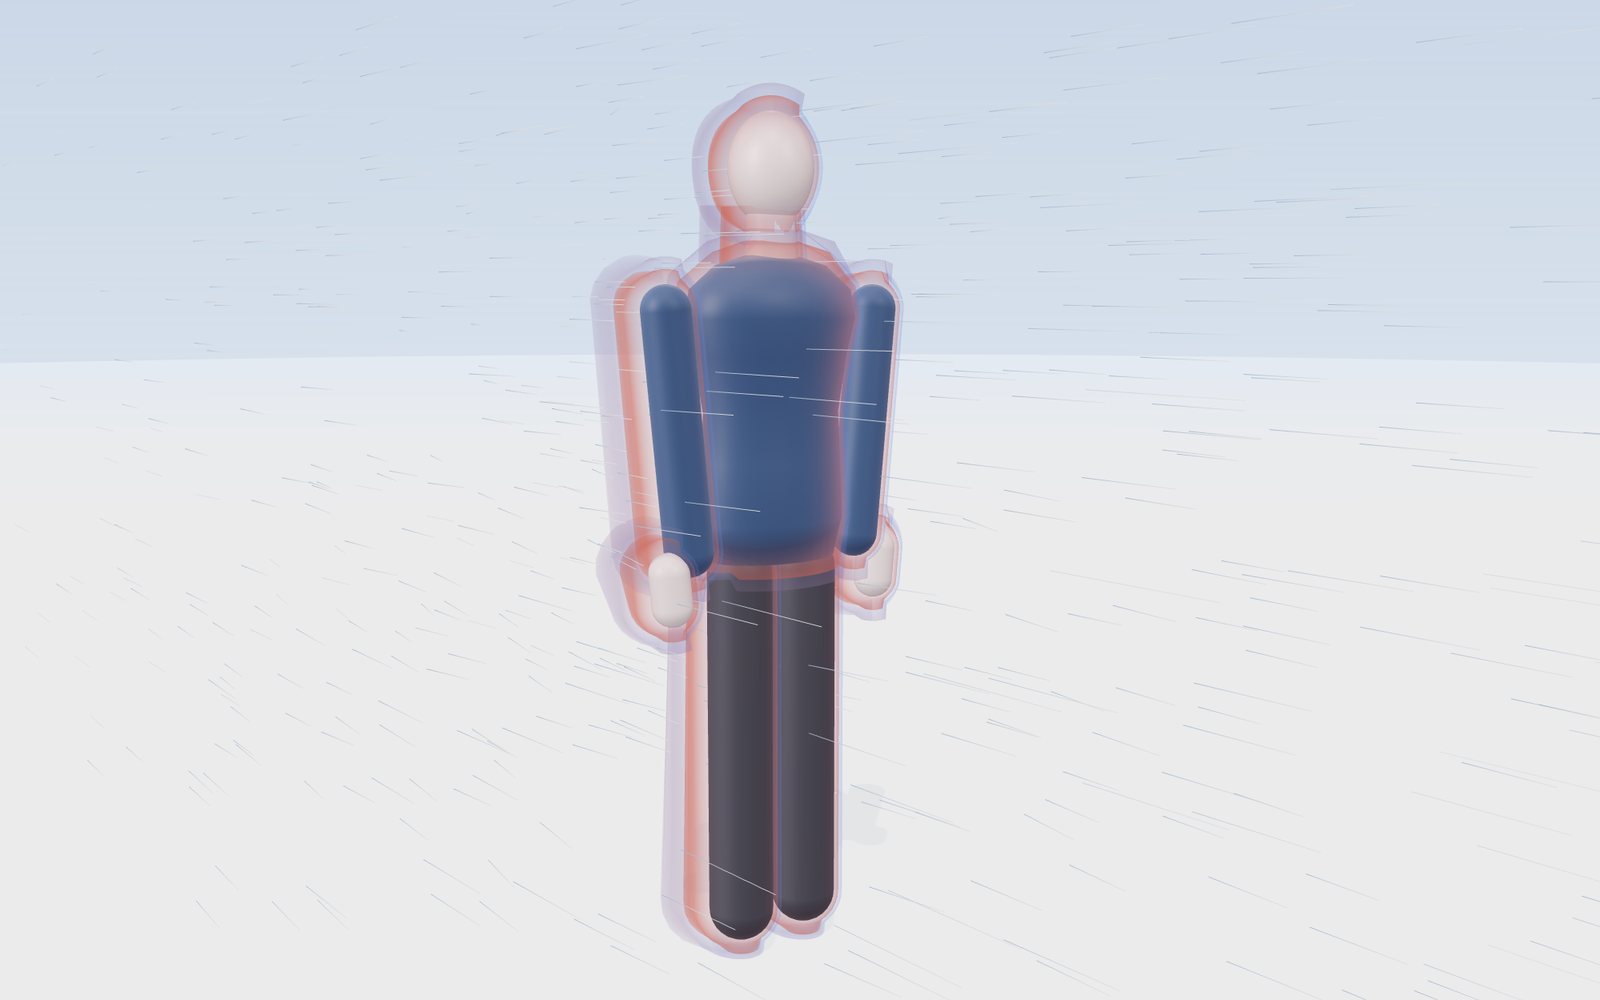
At 0 °F with a 15 mph wind the National Weather Service chart reads −19 °F, and exposed skin can freeze in 30 minutes.
This device cannot show the 3D model. You can read the guide steps below as text.
1 / 11 The NWS chart example0 °F and a 15 mph wind. The chart reads −19 °F: on bare skin this wind takes heat away as fast as still air at −19 °F would. Drag to turn the view.
Drag to turn. Scroll or pinch to zoom.
What the model shows
Step outside on a still morning at 20 °F (about −7 °C) and it feels cold but bearable. Step out at the same temperature into a 30 mph wind (about 13 m/s) and your cheeks soon start to sting. The thermometer reads the same in both cases. What changed is how fast your skin loses heat, and the wind chill temperature is the number weather services use to describe that. This exhibit shows why it happens and lets you read the official values: a smooth mannequin stands in the wind, a thin shell of warm air hugs its body, and as you raise the wind that shell is scraped thin on the windward side. The readout gives the wind chill from the National Weather Service (NWS) formula in °F and °C, the frostbite time printed on the NWS Wind Chill Chart, and the stage used by the Korea Meteorological Administration (KMA).
This is an educational model. It does not replace forecasts, advisories or warnings from your national weather service, and it does not describe symptoms or first aid. For those, the Health information section near the end links to the CDC, the NHS and the KMA.
What wind chill measures
Wind chill is not a temperature you can measure with a thermometer. It is a comparison. The NWS defines it as how cold people and animals feel when outside, based on the rate of heat loss from exposed skin caused by wind and cold. A wind chill of −19 °F means that, on bare skin, the actual weather takes heat away about as fast as still air at −19 °F would.
Two consequences follow from that definition, and both surprise people.
First, wind chill only applies to living things that are warmer than the air. A car radiator, a water pipe or a thermometer left in the wind cools faster, but it cools only to the air temperature, never below it. The NWS gives the example of −5 °F air with a wind chill of −31 °F: the radiator will not drop below −5 °F.
Second, wind chill describes exposed skin. Skin under a jacket, a scarf or a glove is not in the wind and is not described by the number. The index was built around the face, which is the part of the body most often left uncovered in winter.
The warm layer of air around your skin
Any warm object in cold air heats the air right next to it. That air is slowed by friction against the surface and sits there as a thin layer, a few millimetres to a few centimetres thick depending on the shape and the airflow. Heat has to cross this layer to escape, and still air is a poor conductor of heat. On a calm day the layer works like a very thin blanket.
Engineers call it the thermal boundary layer. Inside it, the temperature drops from close to skin temperature at the surface to the air temperature at its outer edge. The thinner the layer, the steeper that drop, and the faster heat flows out through it.
Wind does two things to this layer. It replaces the warmed air with fresh cold air, and it presses the layer thinner on the side that faces the wind. Around the flanks of a body, where the flow speeds up as it squeezes past, the layer is thin too. Behind the body the flow separates from the surface and breaks into swirls; the layer there is thicker but keeps being torn away and rebuilt.
That is what the shell around the mannequin shows. Its drawn thickness follows 1/√(wind), which is how the thickness of a simple boundary layer scales with flow speed, but the actual centimetres are not measured values: the picture is there to show the direction of the effect. The numbers in the readout come only from the formula and the chart.
Why heat loss does not double when the wind doubles
If wind thins the warm layer, why does a 40 mph wind not feel twice as cold as a 20 mph wind? The answer is in how the layer and the body behave together.
Heat leaving the face has to pass two barriers in a row: the tissue between the warm blood and the skin surface, and then the layer of air outside. At low wind the air layer is the bigger barrier, so a little wind makes a large difference. As the wind rises, the air layer becomes so thin that most of the remaining resistance is inside the skin itself, and extra wind changes less and less. That is why the wind term in the formula is raised to the small power 0.16: going from 5 to 10 mph changes the wind chill much more than going from 50 to 55 mph.
You can see this in the chart. At 0 °F, the wind chill drops by 5 degrees between 5 and 10 mph (from −11 to −16 °F), but only 2 degrees between 50 and 60 mph (from −31 to −33 °F).
The 2001 formula, term by term
On 1 November 2001 the NWS put a new wind chill temperature index into use. It was developed by the Joint Action Group for Temperature Indices (JAG/TI), a joint U.S. and Canadian government-sponsored group organised in the fall of 2000 to develop, test and introduce one standard index, and Environment Canada launched the same new index for Canadians that fall. In °F and mph it reads:
Wind chill (°F) = 35.74 + 0.6215 T − 35.75 V^0.16 + 0.4275 T V^0.16
where T is the air temperature in °F and V the wind speed in mph. In the metric form, with T in °C and V in km/h:
Wind chill (°C) = 13.12 + 0.6215 T − 11.37 V^0.16 + 0.3965 T V^0.16
The two forms give the same result after converting units. Compared at 400 combinations of temperature and wind, the two forms differ by less than 0.1 °F.
Read term by term, the formula says three things. The constant and the 0.6215 T term follow the air temperature. The −35.75 V^0.16 term lowers the result as the wind rises, with the small power that makes each extra mile per hour count for less. The last term, 0.4275 T V^0.16, makes the wind matter more when the air is colder: at 40 °F a 30 mph wind takes the wind chill down by 12 degrees, at −20 °F by 33 degrees.
The NWS lists what went into the model behind the formula:
- the wind speed at an average height of 5 feet, the typical height of an adult face, worked out from readings at the standard anemometer height of 33 feet (10 metres);
- a model of a human face;
- heat transfer theory for heat lost from the body to its surroundings on cold and windy days;
- a calm wind threshold lowered to 3 mph;
- a consistent standard for the heat resistance of skin tissue;
- no sun, as on a clear night.
The wind you put into the formula is the ordinary 10 m wind from a weather report. The formula already allows for the slower wind at face height, so you do not reduce it yourself.
Worked examples
0 °F and 15 mph. V^0.16 = 15^0.16 = 1.543. Then 35.74 + 0.6215 × 0 − 35.75 × 1.543 + 0.4275 × 0 × 1.543 = 35.74 − 55.14 = −19.4 °F, printed as −19 on the chart. This is the NWS's own example, and the chart shades it as a 30 minute frostbite cell.
−10 °C and 30 km/h. V^0.16 = 30^0.16 = 1.723. Then 13.12 − 6.215 − 11.37 × 1.723 + 0.3965 × (−10) × 1.723 = 13.12 − 6.215 − 19.59 − 6.83 = −19.5 °C. At the same temperature and only 5 km/h the result is −13 °C, which is the example the KMA gives.
Seoul, 24 January 2023. The KMA's record of daily minimum wind chill for station 108 (Seoul) gives −16.5 °C with a 10-minute wind of 25.2 km/h and a wind chill of −27.2 °C. With the formula: 25.2^0.16 = 1.676, so 13.12 − 10.25 − 19.05 − 10.96 = −27.15, published as −27.2 °C.
Daegwallyeong, 7 January 2021. The lowest value in this exhibit's records: −21.7 °C with a 10-minute wind of 53.6 km/h. 53.6^0.16 = 1.891, so 13.12 − 13.49 − 21.50 − 16.27 = −38.1 °C, the same as the KMA's published wind chill.
Reading the NWS wind chill chart
The NWS chart is a grid of 12 wind speeds (5 to 60 mph, down the side) and 18 temperatures (40 to −45 °F, across the top). Each cell holds the wind chill for that pair, rounded to a whole degree. The Controls tab of this exhibit has the full chart, and pressing a cell sets the stage to it.
Every one of the 216 printed values matches the formula rounded to the nearest degree; recomputing all 216 gives the same values. If you find a printed chart with a value one degree off, it is most likely a rounding difference in a reproduction.
Three things are worth noticing on the chart.
- Along any row, wind chill falls by about 6 or 7 degrees for every 5 degree drop in air temperature. That is the 0.6215 T plus 0.4275 T V^0.16 together.
- Down any column, the first steps of wind matter most. At 20 °F, going from calm to 5 mph already takes 7 degrees off (to 13 °F), while going from 50 to 60 mph takes off only 1 more (from −3 to −4 °F).
- The upper left corner is above freezing on the thermometer but below freezing as a wind chill. 35 °F in a 30 mph wind feels like 22 °F. More on what that does and does not mean below.
Between printed values the stage uses the next colder column and the next windier row to pick the frostbite shading. That way the shading it shows is never milder than the chart. The wind chill number itself is always computed from the formula at the exact values you set.
Frostbite times on the chart
The chart has three shaded bands: 30 minutes, 10 minutes and 5 minutes. They give the time in which exposed skin can freeze at that temperature and wind. The band edges do not follow a single wind chill value. For example, −47 °F at 10 mph sits in the 10 minute band, while −48 °F at 60 mph sits in the 5 minute band, and −35 °F at 10 mph is still in the 30 minute band. That is because the times come from a model of how quickly the cheek cools, which depends on the temperature and the wind separately, not only on their combination as a wind chill.
The facial cooling model behind these times was published by Peter Tikuisis and Randall Osczevski of Defence Research and Development Canada in 2003. They applied their dynamic model to many combinations of air temperature and wind, tabulated the steady cheek skin temperatures, and marked the times to freezing. One of their findings explains the shape of the bands: for combinations that give the same wind chill, the cheek cools faster at first when the wind is stronger. A strong wind on moderately cold air can therefore bring the 30 minute band closer than a light wind on colder air with the same wind chill.
The bands are guidance for an average adult with a dry face. The NWS tests used twelve adult volunteers. For who is most at risk in the cold, follow the CDC and NHS pages listed in the sources.
Same wind chill, different weather
Because the formula has two inputs, many different days give the same wind chill. The Controls tab has a small table for this: it takes the wind chill you have set and lists the temperature that would give the same value at 5, 10, 15, 20, 30, 40, 50 and 60 mph.
Try −20 °F as an example. At 5 mph you need air at about −8 °F; at 20 mph, about 2 °F; at 60 mph, about 9 °F. The three days would be described by the same number, yet they are not the same to be out in. The strong-wind day starts from warmer air, so the warm layer around a face is stripped faster at first, which is the effect Tikuisis and Osczevski described for the first minutes of exposure. The light-wind day starts from much colder air, which matters more for anything that is not skin: car batteries, pipes, a phone in your pocket.
This is also why weather services report the air temperature and the wind alongside the wind chill. The wind chill summarises heat loss from bare skin. It does not replace the two numbers it comes from.
Below 3 mph and above 50 °F
The NWS defines the wind chill temperature only for air temperatures at or below 50 °F and wind speeds above 3 mph. Above 50 °F, cold stress from wind is small and other indices describe how the weather feels. Below 3 mph the air is treated as calm, and the formula is not used: the wind chill is simply the air temperature.
The KMA applies the same idea in metric units. Its data portal states that winter wind chill is computed only when the temperature is 10 °C or lower and the wind is 1.3 m/s or more. The calculator on the same page returns the air temperature for winds of 4.8 km/h or less and never returns a value warmer than the air temperature.
In the exhibit, lowering the wind to 3 mph or less shows a note that the index is not defined and the temperature stands. Raising the temperature above 50 °F does the same.
Feels below freezing, but it is not
Set 35 °F and 30 mph and the wind chill is 22 °F, ten degrees below freezing. It is tempting to conclude that skin could freeze. It cannot. The NWS answers this directly: the air temperature itself has to be below freezing for frostbite to develop on exposed skin. Wind chill cannot cool your skin below the actual air temperature, so in above-freezing air you will not get frostbite. Cold, wet and windy weather above freezing can still be dangerous for other reasons, and the NWS points to hypothermia here; this page does not go into that, but the health links below do.
The same logic explains why wind chill means nothing for objects. A pipe in 25 °F air with a 30 mph wind will freeze faster than in still air, because the wind brings fresh cold air to it, but it will not get colder than 25 °F.
What the index leaves out
The formula is deliberately simple. Several things that change how cold you actually feel are not in it.
- Sunshine. The model assumes a clear night sky. Bright sun on your face adds heat and makes the real heat loss smaller than the index suggests.
- Humidity. When the index was tested, relative humidity changed the result by less than one degree, so it was left out.
- Clothing. The number is about bare skin. Covered skin is not described.
- Your body. Size, fitness, circulation, how long you are outside and whether you are moving all change how cold you feel. The index uses a standard adult face.
- Wetness. Wet skin loses heat much faster through evaporation. The index assumes dry skin.
These are reasons to treat the wind chill as a guide to the weather, not a measurement of a person.
The KMA formula and its four stages
The KMA publishes winter wind chill with the metric JAG/TI formula above, using the 10-minute mean wind in km/h. Its open data portal gives, for every station, the lowest wind chill of each day from October to April, together with the temperature and wind at that time. Summer is handled differently: from May to September the KMA uses a separate formula built on temperature and humidity.
The wind chill table on the KMA portal colours its cells in four stages:
| Stage | Wind chill |
|---|---|
| Attention (관심) | −10 °C or warmer |
| Caution (주의) | below −10 °C down to −25 °C |
| Warning (경고) | below −25 °C down to −45 °C |
| Danger (위험) | below −45 °C |
Switch the exhibit to °C to see the stage for the current weather. In °F mode the stage is hidden, because the KMA defines it in °C.
The NWS and KMA numbers are the same formula, so a given temperature and wind give the same wind chill in Seoul and in Chicago. What differs is how each service reports it: the NWS prints the 2001 chart in °F and issues local cold weather products, and the KMA publishes daily minimum values in °C with its four stages.
Real winter records
The Controls tab holds 26 real records. Each one has the temperature, the wind and the wind chill as the KMA published them, so the stage shows the day exactly as observed.
From the KMA open data portal, for 26 stations across South Korea, the lowest daily minimum wind chill recorded in the winters from December 2017 to February 2026, with the temperature and 10-minute wind at that moment:
| Station | Date | Temperature | Wind | Wind chill |
|---|---|---|---|---|
| Daegwallyeong | 7 Jan 2021 | −21.7 °C | 53.6 km/h | −38.1 °C |
| Incheon | 26 Jan 2018 | −17.1 °C | 31.7 km/h | −29.1 °C |
| Chuncheon | 9 Jan 2021 | −21.2 °C | 9.0 km/h | −28.2 °C |
| Dongducheon | 7 Jan 2021 | −17.7 °C | 22.0 km/h | −28.0 °C |
| Hongcheon | 9 Jan 2021 | −21.2 °C | 7.2 km/h | −27.2 °C |
| Jecheon | 7 Jan 2021 | −15.7 °C | 29.2 km/h | −26.8 °C |
| Chungju | 8 Jan 2021 | −17.3 °C | 13.7 km/h | −25.3 °C |
| Yeongwol | 7 Jan 2021 | −13.9 °C | 27.0 km/h | −24.1 °C |
| Wonju | 7 Jan 2021 | −15.1 °C | 16.9 km/h | −23.6 °C |
| Paju | 7 Jan 2021 | −15.5 °C | 35.6 km/h | −27.5 °C |
| Cheorwon | 8 Jan 2021 | −19.2 °C | 12.6 km/h | −27.3 °C |
| Inje | 8 Jan 2021 | −19.0 °C | 13.3 km/h | −27.3 °C |
| Seoul | 24 Jan 2023 | −16.5 °C | 25.2 km/h | −27.2 °C |
| Gangneung | 8 Jan 2021 | −15.0 °C | 31.3 km/h | −26.2 °C |
| Suwon | 8 Jan 2021 | −16.9 °C | 18.0 km/h | −26.1 °C |
| Yangpyeong | 8 Jan 2021 | −15.9 °C | 20.2 km/h | −25.4 °C |
| Sokcho | 7 Jan 2021 | −14.7 °C | 25.6 km/h | −24.9 °C |
| Daejeon | 25 Jan 2023 | −16.6 °C | 11.5 km/h | −23.7 °C |
| Daegu | 8 Jan 2021 | −13.4 °C | 25.2 km/h | −23.2 °C |
| Cheongju | 25 Jan 2023 | −16.3 °C | 10.4 km/h | −22.9 °C |
| Seosan | 24 Jan 2023 | −12.2 °C | 29.2 km/h | −22.3 °C |
| Gwangju | 8 Jan 2021 | −13.5 °C | 16.6 km/h | −21.5 °C |
| Busan | 8 Jan 2021 | −11.7 °C | 25.2 km/h | −21.0 °C |
| Jeonju | 8 Jan 2021 | −15.9 °C | 6.8 km/h | −20.8 °C |
| Ulleungdo | 7 Jan 2021 | −8.0 °C | 41.4 km/h | −18.2 °C |
| Jeju | 24 Jan 2023 | −3.2 °C | 43.2 km/h | −12.0 °C |
Two patterns stand out. Most of the lows fall in two cold outbreaks, 7 to 9 January 2021 and 24 to 25 January 2023. And the order by wind chill is not the order by temperature. Chuncheon was colder than Incheon by 4 degrees on the thermometer, but Incheon's 31.7 km/h wind gave it the lower wind chill. Jeju barely went below freezing, yet a 43.2 km/h wind took its wind chill to −12.0 °C. Recomputing every one of these 26 rows from the temperature and wind gives the published wind chill to within 0.1 °C.
For comparison, NWS forecast office summaries in the United States report these values. They are not in the Controls tab, because the summaries do not give the wind speed with them (and some do not give the temperature), so the stage could not show those mornings without inventing a number:
| Place | Date | Low temperature | Lowest wind chill |
|---|---|---|---|
| Grand Forks, ND (airport) | 1 Feb 1996 | not given | −65 °F |
| Grand Forks, ND (airport) | 29 Jan 2019 | not given | −61 °F |
| Fargo, ND (airport) | 19 Jan 1985 | not given | −61 °F |
| Fargo, ND (airport) | 29 Jan 2019 | not given | −56 °F |
| Cedar Rapids, IA (airport) | 30 Jan 2019 | not given | −55 °F |
| Bloomington, IL (airport) | 30 Jan 2019 | −21 °F | −53 °F |
| Chicago O'Hare | 30 Jan 2019 | −23 °F | −52 °F |
| Peoria, IL | 30 Jan 2019 | −20 °F | −44 °F |
| Springfield, IL | 30 Jan 2019 | −14 °F | −40 °F |
| Albany, NY (airport) | 4 Feb 2023 | −13 °F | −34 °F |
| Chicago O'Hare | 14 Jan 2024 | −10 °F | −33 °F |
| Chicago O'Hare | 21 Jan 2025 | not given | −28 °F |
The NWS Grand Forks office notes that the 1996 and 1985 values are the coldest wind chills in the airport records since 1948.
The cold outbreak of January 2019
Several of the records in this exhibit come from the same few days. In late January 2019 a mass of Arctic air settled over the Midwest of the United States, and the NWS offices in the region wrote detailed summaries afterwards.
In Chicago, O'Hare airport recorded −23 °F on the morning of 30 January, the coldest temperature in the city in 34 years, and a wind chill of −52 °F an hour earlier. Rockford set its all-time record low the next morning at −31 °F. Peoria spent 41 hours at or below 0 °F. At Mount Carroll, in far northwestern Illinois, an observer recorded −38 °F, which the State Climate Extremes Committee now lists as the Illinois all-time record, beating −36 °F from 1999. Further west, Cedar Rapids and Moline set all-time record lows, and the Cedar Rapids airport reported a wind chill of −55 °F. In North Dakota, the Grand Forks airport reached a wind chill of −61 °F on 29 January.
Six years later the NWS Chicago office noted something unusual about a smaller outbreak: during the cold of 19 to 24 January 2025 there was little snow on the ground. Since 1942, only 28 days in Chicago with below-zero temperatures had had no snow cover, a little under 5 % of all its below-zero days. Snow cover usually helps the air cool overnight, so very cold air without it points to how cold the air mass itself was.
Exposed skin: how much of you the number is about
The wind chill index describes bare skin, so it is worth asking how much skin a dressed person leaves bare. Burn care has used area charts for decades. In the Lund and Browder chart of 1944, an adult's head is about 7 % of the body surface, the neck 2 % and each hand 2.5 %. A person in a winter jacket and trousers but no hat, scarf or gloves therefore has about 14 % of their skin in the wind.
The exhibit's Hat and face cover switch covers the head and neck, and the Gloves switch covers the hands. With both on, the exposed share drops to 0 % and the wind chill no longer describes any part of the mannequin. The exhibit does not compute how much warmer covered skin stays: that depends on the fabric, its thickness, how much wind passes through it and whether it is wet, and there is no single official value. The covers only change what the number applies to.
The old index: water in Antarctica
The first wind chill index came from Antarctica. The NWS describes the 1945 research of the Antarctic explorers Paul Siple and Charles Passel this way: they measured the cooling rate of water in a container hanging from a tall pole outside. Environment Canada describes the same index as estimated by measuring heat loss from cylinders of water in the Antarctic. From those rates came a heat loss in kilocalories per square metre per hour, later quoted in watts per square metre. The NWS calculator notes still give the formula in that form:
Heat loss (W/m²) = (12.1452 + 11.6222 √V − 1.16222 V) × (33 − T)
with V in m/s and T in °C. The exhibit shows this number in the readout as the 1945 index heat loss, rounded to the nearest 10 W/m², so you can compare how the two approaches react to wind.
The old index was used by the United States and Canada for decades, but it had problems. A container of water freezes faster than flesh, so, in the NWS's words, the old index underestimated the time to freezing and overestimated the chilling effect of the wind. Environment Canada adds two more: plastic cylinders have no internal heat source and do not react to cold the way blood vessels in skin do, and the old wind speeds came from towers more than 10 metres above the ground rather than the average human height of 1.5 metres, where friction cuts the wind to about two thirds. The new index started from tests on a mannequin head with a skin of heat-conducting material, run by Environment Canada and the Department of National Defence. In early summer 2001 it was checked in human trials at the Defence and Civil Institute of Environmental Medicine in Toronto, where 6 male and 6 female volunteers sat in a chilled wind tunnel.
Cold weather advisories and warnings
The wind chill number on this page is not a warning. Official alerts are issued by weather services using their own criteria, which take forecasts, duration and local climate into account.
In the United States, the NWS sets the criteria for Cold Weather Advisories and Extreme Cold Warnings locally. As an example, the NWS gives the Rochester, New York, area: an Extreme Cold Warning when the apparent temperature, with or without wind, is expected to fall to −25 °F or lower, and a Cold Weather Advisory when the air temperature or wind chill is expected to fall between −15 and −24 °F. Other areas use other thresholds, because people in Minneapolis and in Atlanta are used to different winters.
In Korea, the KMA issues cold wave alerts under its own criteria. Check the KMA's weather pages for current alerts and the criteria in force; the values in this exhibit are not a substitute.
What the model simplifies
- The shell of warm air is drawn, not computed. Its thickness follows 1/√(wind) for the picture, and the thinning on the windward side and the ragged lee are shown qualitatively.
- The wind lines follow the textbook flow around a vertical cylinder the width of the body, plus a drawn wavy wake. Real flow around a person is three-dimensional and turbulent.
- The tint of the exposed skin follows the air temperature as a picture. It is not a skin temperature.
- The frostbite band comes from the printed chart cell, rounded toward the colder and windier side between printed values. The real times depend on the person and the situation.
- The KMA stage uses the °C wind chill rounded to a whole degree, as the KMA table does.
- The exposed skin percentages are adult values from a burn chart, used only to show how much skin a dressed person leaves bare.
Health information
This page does not describe frostbite or hypothermia symptoms or what to do about them. For that, use the guidance of health and weather agencies:
- CDC, Preventing Frostbite
- NHS, Frostbite
- NHS, Hypothermia
- NWS, Cold safety
- KMA, life weather index guide
The addresses are in the Sources list below and in the Health information box of the Controls tab.
Questions
How is wind chill calculated?
With the 2001 NWS and Canadian formula: wind chill (°F) = 35.74 + 0.6215 T − 35.75 V^0.16 + 0.4275 T V^0.16, with T in °F and V in mph. In °C with V in km/h it is 13.12 + 0.6215 T − 11.37 V^0.16 + 0.3965 T V^0.16. The KMA uses the metric form. The formula is used for temperatures at or below 50 °F (10 °C) and winds above 3 mph.
What is the wind chill at 0 °F with a 15 mph wind?
−19 °F, as printed on the NWS chart. The NWS notes that at this wind chill, exposed skin can freeze in 30 minutes.
How long does it take to get frostbite in the cold?
The NWS chart shades three bands: 30 minutes, 10 minutes and 5 minutes on exposed skin. Which band applies depends on both the temperature and the wind. For example, −25 °F with a 30 mph wind is in the 5 minute band. The times come from tests on twelve adult volunteers, six men and six women, walking in a cold wind tunnel.
How cold is too cold to be outside?
There is no single temperature. The NWS chart shows how the risk grows with cold and wind together: at 0 °F with a 15 mph wind (wind chill −19 °F) exposed skin can freeze in 30 minutes, and at −25 °F with a 30 mph wind it can freeze in 5 minutes. Alerts are set by each weather office for its own area. Near Rochester, New York, for example, the NWS issues a Cold Weather Advisory for an air temperature or wind chill of −15 to −24 °F and an Extreme Cold Warning at −25 °F or lower. In Korea, follow the KMA's cold wave alerts. For who is most at risk, use the CDC and NHS pages in the Health information list. The model on this page is not a forecast.
Why does wind make it feel colder?
Skin warms a thin layer of still air next to it, a few millimetres to a few centimetres thick, and heat has to cross that layer to escape. Wind keeps replacing the warmed air with cold air and presses the layer thinner, so heat leaves the skin faster. The air itself is no colder: a thermometer in the same wind shows the same temperature. The wind chill puts the faster heat loss on a temperature scale. Raise the wind on the stage and watch the orange layer thin on the windward side.
What is the difference between wind chill and the heat index?
They describe opposite weather. Wind chill combines air temperature and wind, and the NWS uses it only at 50 °F or colder with a wind above 3 mph. The heat index combines air temperature and relative humidity for hot weather: in the NWS example, 96 °F air at 65 % humidity gives a heat index of 121 °F. Some apps show one "feels like" value that is the wind chill in winter and the heat index in summer. This exhibit covers only the wind chill.
Can you get frostbite when it is above freezing?
No. The NWS states that the air temperature must be below freezing for frostbite to develop on exposed skin. A wind chill below 32 °F in air above 32 °F does not cause frostbite, although cold and wet conditions carry other risks.
Does wind chill affect cars, pipes or plants?
Wind makes objects cool faster, but only down to the air temperature. A car radiator in −5 °F air with a −31 °F wind chill will not drop below −5 °F. Wind chill as a number applies to people and animals.
Why do the wind chill numbers differ between apps?
Most services use the same 2001 formula, so differences usually come from different inputs: a forecast versus an observation, wind averaged over a different period, a station at a different place, or rounding. Some apps also show a "feels like" value that mixes wind chill in winter with a heat index in summer.
Is the Korean wind chill (체감온도) the same as the American one?
In winter, yes. The KMA's open data portal gives the same JAG/TI formula in °C and km/h, used with the 10-minute mean wind, for temperatures of 10 °C or lower and winds of 1.3 m/s or more. In summer the KMA uses a different formula based on temperature and humidity.
What wind speed goes into the formula?
The standard 10 m (33 ft) wind from a weather station or forecast. The formula itself accounts for the lower wind at face height, about 5 feet.
Why is wind chill not given when the wind is light?
Below 3 mph the air is treated as calm and the formula is not used; the wind chill equals the air temperature. The KMA calculator does the same for winds of 4.8 km/h or less.
Does sunshine change the wind chill?
The index assumes no sun, as on a clear night. Sunshine on the face adds heat, so the actual heat loss is lower than the index suggests. The formula does not include a correction for it.
What are the KMA wind chill stages?
The KMA table colours wind chill in four stages: Attention at −10 °C or warmer, Caution below −10 down to −25 °C, Warning below −25 down to −45 °C, and Danger below −45 °C.
What was the old wind chill index?
The index devised by Paul Siple and Charles Passel from water-freezing experiments in Antarctica, published in 1945. It was replaced in 2001 by the JAG/TI index, which models heat loss from a human face.
Terms
- Wind chill temperature: the still-air temperature that would take heat from bare skin as fast as the actual temperature and wind do.
- Thermal boundary layer: the thin layer of air next to a warm surface, through which heat has to pass by conduction.
- JAG/TI: Joint Action Group for Temperature Indices, the group that agreed the 2001 index.
- Frostbite time: on the NWS chart, the time in which exposed skin can freeze at a given temperature and wind.
- 10 m wind: wind measured at the standard anemometer height of 10 metres (33 feet).
- Exposed skin: skin not covered by clothing, the only skin the index describes.
Sources
- National Weather Service, Wind Chill Chart (effective 11/01/01). https://www.weather.gov/media/safety/windchillchart3.pdf (checked 2026-10-28)
- National Weather Service, Understanding Wind Chill (with Wind Chill FAQ). https://www.weather.gov/safety/cold-wind-chill-chart (checked 2026-10-28)
- National Weather Service El Paso, Wind Chill calculator notes (formula in °F and in W/m²). https://www.weather.gov/media/epz/wxcalc/windChill.pdf (checked 2026-10-28)
- National Weather Service El Paso, Wind Chill Calculator. https://www.weather.gov/epz/wxcalc_windchill (checked 2026-10-28)
- NOAA Weather Prediction Center, Wind Chill (knots table). https://www.wpc.ncep.noaa.gov/html/windchill.shtml (checked 2026-10-28)
- National Weather Service, Cold Safety. https://www.weather.gov/safety/cold (checked 2026-10-28)
- National Weather Service, Heat Index (Heat Safety Resources). https://www.weather.gov/safety/heat-index (checked 2026-10-30)
- Korea Meteorological Administration, Open MET Data Portal, 체감온도 (formula, conditions, wind chill table and daily station values). https://data.kma.go.kr/climate/windChill/selectWindChillChart.do (checked 2026-10-28)
- Korea Meteorological Administration, 생활기상지수 지수안내. https://www.weather.go.kr/w/theme/daily-life/life-weather-info-index.do (checked 2026-10-28)
- NWS Chicago, January 30-31, 2019: Record to Near-Record Cold in Northern Illinois. https://www.weather.gov/lot/RecordColdJan2019 (checked 2026-10-28)
- NWS Lincoln, IL, Review of the Arctic Blast of Late January 2019. https://www.weather.gov/ilx/30jan2019-arctic (checked 2026-10-28)
- NWS Quad Cities, Summary of Record Cold: Jan 29-31 2019. https://www.weather.gov/dvn/summary_01302019 (checked 2026-10-28)
- NWS Grand Forks, Late January 2019 Extreme Cold Summary. https://www.weather.gov/fgf/2019_01_29-31_ExtremeCold (checked 2026-10-28)
- NWS Albany, February 3-4, 2023 Arctic Cold. https://www.weather.gov/aly/February_3-4_2023_Arctic_Cold (checked 2026-10-28)
- NWS Chicago, January 14-17, 2024: Multiday Stretch of Bitterly Cold Temperatures and Wind Chills. https://www.weather.gov/lot/2024_01_14-17_Cold (checked 2026-10-28)
- NWS Chicago, January 19-24, 2025: Multiday Cold Spell. https://www.weather.gov/lot/2025_01_19-24_ColdSpell (checked 2026-10-28)
- NOAA National Centers for Environmental Information, State Climate Extremes Committee records. https://www.ncei.noaa.gov/access/monitoring/scec/records (checked 2026-10-28)
- P. Tikuisis, R. J. Osczevski, Facial Cooling During Cold Air Exposure, Bulletin of the American Meteorological Society 84 (7), 927 to 934 (2003). https://journals.ametsoc.org/view/journals/bams/84/7/bams-84-7-927.xml (checked 2026-10-28)
- National Weather Service, Wind Chill Temperature Index (brochure). https://www.weather.gov/media/twc/wind-chill-brochure.pdf (checked 2026-10-29)
- Environment Canada, Science and the Environment Bulletin No. 27, November/December 2001, "The New Formula for Cold". https://publications.gc.ca/Collection/EN1-28-1-2001-08E.pdf (checked 2026-10-29)
- R. Osczevski, M. Bluestein, The New Wind Chill Equivalent Temperature Chart, Bulletin of the American Meteorological Society 86 (10), 1453 to 1458 (2005). https://doi.org/10.1175/BAMS-86-10-1453
- P. A. Siple, C. F. Passel, Measurements of Dry Atmospheric Cooling in Subfreezing Temperatures, Proceedings of the American Philosophical Society 89 (1), 177 to 199 (1945).
- C. C. Lund, N. C. Browder, The estimation of areas of burns, Surgery, Gynecology and Obstetrics 79, 352 to 358 (1944).
- Centers for Disease Control and Prevention, Preventing Frostbite. https://www.cdc.gov/winter-weather/prevention/preventing-frostbite.html (checked 2026-10-28)
- NHS, Frostbite. https://www.nhs.uk/conditions/frostbite/ (checked 2026-10-28)
- NHS, Hypothermia. https://www.nhs.uk/conditions/hypothermia/ (checked 2026-10-28)
Text and simulation: CC BY-NC-SA 4.0, except where noted.
More exhibits
How to do CPR, use an AED, help someone choking and use a fire extinguisher
Push 100 to 120 times a minute, about 5 cm deep: with a bystander doing that, survival in Korea in 2024 was 2.36 times higher.
Layers of the Earth: depth and density, interactive model
Nobody has drilled deeper than 12.3 km, yet we know the pressure at the centre to within a few per cent, because earthquakes shine through the planet.
Walk down the Grand Canyon rock layers
Walk 1,360 m down the Bright Angel Trail through 13 rock layers, from a 270-million-year-old sea floor on the rim to 1.75-billion-year-old schist by the river.
Map projections: why Greenland looks as big as Africa
On a Mercator map Greenland looks bigger than Africa, which is in fact about 14 times larger.
Why salt forms cubes: crystal structure and unit cells
A grain of table salt is a stack of cubes 0.564 nm on a side, with sodium and chlorine alternating along every edge.
How lightning and thunder work
A lightning channel heats the air to about five times the temperature of the Sun’s surface, and its thunder needs about 3 seconds to cover each kilometre to you.