FIG. 73How It Works
Disc brake and ABS simulator: how they work, step by step
On a dry road at 100 km/h a skidding tyre needs about 51 m to stop, while a tyre that ABS keeps turning stops the same model car in 36 m.
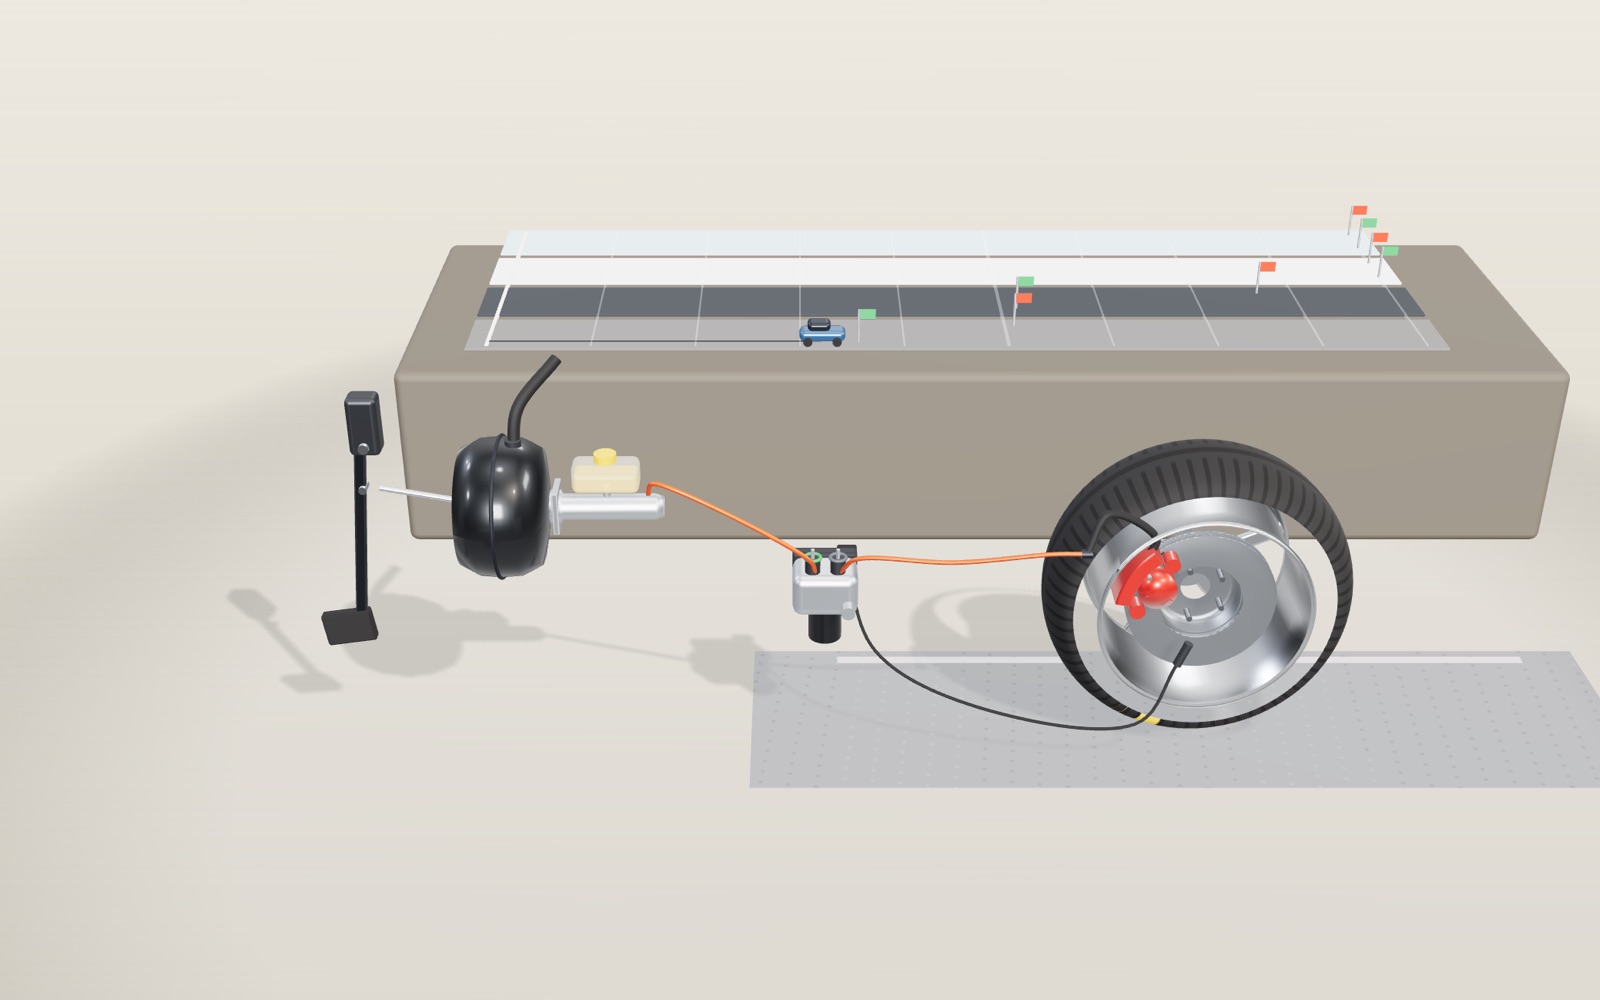
This device cannot show the 3D model. You can read the guide steps below as text.
1 / 8 One wheel, from pedal to roadThe model shows the brake for one front wheel, with the pedal on the left and the wheel on the right. The test track at the back compares stopping distances. The car is braking from 100 km/h with 300 N on the pedal, and the panel in the corner follows the force all the way.
Drag to turn. Scroll or pinch to zoom.
What the model shows
Press the brake pedal of a car with your right foot and a tonne and a half of metal slows from motorway speed in a few seconds. Your leg can push with perhaps 300 newtons, roughly the weight of a 30 kg sack. Somewhere between the pedal and the road that push has to grow into thousands of newtons, and then it has to be handed to a tyre that can only grip so hard before it slides. This exhibit follows both halves of that story.
The model shows the brake for one front wheel at full size. On the left is the pedal, with the vacuum booster and the master cylinder behind it. A steel brake line runs from the master cylinder through the ABS modulator to a flexible hose and a red floating caliper. The caliper straddles a ventilated disc 300 mm across, inside a wheel with a tyre 0.31 m in radius. We look at it from the inboard side, the way you would see it from under the middle of the car, so the piston faces you.
Behind the brake is a test track drawn at 1:40, with a dry lane, a wet lane and an icy lane. While the model brakes, a small blue car runs the same stop on the track. The panel in the corner of the stage gives the force at every stage, then the live wheel speed, slip and pressure, and finally a table of stopping distances. All of it is worked out from the sizes in the model.
How a 300 N push becomes 25 kN at the pads
The pedal is a lever. Its pivot is at the top, the driver’s foot pushes 0.4 m below it, and the pushrod is attached 0.1 m below it. Turning moments must balance, so the pushrod gets four times the foot force: 300 N becomes 1,200 N. The foot travels four times as far as the pushrod to pay for it.
Next comes the vacuum booster, the big black drum. A rubber diaphragm divides it into two chambers. While the engine runs, both sides are held at low pressure. When the pedal moves, a valve lets outside air into the rear chamber, and the air pressure on the diaphragm adds to the driver’s push. In this model the booster sends out 3.5 times what comes in, so the master cylinder receives 4,200 N. The ratio is a model value; real boosters are sized to suit each car.
The master cylinder turns that force into pressure. Its piston is 22.2 mm across (7/8 inch, a common size), giving an area of 3.87 cm². Pressure is force divided by area, so 4,200 N ÷ 0.000387 m² = 10.9 MPa, about 107 times atmospheric pressure.
Pascal’s principle in the brake line
Brake fluid is a liquid and barely changes volume under pressure. In a sealed system that means a pressure raised at one point is felt everywhere else in the fluid. This is Pascal’s principle, and it lets a pair of pistons act like a lever made of oil.
The caliper piston is 54 mm across. Area goes with the square of the diameter, so it has (54 ÷ 22.2)² = 5.92 times the area of the master piston. The same 10.9 MPa on 22.9 cm² pushes with 24.9 kN, about the weight of 2.5 tonnes. Counting the pedal, the booster and the two pistons, the foot force has been multiplied 4 × 3.5 × 5.92 = 83 times.
As with any lever, distance pays for force. Fluid pushed out of the master cylinder has to go somewhere, and the volume is the same at both ends. For every 1.2 mm the master piston moves, the caliper piston moves only 0.2 mm. That suits a brake well, because the pad only has to close a gap of a fraction of a millimetre before it presses on the disc.
The caliper in the model is a floating type with a single piston. The piston pushes the inboard pad onto the disc. The reaction pushes the caliper body the other way, and the body slides on two guide pins until its fingers pull the outboard pad onto the other face of the disc. Both pads end up pressed with the same 24.9 kN.
From clamping force to a force on the road
Pressing the pads does not stop anything by itself; friction does. With a friction coefficient of 0.4 between pad and cast iron, each face gives 0.4 × 24.9 kN = 9.9 kN of drag, and the two faces give 19.9 kN. That drag acts about 0.115 m from the axle, where the middle of the pad sits, so the brake torque is 19.9 kN × 0.115 m = 2,290 N·m.
The tyre has to turn that torque into a force on the road. Dividing by the rolling radius of 0.31 m, the brake asks the tyre for 7.37 kN. The panel shows this number as “force asked of the tyre”. Whether the tyre can deliver it depends on the road, and that is where the second half of the story begins.
Why a locked wheel slides farther
A tyre rolling along the road has a contact patch that is momentarily at rest on the asphalt. The grip there is static friction, which is the same reason a car can start from rest without spinning its wheels. Once the tyre slides, the grip becomes sliding (kinetic) friction, which is usually weaker. HyperPhysics at Georgia State University puts it simply: the traction a tyre can get is set by static friction, and when the wheel is locked and sliding the friction force is “usually significantly less”.
Real tyres do not jump straight from one to the other. While braking, the tyre surface turns a little slower than the car moves. Engineers measure this with the slip ratio: (car speed − tyre surface speed) ÷ car speed. Zero means free rolling and 100% means a locked wheel. Grip rises steeply over the first few per cent of slip, peaks, and then falls away as the tyre slides.
The model uses the Burckhardt curves, a widely used fit with published constants for dry asphalt, wet asphalt and ice. On dry asphalt grip peaks at μ = 1.17 at 17% slip and drops to 0.76 when the wheel is locked. On wet asphalt it peaks at 0.80 at 13% slip and drops to 0.51. These are model values from the fit, not measurements of any particular tyre.
Each wheel in the model carries a quarter of a 1,500 kg car, 3,679 N. On a wet road the most the tyre can give is 0.80 × 3,679 N = 2.9 kN. The brake asks for 7.4 kN, more than twice that, so the slip runs away and the wheel stops in about a tenth of a second. The skid marks on the road start there. From then on the tyre gives only 0.51 × 3,679 N, and the stop is long.
The numbers for stopping distance
If the tyre force stays at μ times the weight, the car slows at μg, where g = 9.81 m/s². A car moving at speed v then needs a distance v² ÷ (2μg) to stop. At 100 km/h, which is 27.8 m/s:
| Road | μ at peak | μ locked | Stop at peak μ | Stop locked |
|---|---|---|---|---|
| Dry asphalt | 1.17 | 0.76 | 33.6 m | 51.7 m |
| Wet asphalt | 0.80 | 0.51 | 49.1 m | 77.1 m |
| Ice | 0.05 | 0.05 | 787 m | 787 m |
The simulation in the model steps through the stop every quarter of a millisecond and gives almost the same answers. With locked wheels it stops in 50.9 m dry and 76.4 m wet, slightly shorter than the formula because the tyre gripped harder for the instant before it locked. With ABS it stops in 35.6 m dry and 51.6 m wet. That is a little longer than the ideal peak figure, because ABS keeps the tyre near the peak rather than exactly on it. At 50, 100 and 130 km/h the simulated stops agree with v² ÷ (2μg).
Speed matters more than anything else in that formula, because it is squared. At 50 km/h the dry stop with ABS is 9.0 m; at 130 km/h it is 60.1 m. The distance covered while the driver reacts is not included. At one second of reaction time, 100 km/h adds another 27.8 m before the brakes even start.
What the ABS modulator does
Anti-lock brakes keep the slip near the top of the grip curve. A toothed ring on the hub, 48 teeth in the model, passes a magnetic sensor, and the pulses tell the control unit how fast the wheel turns. Comparing the wheels with each other and with how fast the car is slowing, the unit can tell when one wheel is starting to lock.
The modulator has two valves for each wheel. The inlet valve normally stays open so the driver’s pressure goes straight through. When the slip passes 20%, the model’s control unit shuts the inlet valve and opens the outlet valve. Fluid leaves the caliper, the pressure falls, and the road spins the wheel back up. Once the slip drops below 8%, the outlet valve closes and the inlet opens again to build the pressure back up. In between, both valves can stay shut to hold the pressure. A small pump returns the released fluid toward the master cylinder, which is why drivers feel the pedal pulse.
In the model this cycle repeats about 13 times a second on a dry road and 14 times a second on a wet one. The slow-motion switch stretches the stop so you can follow the valves and the pressure tag one cycle at a time.
Keeping the steering
A tyre can push sideways only while it rolls. When a front wheel locks, the rubber slides in whatever direction the car is already moving, and turning the steering wheel achieves almost nothing. The “Steer one lane over” switch asks the model driver to move 3.5 m to the side during the stop. With ABS on, the blue car makes the full lane change on dry and wet roads. With the wheels locked it moves less than a metre, almost all of it in the instant before the wheels stopped turning. The sideways grip here comes from a simple model rule that shrinks as slip grows, so the numbers are a sketch rather than a measured result.
This is the main reason the advice for drivers of cars with ABS is to press the pedal firmly and steer around the obstacle, rather than to pump the brakes.
Heat in the disc
Stopping a car turns its kinetic energy into heat. A quarter of the model car at 100 km/h carries ½ × 375 kg × (27.8 m/s)² = 145 kJ. With ABS about 130 kJ of that is made at the pads; most of the rest is lost in tyre slip. The model assumes 90% of the pad heat goes into the disc, which weighs 9 kg. Grey iron stores about 450 J per kilogram for each degree, so one stop warms the whole disc by about 29 °C.
That sounds mild, but brakes rarely get time to cool on a long mountain descent or a race track. The “Earlier stops” slider stacks up stops with no cooling at all. After 18 earlier stops the disc is near 580 °C and glows dull red; the glow starts near 525 °C, the Draper point. Real discs lose heat to the air through their vanes all the time, so this is a worst case.
A locked wheel puts very little heat into the disc, only 13 kJ in the dry stop, because the disc is no longer turning against the pads. The energy goes into the tyre and the road instead, which is what the black skid mark is made of.
Where the model is simpler than the real thing
The model treats one wheel as if it carried a fixed quarter of the car. In a real stop, weight shifts to the front wheels, so they can brake harder and the rear wheels less. Cars split braking between the axles for this reason. The tyre curves ignore speed, temperature and wear, and the ABS control rule uses fixed thresholds of 8% and 20% slip, where real units adapt to the road. The ice curve from the Burckhardt fit is flat, so ABS cannot shorten the stop on it, only keep the steering. NHTSA notes that ABS can lengthen stops on loose surfaces such as gravel or soft snow, which the model does not cover. The pad clearance is drawn about ten times larger than it really is, so you can see it close.
A short history
Frederick William Lanchester patented a caliper-type disc brake in Birmingham in 1902. Malcolm Loughead (later Lockheed) patented hydraulic brakes in 1917, and Duesenberg put them on its Model A in 1921. Disc brakes proved themselves at the 1953 24 Hours of Le Mans, which Jaguar won with disc-braked cars, and the Citroën DS began sustained mass production with them from 1955.
Following the energy through a complete stop
For the whole 1,500 kg car at 100 km/h, use the unrounded speed, 100 ÷ 3.6 m/s. The translational kinetic energy is ½ × 1,500 × (100 ÷ 3.6)² = 578,704 J, approximately 579 kJ. OpenStax defines kinetic energy in this form. This calculation excludes the energy of rotating wheels and drivetrain parts, aerodynamic drag and rolling resistance. It is an energy budget for the simplified car, not a brake certification test. Dividing by the model's equal wheel loads gives about 145 kJ per wheel, consistent with the heat calculation above.
An energy total does not say how quickly the brakes must absorb it. Spread 579 kJ over an assumed 5 s stop and the average power removed from the car is about 116 kW. The rate is much higher at the beginning than near rest if the braking force is constant, because power equals force times speed. A brake can therefore need a large short-term power capacity even though its average power over a complete drive is modest. Power capacity and the amount of heat stored in the disc answer different questions.
The model's 9 kg disc has a heat capacity of approximately 9 × 450 = 4,050 J/K. Putting the entire quarter-car energy into that disc would raise its mean temperature by about 36 °C. The displayed rise is smaller, about 29 °C, because some energy goes into tyre slip and the model assigns only 90% of pad heat to the disc. Do not apply that 90% to the entire car's energy and then put it into a single disc. That would count the other wheels' share as well. Nor is the displayed temperature the instantaneous temperature of the rubbing surface: a thin surface layer can be hotter than the disc's bulk average.
Doubling speed multiplies this energy by four, even before considering changes in tyre behaviour. Doubling mass doubles the energy. Yet in the ideal stopping-distance formula mass cancels, because twice the mass also produces twice the normal load and hence twice the assumed friction force. This is not permission to overload a car: real tyres, brake temperatures, axle loads and component limits do not scale without limit. The cancellation belongs to a model with a constant friction coefficient and adequate brake torque.
Reading slip without confusing two kinds of friction
The pad coefficient and the tyre-road coefficient appear in different parts of the calculation. The assumed pad coefficient 0.4 determines brake torque at the disc. The road curve determines how much of the requested force can actually slow the car. Making the pads grip harder cannot make the road curve higher. Once brake torque is sufficient to lock a wheel, adding more pedal force without control mainly makes the wheel reach lock sooner.
As a separate sensitivity calculation, hold pressure and geometry fixed but assume pad coefficients of 0.35 and 0.45. These are chosen comparison values, not a claim that every pad operates within that range. Relative to 0.4, they change torque to 87.5% and 112.5% of the reference value. On the wet surface both may still ask for more than the tyre can provide. A bigger torque number on the panel is therefore not automatically a shorter stop. This exhibit does not provide a pad-material control; the comparison is a calculation alongside the model.
For a car moving at 100 km/h while the tyre surface moves at 85 km/h, slip is (100 − 85) ÷ 100 = 0.15, or 15%. The wheel is still turning rapidly. Slip is not the percentage of time the tyre spends locked, and it is not the sideways angle of the tyre. The model's dry and wet peaks, at 17% and 13%, illustrate why a modest difference between road speed and wheel speed can produce strong braking. The often quoted 10 to 20% region is not a universal optimum for every tyre or surface.
The controller must also deal with a changing reference speed. During a stop the vehicle speed is falling, so a particular wheel speed can indicate safe rolling at one moment and excessive slip at another. Very close to rest, dividing by vehicle speed becomes poorly conditioned. A real controller needs low-speed logic and estimates of vehicle motion; a wheel-speed sensor does not independently measure the road speed. This is why the simple thresholds in the exhibit should not be copied into a vehicle controller.
What road tests can and cannot establish
NHTSA's report The Long-Term Effect of ABS in Passenger Cars and LTVs, published in 2009, distinguishes braking tests from crash outcomes. In its discussion of straight-line spike stops, four-wheel ABS lengthened the median stopping distance on gravel by 28%. Locked wheels pushed loose material into a wedge, but steering control was lost and the car could yaw. This result refers to those test conditions, not every gravel road or every ABS generation. It also cannot be reproduced by selecting Ice here: loose gravel and ice are physically different surfaces.
The report's statistical analysis used crash data from 1995 to 2007. It estimated a 6% reduction in overall nonfatal crash involvement for passenger cars and 8% for light trucks and vans. Those percentages describe populations in that study, not a distance reduction for an individual stop. The report found close to zero net effect on fatal crash involvement, with different crash types moving in different directions. Reporting only the favourable stopping-distance comparison would miss this distinction between a controlled mechanism test and the outcomes of drivers using vehicles in traffic.
An ABS-equipped car still needs space to stop. Steering and braking draw on the same tyre contact forces, and a sharp manoeuvre can leave less capacity for slowing down. The exhibit's lane-change result comes from its stated sideways-grip rule, not a complete tyre model or a safety guarantee. ABS is also not the same as electronic stability control: retaining wheel rotation during braking is a narrower task than correcting unwanted vehicle yaw. Nothing in these demonstrations replaces the manufacturer's driving instructions or a safe following distance.
Comparing heat storage with energy recovery on screen
A friction brake sends most of the removed mechanical energy into heat. Regenerative braking instead uses a generator driven by the wheels to send some energy back to a battery. The US Department of Energy's Alternative Fuels Data Center describes this generator-to-battery path for hybrid vehicles. Regeneration changes the destination of energy, but does not create additional tyre grip. A wheel asked for excessive braking torque can slip regardless of whether that torque comes from pads or an electric machine. The Regenerative braking panel splits a stop between the motor and the pads with model limits; the stop on the stage itself uses the friction brake alone.
For the ventilated disc shown here, the air passages provide a path for cooling between braking events. Ventilation does not make the kinetic energy disappear, and it cannot guarantee that repeated braking remains cool. Brake fade describes reduced braking performance as components become hot; a changing pad coefficient and boiling fluid are different mechanisms, with different pedal symptoms. The stop on the stage holds its pad coefficient fixed and does not simulate fluid boiling, so there a glowing disc is a temperature illustration. The Heat and brake fade panel reads the pad coefficient from one measured pad curve instead and shows the calculated loss of grip.
Try the following comparisons using the actual controls. First choose Wet, leave Pedal force and Speed unchanged, and alternate ABS on and off. Compare the wheel speed with the car speed and then read Stopping distance. Second, turn on Slow motion 1/8 and follow the pressure through build, hold and dump. A quoted valve rate such as 15 to 20 cycles per second is not a fixed specification for all ABS units; this model produces about 13 or 14 cycles per second under the conditions already described. Third, raise Earlier stops (no cooling) while keeping the road and speed unchanged. The temperature rises, but the stopping result does not acquire real fade. Finally, switch Steer one lane over on and compare the lateral movement with and without ABS. These are controlled comparisons inside the model, not exercises to attempt on a public road.
Four road surfaces and two tyre curves
The English and Korean pages add a fourth lane to the test track and a panel called Road surface and tyre curve. The new lane is compacted snow. Its curve uses the published Burckhardt coefficients for that surface, 0.195, 94.13 and 0.06, from the same table in the Aalto thesis that supplies the ice values. Its peak is low and early: μ 0.19 at only 6 % slip, and a locked tyre still keeps μ 0.14. From 100 km/h with 300 N on the pedal the model car needs 217.5 m with ABS and 290.9 m with the wheel locked.
The same panel can swap the whole family of curves for a second model, the Pacejka Magic Formula. Hans Pacejka built it as a fit to measured tyre forces, and the MathWorks documentation for its Tire-Road Interaction block lists one constant set of coefficients for each common road: dry tarmac 10, 1.9, 1 and 0.97, wet tarmac 12, 2.3, 0.82 and 1, snow 5, 2, 0.3 and 1, ice 4, 2, 0.1 and 1. The letters stand for stiffness, shape, peak and curvature, and the formula is μ = D sin(C arctan(B s − E (B s − arctan(B s)))). The peak of that curve is D itself, which the check script confirms by solving C arctan(x) = π/2.
The two models agree on the broad story and disagree on details that matter to a controller. On dry asphalt the Burckhardt fit peaks at μ 1.17 near 17 % slip and falls to 0.76 locked, while the Pacejka set peaks at 1.00 near 18 % and only falls to 0.92. With Pacejka the locked stop from 100 km/h is 43.3 m and the ABS stop 41.5 m, a much smaller gap than 50.9 m against 35.6 m. On snow the difference is larger still. The Pacejka snow curve has its peak near 31 % slip. The model ABS aims to keep slip between 8 and 20 %, so on that curve it never reaches the top and stops the car in 145.3 m while the locked wheel needs 138.1 m. That result is a property of this model's fixed thresholds meeting an unusually wide curve, but it illustrates a real point. NHTSA's long term study of ABS found that on loose gravel ABS cars needed 28 % more distance, and production systems change their strategy when they detect such surfaces.
The chart draws the curve in use as a solid line and the other model on the same road as a dashed line, with the 8 to 20 % band shaded. A dark dot shows where the tyre sits at this moment of the stop. The slip axis uses a square root scale so that the region from 2 to 20 % gets most of the width. On a dry road with ABS on, the dot circles around the peak; with ABS off it slides to the right edge and stays there.
One ABS cycle, valve by valve
Each time the stage starts a stop, the page also runs the whole stop once in the background and keeps a sample every 4 ms. The chart called One ABS stop, valve by valve plots three of those quantities against time: the car speed, the wheel speed (the rolling radius times the wheel's turning rate) and the pressure at the caliper. Under the chart a coloured strip shows the valve state chosen by the control unit. A cursor follows the live stop on the stage.
On a dry road from 100 km/h the pattern is easy to read. The pressure rises as fast as in a plain brake until the wheel speed falls far enough below the car speed for slip to pass 20 %. Then the inlet valve closes and the outlet valve opens: that is the dump state, drawn in orange, and the pressure falls in a few hundredths of a second. The wheel, freed from most of its brake torque, spins back up toward the car speed. Once slip has fallen under 20 % the control unit holds the pressure (grey) until slip drops below 8 %, then builds again in a gentler step (green). The model stop takes 2.56 s and contains 34 build, 34 hold and 34 dump phases, 13.3 cycles per second. The 3D valves carry their own tags, inlet open or shut and outlet open or shut, so the same sequence can be followed on the model.
On ice the cycle slows down. The tyre can carry only a small force, the wheel needs little brake torque to stall, and recovering from a dump takes longer because only that small tyre force spins the wheel back up. On compacted snow from 100 km/h the model cycles about 7 times a second. With ABS switched off the strip turns into one long build phase: the pressure climbs to its full value, the wheel speed drops to zero within a fraction of a second and stays there while the car slides.
Brake fade and long descents
The Heat and brake fade panel turns the disc temperature, until now an illustration, into an input for the brake itself. Each stop from speed v pours the kinetic energy of the quarter car, ½ m v², into one disc. The model gives 90 % of the pad work to the disc and uses a 9 kg grey iron disc with a heat capacity of 450 J/(kg·K), close to the 0.449 J/(g·K) that NIST-JANAF lists for iron at room temperature. One stop from 100 km/h therefore lifts the disc by 32.2 K. Between stops the disc cools toward 20 °C air with a time constant of 150 s, a model value standing for a ventilated disc on a moving car.
The pad friction then comes from a measured curve. Bellini and colleagues tested a sintered pad mix on a friction machine and published how its coefficient changed with temperature: μ 0.4 at 100 °C, rising to 0.6 at 180 °C, then falling to 0.2 at 350 °C. The model joins those three points with straight lines and keeps the end values outside them. Because the stage brake already uses μ 0.4, the panel can say what fade means at the pedal: to get the same brake torque at a given temperature the driver needs 300 N × 0.4 ÷ μ(T). Ten stops from 100 km/h, 30 s apart, leave the disc at 173 °C, where this pad is actually at its best (μ 0.58, 206 N would do). Twenty stops from 130 km/h, 20 s apart, take it to 425 °C. There the pad is down to μ 0.2 and the same stop would need 600 N, more than the 500 N that FMVSS 135 allows as the highest pedal force in its tests.
The descent mode replaces stops with a steady brake power. Holding a quarter car of 375 kg at constant speed v on a grade g asks the brake for m g v sin(arctan g). On a 10 % grade at 80 km/h that is 8.13 kW into one disc. The temperature then follows dT/dt = (P × 0.9) ÷ (m c) − (T − 20) ÷ τ, which the panel steps forward in time and the check script compares with the exact solution. After 8 km the disc is at 267 °C, close to the 291 °C it would settle at. A 7 % grade at 60 km/h over the same distance ends at 157 °C. The panel leaves out air drag, rolling resistance and engine braking, all of which would take part of the load, so the descent is a worst case for the pads. Real fade also includes effects the model does not show, such as gases from hot pad binders and boiling brake fluid.
Splitting a stop between motor and pads
In an electric or hybrid car the motor can run as a generator and slow the wheels while sending energy back to the battery. The Regenerative braking panel splits a stop at constant deceleration between that motor and the friction brake. The motor is limited in two ways, both model values: by power, 15 kW per wheel, and by force, 0.2 g. At high speed the power limit binds, because force times speed cannot exceed the power; below 73 km/h the force limit takes over. The pads supply whatever the motor cannot.
A firm stop from 100 km/h at 0.6 g leaves the motor 31 % of the energy and sends 99.8 kJ into the pads. The same stop at 0.3 g lets the motor take 62 %, and a gentle stop from 50 km/h at 0.15 g can be done by the motor alone. The chart stacks the two forces against speed, so the change from power limit to force limit shows as a bend in the green area. The panel also checks whether the current road can carry the asked deceleration. If it cannot, the wheel would lock and ABS would have to modulate it, and the model hands the whole stop to the friction brakes. Production systems handle this in their own ways; the model rule is the simplest one that keeps the ABS valves in full control. Tesla's owner's manual for the Model 3 warns that regeneration can be limited when the battery is cold and offers a setting that applies the friction brakes in its place.
EBD, ESC and the parts they share
When a car brakes, the inertia of its body pushes weight forward. With the model car's centre of mass 0.55 m above the road and a wheelbase of 2.7 m, the front axle's share of the weight grows from a static 60 % by 0.55 ÷ 2.7 of the deceleration in g. A valve that always sends 75 % of the braking to the front matches that share only at one deceleration, 0.736 g. Below it the front tyres work harder than the rear ones; above it the rear tyres are asked for more than they can carry and lock first, which makes a car unstable. On a dry road this fixed split limits the model car to 0.96 g before one axle reaches the peak of its curve, while a split that follows the load could use the full 1.17.
Electronic brakeforce distribution, EBD, uses the wheel speed sensors and valves that ABS already has to set the rear pressure as the slip of the rear wheels demands. The EBD panel draws the ideal front share against deceleration, the fixed 75 % line, and marks the region where the rear locks first. Adding 200 kg over the rear axle moves the ideal line down, because the car now has more of its weight at the back, and the fixed valve wastes even more rear grip.
Electronic stability control builds on the same hardware. FMVSS 126 defines it as a system that brakes single wheels to make a correcting yaw moment, uses a closed loop to limit oversteer and understeer, determines the yaw rate and estimates side slip, monitors the steering and can reduce engine torque. To do that it adds a yaw rate sensor and a steering angle sensor to the wheel speed sensors, valves and pump of the ABS modulator. UN Regulation 13-H and the Euro NCAP protocol test it with the sine with dwell manoeuvre: a 0.7 Hz steering sine held for 500 ms at its second peak, after which the yaw rate has to die away within set limits. NHTSA required ESC on light vehicles built from 1 September 2011, and the EU required it on new types from 1 November 2011 and on all new cars from 2014.
Where the catalogue numbers come from
The catalogue on the English and Korean pages holds 39 entries in six groups, and each one names its source. History entries come from museums, archives and the makers' own press material: Lanchester's 1902 disc brake (Coventry University archive), the Duesenberg Model A of 1921 (ASME landmark 284), the Dunlop Maxaret anti-skid and the Jensen FF (The Jensen Museum), the Le Mans winning Jaguar C-Type (Simeone Foundation), the Citroën DS (Citromuseum), the Teldix work and the 1978 S-Class option at DM 2,217.60 (Mercedes-Benz), Bosch ABS 2 and the eBike ABS (Bosch) and BMW's first motorcycle ABS of 1988 (BMW Group). Rules and tests quote the documents themselves: the eCFR text of FMVSS 135, UN Regulation 13-H, the Euro NCAP ESC protocol and EU Regulation 661/2009. Crash studies come from NHTSA reports and IIHS papers, which compare otherwise identical models with and without the feature. Racing numbers come from Brembo's technical articles, the 787 brake from Safran.
Opening an entry sets the model where that makes sense. The FMVSS 135 entry runs the dry stop from 100 km/h with 500 N, which the model car finishes in 35.6 m, half the 70 m the rule allows. The Formula 1 entry fills the heat panel with ten stops from 150 km/h, 10 s apart, enough to pass the 525 °C at which iron begins to glow. Values that the page calculates rather than quotes are worked out by the same functions the stage uses and checked by node.
Questions
Why does a locked wheel take longer to stop than a rolling one?
A rolling tyre grips with static friction in its contact patch, and with a little slip it can reach the top of its grip curve. A locked tyre slides, and sliding friction is weaker. In the model the dry μ falls from 1.17 to 0.76, and the stop from 100 km/h grows from 36 m to 51 m.
Does ABS always shorten the stopping distance?
No. On dry and wet asphalt it usually does, because it keeps the tyre near its best grip. On loose gravel or deep snow a locked wheel can build a wedge of material in front of it, and ABS may stop the car later. Its steady advantage is that the driver can still steer.
Why is the caliper piston so much bigger than the master piston?
Pressure is the same throughout the fluid, so force grows with area. The caliper piston has 5.92 times the area of the master piston, so it pushes 5.92 times harder. It also moves 5.92 times less, which is fine because the pads only need to close a tiny gap.
What is the vacuum booster for?
Without it the driver would need to push 3.5 times harder for the same stop in this model. The booster uses the pressure difference between engine vacuum and outside air to add to the driver’s effort. If the engine stops, the brakes still work, but the pedal feels much harder.
Why does the pedal shake when ABS works?
Each time the outlet valve releases fluid, the pump pushes it back toward the master cylinder. Those pulses reach the pedal. It is a sign that the system is working, and the right response is to keep pressing.
Can brake discs really glow red?
Yes, in hard use such as racing or long, steep descents without engine braking. Iron starts to glow visibly near 525 °C. Disc brakes shed heat better than drum brakes because the faces are exposed to air and, in ventilated discs, air is pumped through the vanes.
What does the slip percentage mean?
It compares how fast the tyre surface moves with how fast the car moves. At 0% the tyre is rolling freely. At 100% the wheel is locked while the car still moves. Braking grip is greatest at around 10 to 20% slip on dry and wet asphalt.
Does more pedal force always give a shorter stop?
No. Once the tyre is near its available grip, more requested torque cannot raise that grip. ABS controls pressure to avoid lock.
Does the glowing disc simulate brake fade?
The stop on the stage does not: it keeps the pad coefficient fixed. The Heat and brake fade panel does, with one tested pad's curve. Above 180 °C its μ falls, reaching 0.2 at 350 °C, and the panel shows the pedal force the same stop would then need. Boiling brake fluid is not modelled.
Would regenerative braking remove the need for ABS?
No. Generator torque still passes through the tyre-road contact. Energy recovery does not prevent excessive slip.
Why does the model ABS sometimes stop longer than a locked wheel?
Its thresholds aim at 8 to 20 % slip. The Pacejka snow and ice curves peak near 31 and 39 % slip, so the controller keeps the tyre below its best grip. On Pacejka snow from 100 km/h that gives 145.3 m with ABS against 138.1 m locked. Real systems detect such surfaces and change strategy; NHTSA measured 28 % longer stops for ABS cars on loose gravel.
How hot does a disc get on a long descent?
In the model, a 10 % grade at 80 km/h puts 8.13 kW into one front disc. After 8 km the disc reaches 267 °C and would settle near 291 °C. Air drag and engine braking, left out here, would lower both numbers.
Does regenerative braking keep working while ABS acts?
In this model it does not: when the road cannot carry the asked deceleration, regeneration is switched off and the friction brakes take the whole stop so the ABS valves control the wheel alone. Makers solve this in different ways.
What is EBD?
Electronic brakeforce distribution uses the ABS sensors and valves to set how much braking goes to the rear wheels. As weight moves forward under braking, a fixed split lets the rear wheels lock first above one deceleration (0.736 g for the model car); EBD lowers the rear pressure before that happens.
Terms
- Master cylinder: the cylinder that turns pedal force into fluid pressure.
- Vacuum booster (brake servo): a drum that uses engine vacuum to add to the pedal force.
- Caliper: the clamp that holds the pads on either side of the disc.
- Floating caliper: a caliper with pistons on one side only, whose body slides to press the other pad.
- Ventilated disc: a disc with two faces joined by vanes so that air can flow between them.
- Pascal’s principle: pressure applied to a confined liquid is transmitted equally throughout it.
- Static friction: friction between surfaces that are not sliding on each other.
- Kinetic friction: friction between surfaces that are sliding.
- Slip ratio: (car speed − tyre surface speed) ÷ car speed, while braking.
- ABS modulator: the valve block, pump and control unit that adjust brake pressure at each wheel.
- Tone ring: the toothed ring that the wheel speed sensor reads.
- Draper point: about 525 °C, the temperature at which hot solids begin to glow faintly.
- Magic Formula: Pacejka's empirical tyre formula μ = D sin(C arctan(B s − E (B s − arctan(B s)))).
- Brake fade: loss of braking effect as pads, disc or fluid get hot.
- Regenerative braking: braking with the drive motor running as a generator, which returns energy to the battery.
- EBD (electronic brakeforce distribution): setting the front and rear brake pressures from wheel slip with the ABS valves.
- ESC (electronic stability control): braking single wheels to correct a skid, using the ABS hardware plus yaw rate and steering sensors.
- Sine with dwell: the ESC test steer, a 0.7 Hz sine held for 500 ms at its second peak.
Sources
Coventry University archive, Archives Hub blog, The Frederick Lanchester archive at Coventry University (1902, Lanchester first to market disc brakes). https://blog.archiveshub.jisc.ac.uk/2018/12/03/the-frederick-lanchester-archive-at-coventry-university (checked 2026-10-17)
Simeone Foundation Automotive Museum, 1953 Jaguar C-Type (1953 Le Mans win, first use of disc brakes in the race). https://simeonemuseum.org/collection/1953-jaguar-c-type (checked 2026-10-17)
ASME, Duesenberg 4-Wheel Hydraulic Braking System, landmark 284 (Model A 1921; Loughead's earlier hydraulic brake). https://www.asme.org/about-asme/engineering-history/landmarks/284-duesenberg-4-wheel-hydraulic-braking-system (checked 2026-10-17)
Citromuseum, DS 19 1955 Chassis n°32 (the 1955 DS and its hydraulic systems, front disc brakes). https://www.citromuseum.com/en/2025/01/28/ds-19-1955-chassis-n32 (checked 2026-10-17)
HyperPhysics, Georgia State University, Auto Stopping Distance. http://hyperphysics.phy-astr.gsu.edu/hbase/crstp.html (checked 2026-10-17)
HyperPhysics, Georgia State University, Friction (static and kinetic friction, locked wheels). http://hyperphysics.phy-astr.gsu.edu/hbase/frict2.html (checked 2026-10-17)
HyperPhysics, Georgia State University, Pascal’s Principle. http://hyperphysics.phy-astr.gsu.edu/hbase/pasc.html (checked 2026-10-17)
NASA Glenn Research Center, Pascal’s Principle and Hydraulics. https://www.grc.nasa.gov/www/k-12/WindTunnel/Activities/Pascals_principle.html (checked 2026-10-17)
F. Crocetti, G. Costante, M. L. Fravolini and P. Valigi, A Data-Driven Slip Estimation Approach for Effective Braking Control under Varying Road Conditions, arXiv 2211.02558 (Burckhardt constants for dry and wet asphalt). https://arxiv.org/abs/2211.02558 (checked 2026-10-17)
Koiloth Sai Chandrresh, Real Time Tyre Road Friction Estimation Using Extended Kalman Filter, master’s thesis, Aalto University, 2026, table of published Burckhardt parameters (ice: 0.05, 306.39, 0). https://aaltodoc.aalto.fi/bitstreams/8034c2bb-1dbc-41bd-927c-fabac6861425/download (checked 2026-10-17)
NIST-JANAF Thermochemical Tables, Iron (Fe), crystal (Cp 25.09 J/(mol·K) at 298.15 K, 0.449 J/(g·K)). https://janaf.nist.gov/tables/Fe-003.html (checked 2026-10-17)
NHTSA, Kahane and Dang, The Long-Term Effect of ABS in Passenger Cars and LTVs, DOT HS 811 182 (2009) (ABS lengthens stops on gravel by 28 percent; loose surfaces such as gravel or soft snow). https://crashstats.nhtsa.dot.gov/Api/Public/ViewPublication/811182 (checked 2026-10-17)
Resonance (Indian Academy of Sciences), The Black-body Radiation Problem, May 2024 (Draper 1847, glow from about 525 °C). https://www.ias.ac.in/public/Volumes/reso/029/05/0645-0670.pdf (checked 2026-10-17)
Model values (not measured): pedal ratio 4, booster ratio 3.5, master piston 22.2 mm, caliper piston 54 mm, pad μ 0.4, pad radius 0.115 m, tyre radius 0.31 m, 1,500 kg car, 9 kg disc, 90% of pad heat into the disc, ABS thresholds 8% and 20% slip, sideways grip rule.
Calculations on this page: p = F ÷ A, F₂ = p × A₂, T = 2μF r, d = v² ÷ (2μg), μ(s) = c₁(1 − e^(−c₂s)) − c₃s, ΔT = Q ÷ (m c).
OpenStax, University Physics Volume 1, 7.2 Kinetic Energy. https://openstax.org/books/university-physics-volume-1/pages/7-2-kinetic-energy (checked 2026-10-23)
US Department of Energy, Alternative Fuels Data Center, How Do Hybrid Electric Cars Work? https://afdc.energy.gov/vehicles/how-do-hybrid-electric-cars-work (checked 2026-10-23)
Koiloth Sai Chandrresh, Aalto University master's thesis 2026, table 4 (Burckhardt coefficients for dry and wet asphalt, compacted snow 0.195, 94.13, 0.06, and ice). https://aaltodoc.aalto.fi/bitstreams/8034c2bb-1dbc-41bd-927c-fabac6861425/download (checked 2026-10-27)
MathWorks, Tire-Road Interaction (Magic Formula), Simscape Driveline documentation (typical constant coefficients: dry tarmac 10, 1.9, 1, 0.97; wet 12, 2.3, 0.82, 1; snow 5, 2, 0.3, 1; ice 4, 2, 0.1, 1). https://www.mathworks.com/help/sdl/ref/tireroadinteractionmagicformula.html (checked 2026-10-27)
C. Bellini et al., Temperature Influence on Brake Pad Friction Coefficient Modelisation, Materials 17(1):189, 2024 (μ 0.4 to 0.6 between 100 and 180 °C, 0.2 at 350 °C). https://pmc.ncbi.nlm.nih.gov/articles/PMC10779514/ (checked 2026-10-27)
eCFR, 49 CFR 571.135, Standard No. 135; Light vehicle brake systems (100 km/h, pedal force 65 to 500 N, stop within 70 m, no lockup over 0.1 s above 15 km/h). https://www.ecfr.gov/current/title-49/subtitle-B/chapter-V/part-571/subpart-B/section-571.135 (checked 2026-10-27)
eCFR, 49 CFR 571.126, Standard No. 126; Electronic stability control systems for light vehicles (definition of ESC). https://www.ecfr.gov/current/title-49/subtitle-B/chapter-V/part-571/subpart-B/section-571.126 (checked 2026-10-27)
NHTSA, C. N. Webb, Evaluation of Electronic Stability Control: FMVSS No. 126, an Update, DOT HS 813 749, 2025 (ESC standard from 1 September 2011, rollover risk 47.7 % lower). https://rosap.ntl.bts.gov/view/dot/88351 (checked 2026-10-27)
Federal Register 72 FR 41582, NHTSA, Statistical Analysis of the Effectiveness of Electronic Stability Control (ESC) Systems, Final Report, 2007 (fatal single vehicle crashes 36 % lower in cars, 63 % in LTVs). https://www.federalregister.gov/documents/2007/07/30/E7-14627/statistical-analysis-of-the-effectiveness-of-electronic-stability-control-esc-systems-final-report (checked 2026-10-27)
UNECE, Regulation No. 13-H, Revision 3, Annex 9 (sine with dwell at 0.7 Hz with a 500 ms delay). https://unece.org/fileadmin/DAM/trans/main/wp29/wp29regs/2015/R13hr3e_.pdf (checked 2026-10-27)
Euro NCAP, The Dynamic Test of Car Electronic Stability Control (ESC) Systems Protocol, version 1.2, June 2011. https://cdn.euroncap.com/cars/assets/euro_ncap_esc_testing_protocol_v12_8959452fa7.pdf (checked 2026-10-27)
EUR-Lex, Regulation (EC) No 661/2009 (ESC for new types from 1 November 2011, new vehicles from 2014). https://eur-lex.europa.eu/LexUriServ/LexUriServ.do?uri=OJ:L:2009:200:0001:0024:en:PDF (checked 2026-10-27)
Bosch, 50 years of Bosch ABS history (work from 1969, Teldix 1975, ABS 2 in 1978, eBike ABS 2018). https://www.bosch.com/stories/beginnings-of-abs/ (checked 2026-10-27)
Mercedes-Benz press release on Automotive World, World premiere in 1978 in the Mercedes-Benz S-Class: Anti-lock braking system 40 years old (Teldix 1966 and 1970, DM 2,217.60, 1981, October 1992). https://www.automotiveworld.com/news-releases/world-premiere-in-1978-in-the-mercedes-benz-s-class-anti-lock-braking-system-40-years-old/ (checked 2026-10-27)
BMW Group PressClub, The one-millionth BMW motorcycle with ABS (K 100 in 1988, DM 1,980, 31 August 2009). https://www.press.bmwgroup.com/usa/article/detail/T0040773EN_US/the-one-millionth-bmw-motorcycle-with-abs-an-innovation-becomes-established (checked 2026-10-27)
The Jensen Museum, Dunlop Maxaret Anti-Lock Braking Explained (early 1950s aircraft use, 30 % shorter stops, Jensen CV8 FF 1965). https://www.jensenmuseum.org/dunlop-maxaret (checked 2026-10-27)
IIHS, Largest study of its kind strengthens argument for motorcycle ABS, 2021 (22 % fewer fatal crashes; ABS required on large trucks since 1997). https://www.iihs.org/news/detail/largest-study-of-its-kind-strengthens-argument-for-motorcycle-abs (checked 2026-10-27)
IIHS, E. R. Teoh, Effects of antilock braking systems on motorcycle fatal crash rates: an update, 2013 (31 %). https://www.iihs.org/research-areas/bibliography/ref/2042 (checked 2026-10-27)
Brembo, Carbon for discs and brake pads in the top competitions (over 1,400 holes of 2.5 mm, over 1,000 °C, Formula E about 800 °C, Le Mans wear, carbon ceramic 5 to 6 kg lighter). https://www.brembo.com/en/news-archive/carbon-discs-and-brake-pads-in-the-top-competitions (checked 2026-10-27)
Brembo, 20 years of F1 brake discs (72 holes in 2002, 1,100 in 2016, 1,470 in 7 rows). https://www.brembo.com/en/news-archive/20-years-f1-brake-discs (checked 2026-10-27)
Brembo, How Soft Carbon Fiber Donuts Become the Brake Discs That Stop the Fastest Cars in the World (LMDh 432 holes, furnaces up to about 1,482 °C). https://www.brembo.com/en/motorsport/formula1/carbon-fibers (checked 2026-10-27)
Safran, Boeing 787 Electric Carbon Brake (up to 2,000 landings between overhauls). https://www.safran-group.com/products-services/boeing-787-dreamliner-electric-brake (checked 2026-10-27)
Tesla, Model 3 Owner's Manual (regenerative braking can be limited when the battery is too cold). https://www.tesla.com/ownersmanual/model3/en_us/Owners_Manual.pdf (checked 2026-10-27)
Model values added for the panels (not measured): disc cooling time constant 150 s, air 20 °C, motor limits 15 kW and 0.2 g per wheel, regeneration off while ABS works, static front share 60 %, centre of mass height 0.55 m, wheelbase 2.7 m, fixed front share 75 %, extra load 200 kg over the rear axle.
More exhibits
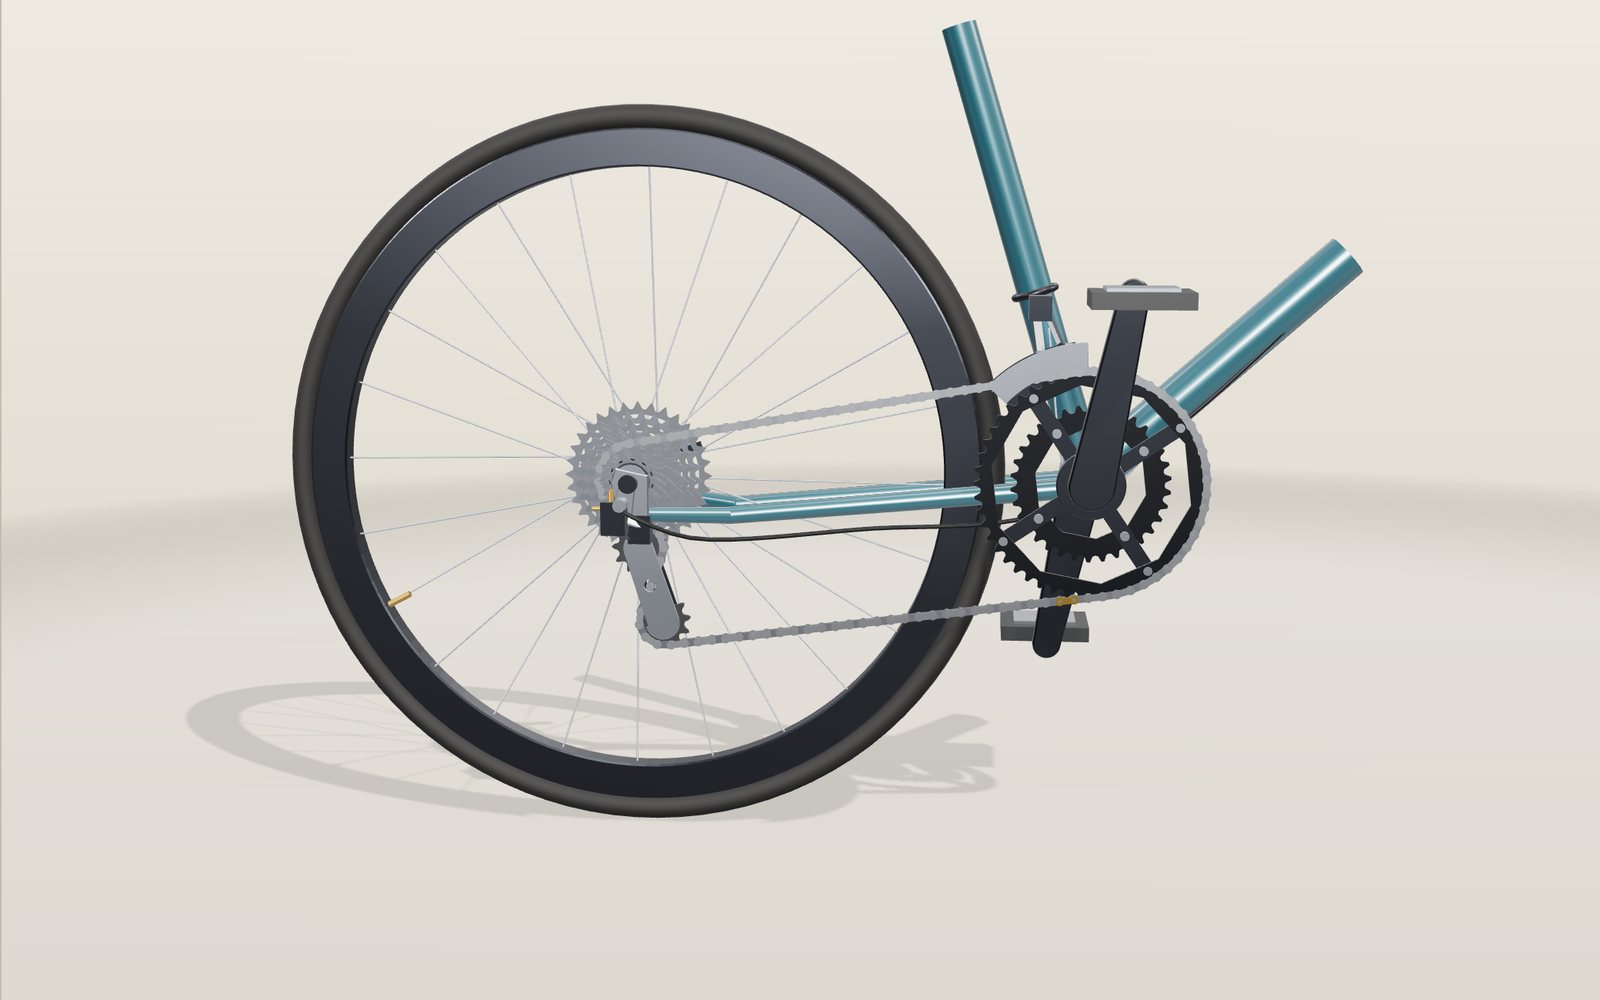
Bicycle gears: which gear makes climbing a hill easier
In a 50 by 11 gear one turn of the pedals moves a road bike 9.57 metres; in 34 by 32 it moves 2.24 metres.
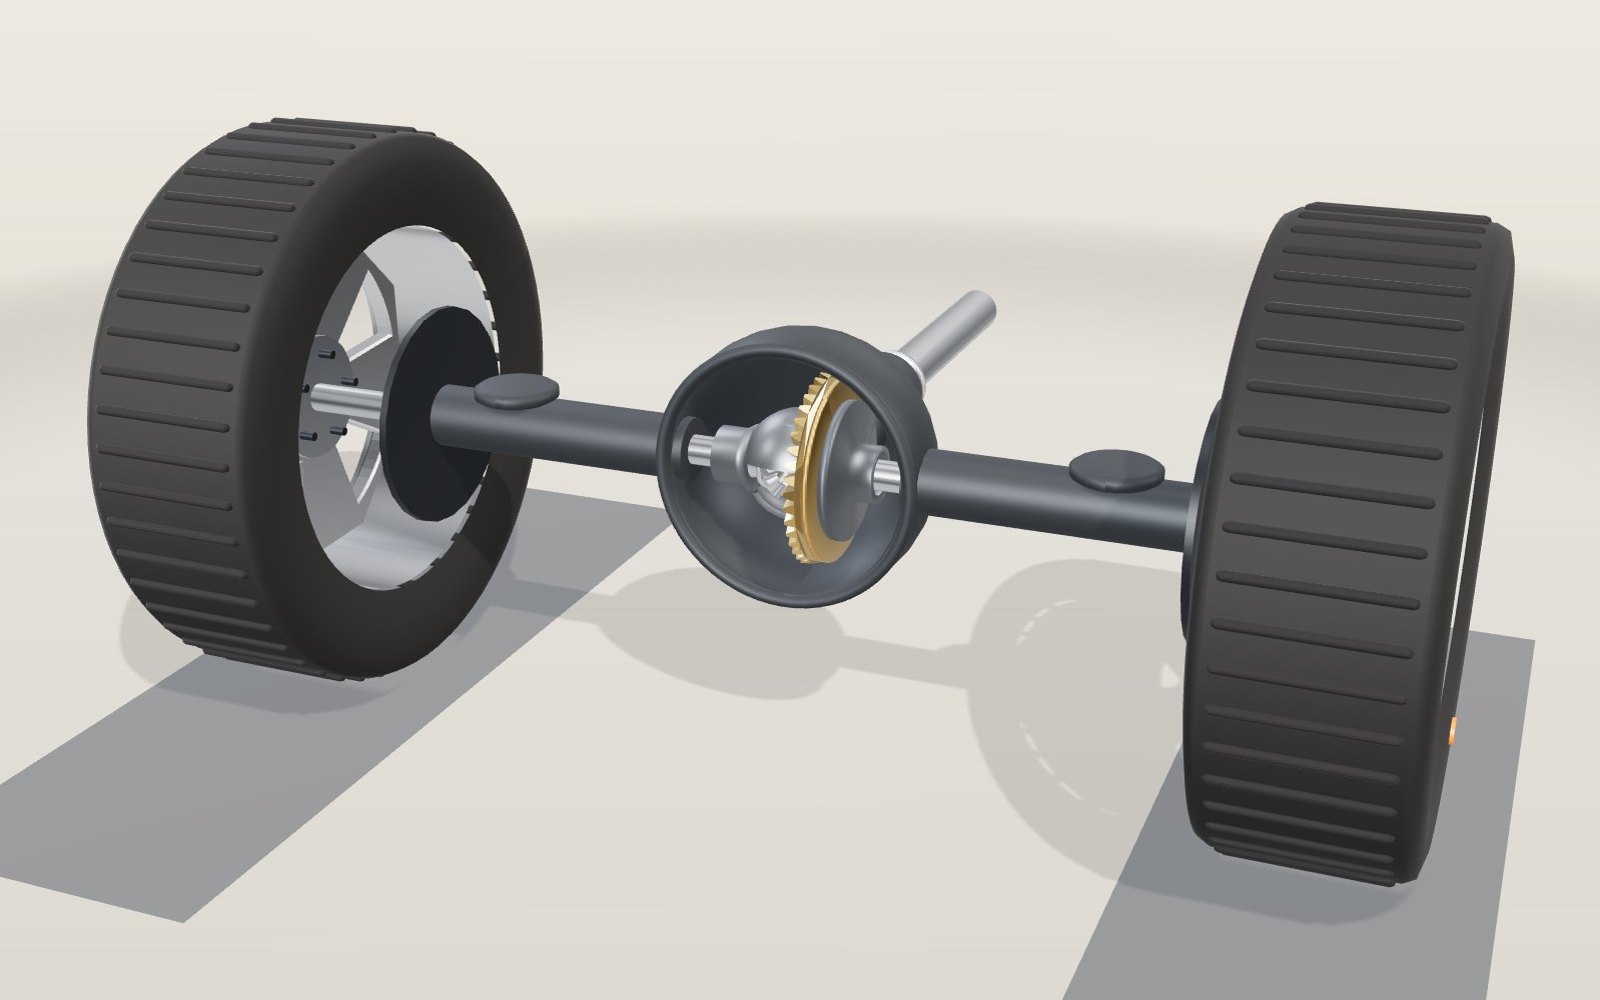
How does a differential work in a car? A 3D gear model
Round a 10 m bend at 50 km/h and the outer rear wheel turns 17% faster than the inner one, yet both are driven from the same shaft.
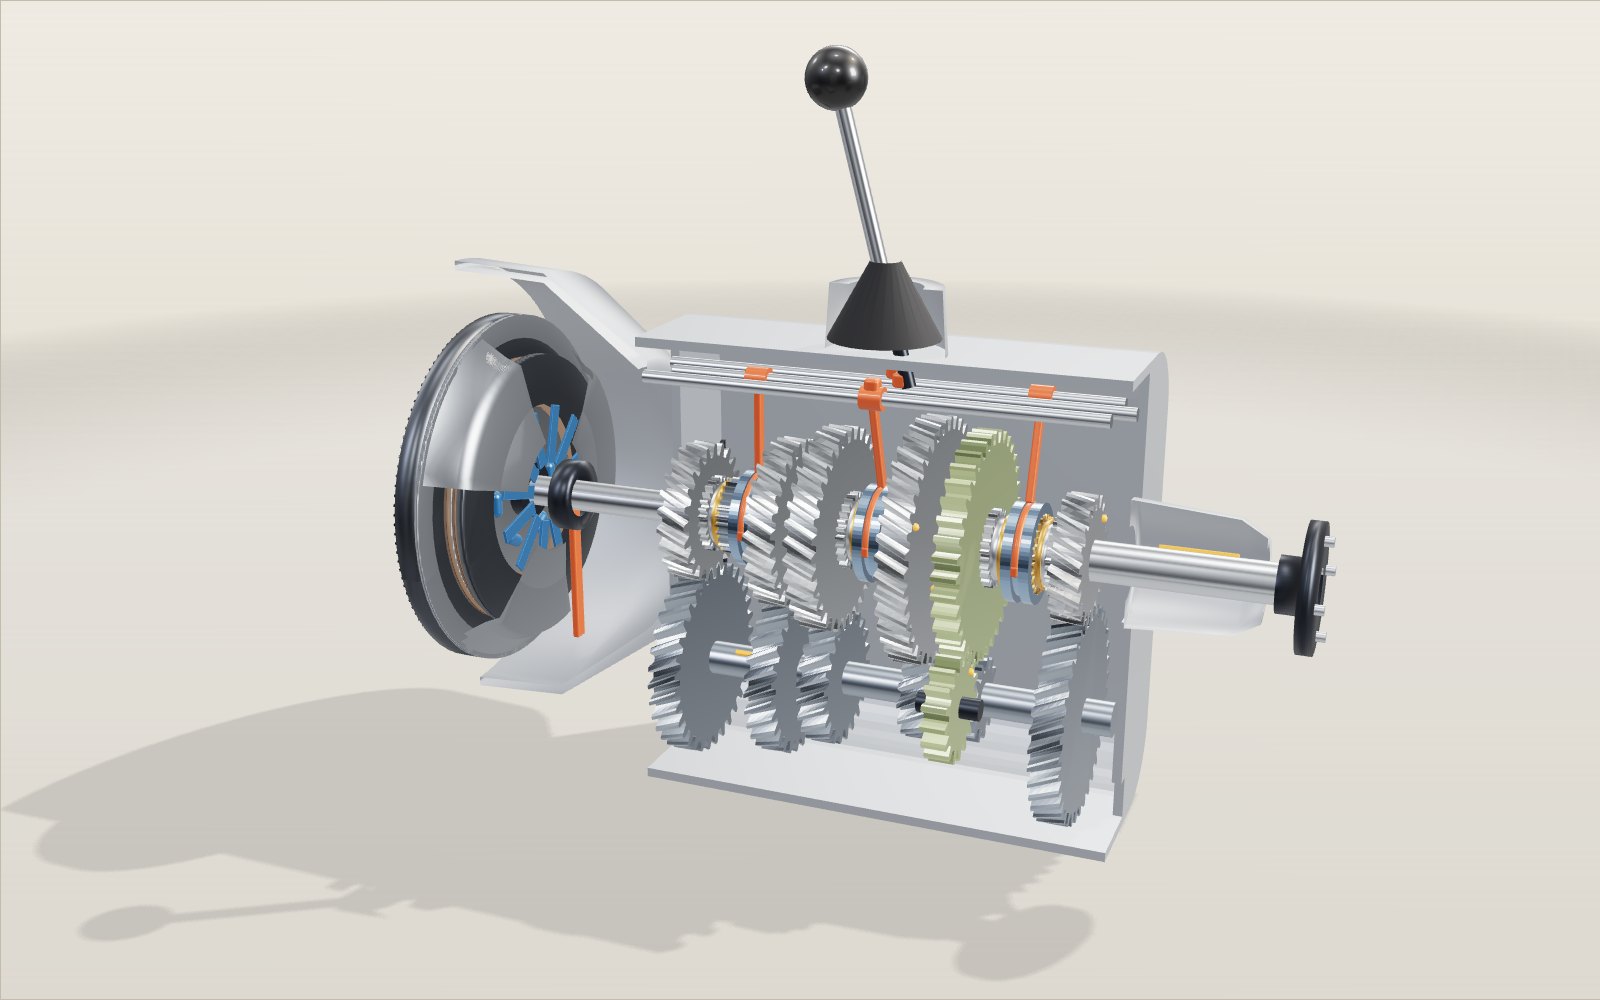
How a manual gearbox works
At 3,000 rpm the same engine moves the car at 23 km/h in first and 115 km/h in fifth, and a brass ring the size of a biscuit decides when the next gear can go in.
Roller coaster physics: how roller coasters work
A train that creeps over a 42 m lift hill at 3 m/s is doing 99 km/h at the bottom, and nothing but gravity has pushed it.
How a steam locomotive works
Mallard's driving wheels are 2.03 m across, taller than most people, and at its record 126 mph they turned almost nine times a second.
How windmills and watermills work
The sails of a Dutch mill are as wide as an eight-storey building is tall, and at 7 m/s they still take only about a fifth of the wind.