FIG. 125How It Works
Why lakes freeze from the top down: water density and lake ice
Fresh water is heaviest at 3.98 °C, so a lake cools to 4 °C top to bottom before a thin colder layer on top freezes.
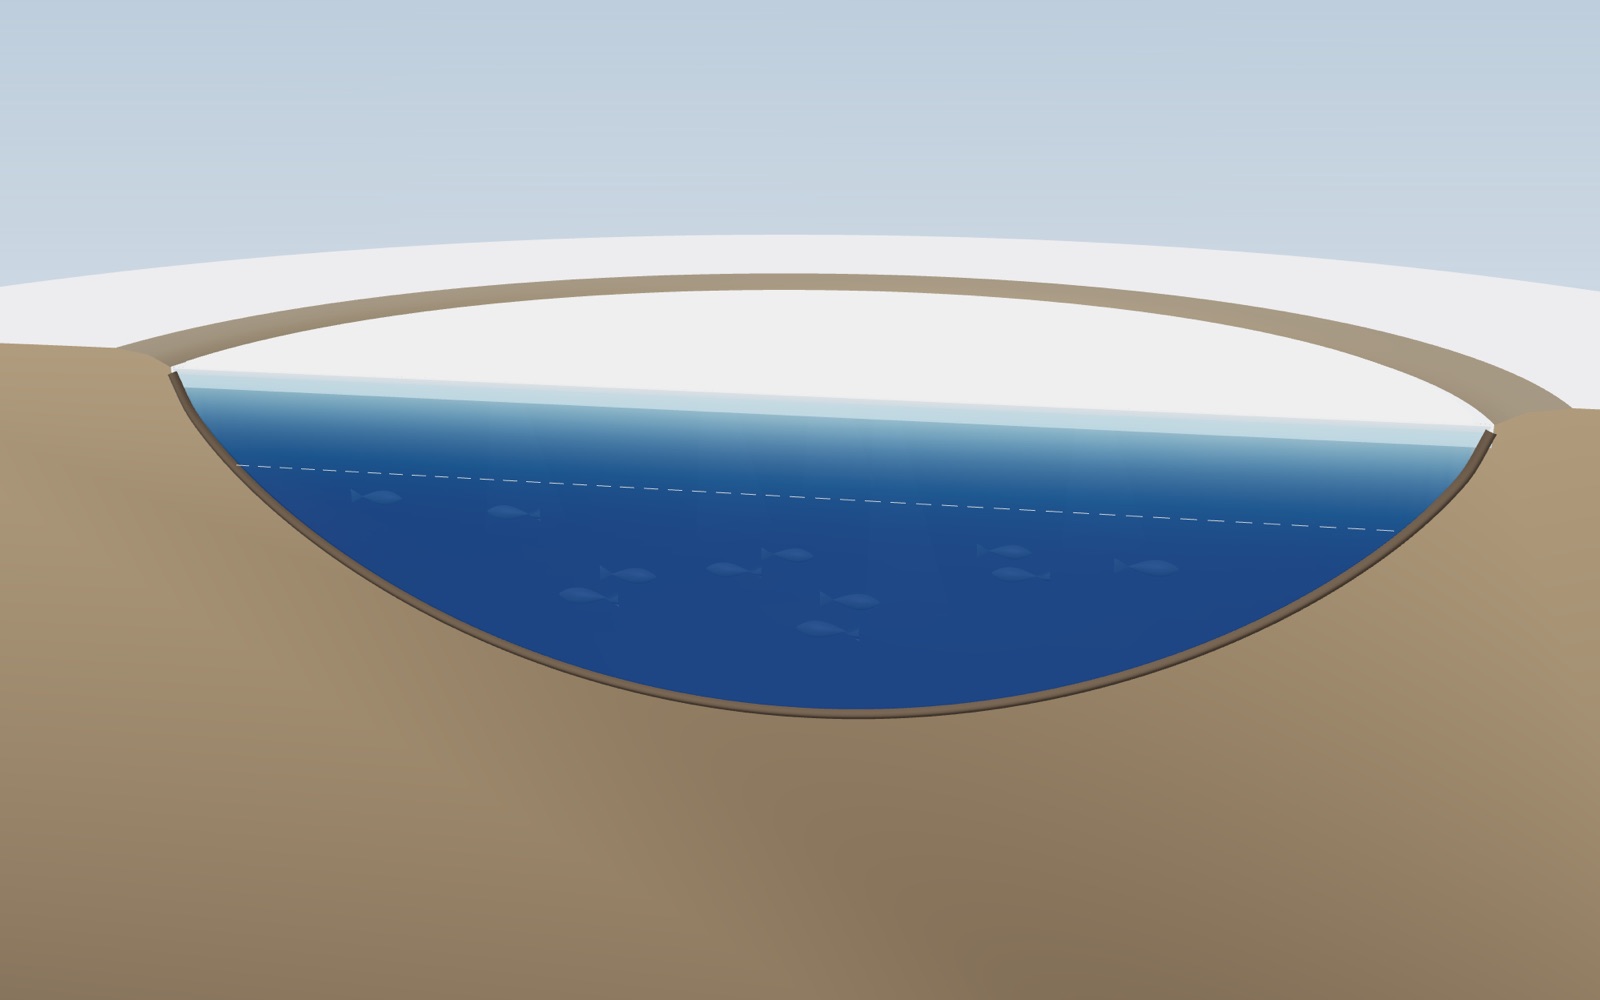
This device cannot show the 3D model. You can read the guide steps below as text.
1 / 12 Layers at the end of summerOn 1 October the top of the model lake is still warm and the deep water is cooler. Warm water is lighter, so the layers stay apart. Drag to turn the view.
Drag to turn. Scroll or pinch to zoom.
What the model shows
Why does ice float, and why do lakes freeze from the top down instead of from the bottom up? Both answers start with an odd fact about fresh water: it is heaviest at about 4 °C, not at its freezing point. This exhibit cuts a round lake in half so you can see inside it from the first cool nights of October to the spring thaw. The cut face is coloured by water temperature, and as you move the date the lake cools, mixes from top to bottom, stops mixing at 4 °C, grows a thin colder layer on top and then an ice sheet that thickens downward through the winter. The records panel lists real freeze dates measured by weather services and universities, and the safety panel copies the official ice thickness tables word for word.
The season on the stage is a model. Its air temperatures, mixing speeds and ice thickness show the order of events in a typical lake, not the state of any real lake. Never use the model thickness to judge ice you might walk on. For that, follow official ice safety guidance and local warnings; the agency tables are in the Ice safety section below.
Water is heaviest at 4 °C
Most liquids get steadily denser as they cool, right down to the point where they freeze. Fresh water does not. Cooling from room temperature, it shrinks and gets denser until about 4 °C. Below that it starts to expand again, so water at 2 °C or 0 °C is slightly lighter than water at 4 °C.
The International Committee for Weights and Measures (CIPM) recommends a formula for the density of pure, air-free water published by Masao Tanaka and colleagues in the journal Metrologia in 2001. It puts the maximum at 3.983 °C, where the density is 999.975 kg/m³. At 0 °C the same formula gives 999.843 kg/m³, at 10 °C 999.703 and at 20 °C 998.207. The differences look tiny, a fraction of a percent, but in a still lake they decide which water ends up on top.
The density chart in the Controls tab draws that curve from 0 to 20 °C. Its peak is not at the left edge, where you might expect it, but at 3.98 °C. The dot follows the surface water of the model lake as the season runs.
Searching the Tanaka formula numerically puts its peak at 3.983 °C, and water at 0 °C and at 8 °C both come out lighter than water at 4 °C.
Why does ice float?
Ice is far lighter than the water it came from. The International Association for the Properties of Water and Steam (IAPWS) gives the density of ordinary ice at 0 °C and normal air pressure as 916.72 kg/m³, against about 999.84 for liquid water at the same temperature. Ice is about 8 percent less dense, which is why roughly nine tenths of a floating piece of ice sits below the waterline and one tenth above.
The reason lies in how water molecules hold on to each other. In ice each molecule is hydrogen bonded to four neighbours in a fixed, open pattern of hexagonal rings, and that pattern leaves more empty space than the jostling arrangement of liquid water. The Crystals exhibit shows those rings at the scale of molecules. This exhibit looks at what the same fact does to a whole lake.
If ice were denser than water, as the solid form of most substances is, it would sink as it formed. Ice would pile up on the lake bed, out of reach of the summer sun, and in a cold climate a lake could fill with ice from the bottom up. Because ice floats, it forms a lid instead.
The lake at the end of summer
On 1 October, where the model season starts, the lake is still layered from the summer. The top few metres were warmed by the sun and stirred by the wind; the deep water stayed cool. Warm water is lighter, so the warm layer rides on top of the cold one like oil on vinegar, and the wind cannot mix them together. Limnologists call the warm upper layer the epilimnion and the cold bottom layer the hypolimnion, with a zone of fast temperature change, the thermocline, between them.
On the stage the warm top layer shows in yellow and green, the deeper water in teal. The red line in the temperature chart drops sharply at the depth of the thermocline.
Autumn: the lake turns over
As the nights get colder, the surface loses heat to the air. The cooled water at the top becomes heavier than the water just below it and sinks, and warmer water rises to take its place. Every cold night stirs the lake a little deeper, and the warm top layer thickens and cools at the same time.
Eventually the top layer has cooled to the same temperature as the deep water. Nothing now holds the layers apart, and the wind can mix the lake from top to bottom. This is the autumn overturn. Through it, oxygen-rich water from the surface reaches the bottom, and nutrients from the bottom reach the surface.
The overturn keeps going as long as the cooling surface water is heavier than the water below. That stays true until the whole lake is close to 4 °C, the temperature of maximum density. Move the date handle to late November in the default model winter and the cut face turns one even shade of dark blue: the lake is mixed and uniformly close to 4 °C.
Below 4 °C the cold water stays on top
Now the unusual behaviour of water takes over. When the surface cools below 4 °C, it gets lighter, not heavier. Water at 3, 2 or 1 °C floats on the 4 °C water beneath it and stops sinking. The deep lake keeps its 4 °C, and the cold is trapped in a thin layer at the top.
Scientists call this inverse stratification: the layering is upside down compared with summer, with colder water above warmer water. It is stable only because of the density maximum. In the exhibit the dashed white line on the cut face marks where the water reaches about 4 °C (3.9 °C in the model). Above it the water is colder and lighter; below it the water sits close to the densest temperature.
Because only the thin top layer needs to reach 0 °C, the lake can freeze long before its deep water gets anywhere near freezing. That is the short answer to why lakes freeze from the top down.
The first ice
On a cold, calm night the top layer reaches 0 °C and ice crystals form at the surface. Wind can delay this by stirring the top layer down into the warmer water below, so many lakes first freeze on a still night after a cold spell. A lake may freeze over, open up in a warm spell and freeze again several times before the ice stays.
Lake observers have to decide what counts as frozen. On Lake Mendota in Madison, Wisconsin, the State Climatology Office's rule of thumb includes whether a person could still row a boat between Picnic Point and Maple Bluff. On the Han River in Seoul, the Korea Meteorological Administration (KMA) declares the river frozen when a band about 100 m upstream of the second and fourth piers of Hangang Bridge is fully covered by ice and no water can be seen. The KMA points out that this definition says nothing about how thick the ice is.
Ice grows from the underside
Once there is a lid of ice, the lake can only freeze further at the underside of that lid. Water there loses heat upward through the ice into the cold air, and as it freezes it releases latent heat that also has to leave the same way. The thicker the ice, the longer that path, and the slower the next centimetre grows.
The physicist Josef Stefan worked out the mathematics of this problem in the 1880s. In its simplest form the result says that ice thickness grows with the square root of the cold it has been exposed to. Engineers use a modified form of the Stefan equation:
thickness = α × √(accumulated freezing degree-days)
A freezing degree-day is one day with the average air temperature one degree below freezing (0 °C). A day averaging −5 °C adds 5 degree-days; a week at −5 °C adds 35. The sum since the ice formed is the accumulated freezing degree-days (AFDD).
The coefficient α captures everything the simple theory leaves out: wind, snow, sunshine and the water's own heat. The U.S. Army Corps of Engineers Ice Engineering manual (EM 1110-2-1612) gives typical values in its Table 2-2, after the work of Bernard Michel in 1971, with thickness in centimetres and degree-days in °C:
- windy lake with no snow: 2.7
- average lake with snow: 1.7 to 2.4
- average river with snow: 1.4 to 1.7
- sheltered small river: 0.7 to 1.4
The manual gives the same table for inches and °F degree-days: 0.80, 0.50 to 0.70, 0.40 to 0.50 and 0.20 to 0.40. The two columns describe the same law. Converting one into the other (multiplying by 2.54 × √1.8, about 3.41) gives 2.73, 1.70 to 2.39, 1.36 to 1.70 and 0.68 to 1.36, matching the printed values to rounding.
What the square root means
The square root makes ice growth fast at first and slow later. On a windy lake with α = 2.7:
- 25 degree-days (five days at −5 °C) give about 13.5 cm of ice in the formula;
- 100 degree-days give 27 cm;
- 400 degree-days give 54 cm.
Four times the cold gives only twice the ice. A U.S. Army Engineer Research and Development Center technical note gives a worked example in inches: with a coefficient of 0.6, 300 °F degree-days predict ice about 10 inches thick.
On the stage, the ice grows from the day the lake freezes, using the middle of the chosen α range. The readout shows the model thickness and the degree-days it is based on. Try the condition control: with the average-lake-with-snow row, the same winter grows noticeably less ice than on a windy, snow-free lake.
These are estimates for engineering planning, not measurements. Real ice thickness varies across a single lake, and the manual itself warns that snow, currents and other factors change the result. That is one more reason the model value cannot tell anyone whether real ice is safe.
Snow, clear ice and white ice
Snow on top of lake ice works like a blanket. Fresh snow traps a lot of air and conducts heat poorly, so the heat from the water below escapes more slowly and the ice grows more slowly. That is why the Corps of Engineers table gives lower α values for lakes and rivers with snow.
Snow also changes the ice itself. The Ice Engineering manual describes snow ice: when the weight of snow presses the ice sheet down, water floods up through cracks and soaks the lower part of the snow, which then freezes into granular, opaque, white ice with small, randomly oriented crystals. Ice that grows from the water below, by contrast, is clear and dark, with long crystals.
The difference matters for strength. The Minnesota Department of Natural Resources says that white ice formed when snow melts and refreezes on top of lake ice is only about half as strong as new, clear ice, and advises doubling its thickness guidelines on white ice. The Canadian Centre for Occupational Health and Safety (CCOHS) describes solid, clear blue ice as generally the strongest type and white opaque ice, with its high air content, as not strong.
On the stage, picking a condition with snow adds a snow cover and a white layer on top of the clear ice. The share of white ice is a picture; the agencies give no single figure for it.
Life under the ice
A frozen lake is not a dead lake. The 4 °C water under the ice is cold but liquid, and fish, insects, plankton and bacteria live through the winter in it. Many fish slow down and stay in the deeper water, where it is slightly warmer than just under the ice.
For a long time winter was the least studied season in lake science, simply because it is hard to work on ice. In 2017 Stephanie Hampton and dozens of co-authors gathered winter measurements from more than a hundred lakes in the journal Ecology Letters, under the title Ecology under lake ice. They found that life under ice is often far from dormant, and that the amount of snow on the ice, by controlling how much light gets through, is one of the main things that shape it.
Light matters because algae and water plants need it to make oxygen. Clear ice lets a good share of sunlight through. Snow on top blocks most of it. Under thick snow, photosynthesis slows, while bacteria breaking down dead plants on the lake bed keep using oxygen. In a long winter with heavy snow, shallow and plant-rich lakes can run low on oxygen and fish can die: anglers and fisheries agencies call this winterkill.
The light and oxygen bars on the stage show the direction of these effects only. They are not measurements and carry no units.
Why don't lakes freeze solid?
For a lake to freeze to the bottom, the ice would have to reach the full depth of the water. Three things work against that.
First, the density maximum keeps the deep water at about 4 °C all winter, insulated under the cold top layer and the ice.
Second, ice and snow insulate. Because thickness grows with the square root of the cold, each extra centimetre takes longer than the one before. On a windy lake with α = 2.7, a metre of ice would need about 1,370 degree-days, about three months at an average of −15 °C.
Third, the water also receives heat from below. The lake bed stores heat from the summer and gives some of it back through the winter.
Shallow ponds and the edges of lakes can freeze to the bottom in very cold climates, and this is where fish cannot survive. Deep lakes, even in places with long, hard winters, keep liquid water under the ice.
Sea water is different
Salt changes both numbers that make a lake freeze from the top. The National Snow and Ice Data Center (NSIDC) explains that ocean water must reach about −1.8 °C to freeze, lower than fresh water. More important, salt water keeps getting denser as it cools all the way down to its freezing point. There is no density maximum to stop the cooled surface water from sinking.
So in the sea, cooled surface water keeps sinking and is replaced by warmer water from below. NSIDC notes that, generally, the top 100 to 150 metres of the ocean must cool to the freezing point before sea ice forms. That takes much longer than cooling the thin top layer of a lake.
When sea ice does form, it starts as small needle-like crystals called frazil, 3 to 4 millimetres across, which expel their salt into the water. In calm water the crystals collect into a thin, oily-looking layer called grease ice, which thickens into a sheet called nilas. Some of the salt gets trapped as brine in pockets between the crystals.
Switch on Sea water in the exhibit and the cut face stays one colour all the way down while the whole column cools toward −1.8 °C. In the model the same winter freezes weeks later than the lake, or not at all if it is mild. The sea mode borrows the lake's ice growth law once ice forms; real sea ice grows differently, so treat its thickness as a picture.
Real records: the Han River
The KMA has watched the Han River freeze at the same spot since 1906, at what was then the Noryangjin ferry crossing and is now Hangang Bridge in Seoul. Its press releases print the full table of first freeze and last thaw dates.
Some entries from that table:
- The earliest freeze was on 4 December 1934, in the winter of 1934.
- The latest was on 13 February 1964, in the winter of 1963.
- In the winter of 2024 the river froze on 9 February 2025, the second latest on record and 30 days later than normal.
- In the winter of 2025 it froze on 3 January 2026, seven days earlier than normal and 37 days earlier than the year before.
- The normal dates are a freeze on 10 January and a last thaw on 28 January.
- The river did not freeze at all in nine winters: 1960, 1971, 1972, 1978, 1988, 1991, 2006, 2019 and 2021.
The KMA also looked at the five days before each freeze from 2019 to 2023 and found that the river tended to freeze after five or more days with daily minimum temperatures of −10 °C or lower and daily maximum temperatures below zero.
A river is not a still lake. Flowing water mixes, so a river cools as a whole and needs a longer cold spell to freeze. The Han freeze date reflects both the weather and the river itself, and the KMA's definition is about surface cover, not thickness.
Real records: Madison's lakes
The Wisconsin State Climatology Office keeps ice-over and ice-out dates for three lakes in Madison: Mendota, Monona and Wingra. The Mendota table goes back to the winter of 1852 to 1853. The office says the records are based on observations by various people, including those at the University of Wisconsin's Washburn Observatory.
From the office's summary:
- Lake Mendota froze earliest on 23 November 1880 and latest on 30 January 1932.
- Its longest ice season was 161 days, in 1880 to 1881, from 23 November to 3 May.
- Its shortest was 21 days, in 2001 to 2002, in two spells: 2 to 12 January and 4 to 15 March.
- Its earliest ice-out was 27 February 1998; the latest, 6 May 1857.
- In 2023 to 2024 Mendota had only 44 days of ice, from 15 January to 28 February, the second shortest season on record.
- The median Mendota season runs from 20 December to 4 April, 102 days.
- Lake Wingra, smaller and shallower, froze as early as 2 November 1913 and had a 164-day season in 1880 to 1881.
Smaller and shallower lakes freeze earlier: Wingra's median freeze date is 29 November, Monona's 15 December and Mendota's 20 December. A small lake holds less heat and cools faster.
Real records: the Great Lakes
The Great Lakes are too large to freeze over in a normal winter. NOAA's Great Lakes Environmental Research Laboratory (GLERL) has tracked ice cover since 1973 from charts made by the Canadian Ice Service and the U.S. National Ice Center, and publishes the annual maximum ice cover (AMIC) for each lake and for all five together.
- The highest maximum for the whole system was 94.7 percent on 19 February 1979.
- In 2014 it reached 92.3 percent on 6 March.
- The lowest was 11.8 percent, on 4 March 2002.
- In 2024 the maximum was only 16.0 percent, on 22 January.
- In 2026 it reached 58.3 percent on 9 February.
Lake Erie, the shallowest, often freezes almost completely: its maximum reached 100 percent on 12 February 1979. Lake Superior, the deepest, reached 100 percent on 8 March 1996. Lake Ontario, deep and in a milder spot, had a maximum of only 1.9 percent in 2012.
Depth again explains much of the pattern. A deep lake stores a great deal of summer heat and has to cool its whole volume to 4 °C before the top can freeze.
Lake ice and a changing climate
Long records of lake ice are some of the oldest climate records there are, because people noticed when lakes froze long before thermometers were common. At a Shinto shrine on Lake Suwa in Japan, the dates of a ridge of ice that forms across the lake have been written down since the 15th century. In 2016 Sapna Sharma and colleagues compared those records with spring breakup dates of the Torne River in Finland and Sweden, kept since the 17th century, in the journal Scientific Reports. Both showed later freezing or earlier breakup, with changes speeding up after the start of the industrial era.
In 2000 John Magnuson and colleagues analysed lake and river ice records around the Northern Hemisphere from 1846 to 1995 in the journal Science. On average, freeze dates came 5.8 days later and breakup dates 6.5 days earlier per hundred years.
In 2019 Sharma and colleagues estimated, in Nature Climate Change, that thousands of Northern Hemisphere lakes already have winters without full ice cover and that the number would grow with further warming. The Han River's nine winters without a freeze, five of them since 1988, and Lake Mendota's two shortest seasons, both since 2001, fit that picture. Single winters still vary a lot: 2026 brought an early Han freeze.
Ice safety
The thickness on this stage is a model value. It is not a measurement and cannot tell anyone whether real ice will hold them. Ice is seldom the same thickness across a single body of water; the Minnesota DNR notes it can be two feet (about 60 cm) thick in one place and one inch (2.5 cm) thick a few yards away. Always follow the official guidance where you are, check the ice yourself with the proper tools, and stay off when in doubt.
The tables below are copied from the agencies as published.
Minnesota DNR, general ice thickness guidelines, for new, clear ice only:
| Ice thickness | Activity |
|---|---|
| Under 4 inches | Stay off |
| 4 inches | Ice fishing or other activities on foot |
| 5 to 7 inches | Snowmobile or small ATV |
| 7 to 8 inches | Side-by-side ATV |
| 9 to 10 inches | Small car or SUV |
| 11 to 12 inches | Medium SUV or small truck |
| 13 inches | Medium truck |
| 16 to 17 inches | Heavy-duty truck |
| 20 inches and more | Heavy-duty truck with wheelhouse shelter |
The DNR adds that white ice is only about half as strong as new, clear ice, so the guidelines should be doubled on white ice, and that the DNR does not measure ice thickness on Minnesota lakes.
Canadian Red Cross, minimum ice thickness:
| Ice thickness | Activity |
|---|---|
| 15 cm | Skating, walking or skiing in small groups |
| 20 cm | Larger groups, such as skating parties |
| 25 cm | Snowmobiles or ATVs |
Health Canada gives 15 cm for skating alone and 20 cm for groups, and advises staying off storm water management ponds.
In Korea the National Disaster and Safety Portal of the Ministry of the Interior and Safety says that ice generally needs to be at least 10 cm thick to hold a few people (one or two) who are not gathered together, depending on how it froze, and that you should never go onto ice in the freezing season (December to early January) or the thawing season (mid February to early March). It also notes that ice gets thinner toward the middle of a river.
None of these tables apply to the model on this stage. They are here so that the numbers you might act on come from the agencies, not from a simulation.
Spring: the ice goes out
In spring longer days and warmer air thin the ice from above and below. Sunlight gets into the ice and weakens it between the crystals, so spring ice can look thick and still be rotten. Eventually wind breaks up the weakened sheet and it melts away; the date the lake is clear is the ice-out date.
The water at the top then warms. When it passes 4 °C it is heavier than the colder water near the surface, and the lake mixes top to bottom again: the spring overturn. After that the sun warms the surface faster than the wind can mix it down, and the summer layers return. A lake that mixes twice a year like this is called dimictic.
The spring melt on the stage uses a model rate of 1.5 cm of ice for each degree-day above 0 °C. It is chosen for the picture, not taken from a table. The Stefan equation describes growth, not melting, and in spring the sun does much of the work.
What the model simplifies
- The air temperature follows a smooth curve with the coldest day on 27 January. Real winters have cold snaps and thaws.
- The lake is round, 20 m deep at the centre, and the water follows the air with a delay that grows with the depth of the mixed layer. These are model choices.
- The thin cold layer under the ice is drawn with a fixed shape, and the deep water stays near 4 °C. Real lakes can cool below 4 °C in windy autumns before the ice forms.
- Ice grows with the modified Stefan equation from the day of freezing. Snow depth, slush and white ice are not computed.
- Spring melting uses a fixed model rate, 1.5 cm per degree-day above freezing (0 °C).
- Light and oxygen are pictures, not values.
- In sea water mode the water column cools as one, and the ice uses the lake formula.
- Depth is drawn about seven times taller than the width, and the ice thicker than to scale, so the layers can be seen.
Questions
Why does ice float?
Ice is about 8 percent less dense than liquid water: 916.7 kg/m³ against 999.8 kg/m³ at 0 °C. In ice each water molecule is bonded to four neighbours in an open hexagonal pattern that takes up more space than liquid water. The Crystals exhibit shows that structure.
Why do lakes freeze from the top down?
Fresh water is densest at about 4 °C. In autumn the lake mixes until it is near 4 °C throughout; after that, water cooled further is lighter and stays at the top. Only that thin top layer has to reach 0 °C, so ice forms on the surface first and then grows downward.
Why don't lakes freeze solid?
The deep water stays near 4 °C under a lid of colder water and ice, and the ice itself slows further freezing because heat must pass through it. Thickness grows only with the square root of the cold, and the lake bed gives back some summer heat. Only shallow ponds freeze to the bottom.
How thick does ice need to be to walk on?
Follow your local authority. The Minnesota DNR says to stay off new, clear ice under 4 inches and gives 4 inches for activities on foot; the Canadian Red Cross gives a minimum of 15 cm for skating, walking or skiing in small groups; Korea's National Disaster and Safety Portal says ice generally needs at least 10 cm for one or two people who are not gathered together. On white ice the DNR doubles its own table; the other agencies do not give a rule for white ice. The model on this page cannot tell you whether any real ice is safe.
How thick does ice need to be to drive on?
Follow your local authority. The Minnesota DNR's guidelines for new, clear ice give 5 to 7 inches for a snowmobile or small ATV, 7 to 8 inches for a side-by-side ATV, 9 to 10 inches for a small car or SUV and 11 to 12 inches for a medium SUV or small truck, and say to double them on white ice. The Canadian Red Cross table on this page goes up to 25 cm for snowmobiles or ATVs. Do not use the model's thickness to judge real ice.
How cold does it have to be for a lake to freeze?
The surface water has to reach 0 °C, and before it can, the whole lake has to cool to about 4 °C, because until then cooled surface water sinks and is replaced from below. A deep lake therefore needs a longer cold spell than a shallow pond, and one day below freezing is seldom enough. For the Han River in Seoul, the KMA found that from 2019 to 2023 the river tended to freeze after five or more days with daily minimum temperatures of −10 °C or lower and daily maximums below zero. Sea water freezes later, at about −1.8 °C.
How long does it take a lake to freeze?
It happens in two stages. First the lake loses its summer heat through the autumn overturn, which takes weeks. Then the first ice can form in a single cold, calm night, and it may melt and refreeze several times before it stays. After that, thickness grows with the square root of the accumulated cold: on a windy lake with no snow (α = 2.7), five days at −5 °C give about 13.5 cm in the formula, and snow on the ice slows it. These are engineering estimates, not measurements, and real ice varies across a lake.
How fast does lake ice grow?
The modified Stefan equation estimates thickness as α times the square root of the accumulated freezing degree-days. With α = 2.7 (windy lake, no snow), 100 °C degree-days give about 27 cm. Snow lowers α to 1.7 to 2.4 on an average lake. Real ice varies from place to place.
What is the autumn overturn?
As the surface cools in autumn, it becomes heavier and sinks, mixing the lake deeper and deeper. When the top reaches the temperature of the bottom water, the whole lake mixes top to bottom. It brings oxygen down and nutrients up.
What is the difference between clear ice and white ice?
Clear ice grows from the water below and has long crystals; white ice forms when slush or wet snow freezes on top and is full of air bubbles. The Minnesota DNR says white ice is only about half as strong as new clear ice.
Why does the sea freeze later than lakes?
Sea water freezes at about −1.8 °C and, unlike fresh water, keeps getting denser all the way to its freezing point. Cooled surface water keeps sinking, so NSIDC says the top 100 to 150 m must cool before sea ice forms.
How do fish survive under the ice?
The water under the ice stays liquid at 0 to 4 °C. Most fish slow down and stay in the deeper water. In shallow lakes with heavy snow on the ice, light and oxygen can run low late in winter, and fish can die (winterkill).
When does the Han River freeze?
The KMA's normal first freeze date for the Han River at Hangang Bridge is 10 January. The earliest on record was 4 December 1934 and the latest 13 February 1964. The river did not freeze at all in nine winters, most recently 2021.
Does salt make ice melt?
Salt lowers the freezing point of water. That is why sea water freezes at about −1.8 °C, and why salted roads stay wet at temperatures where pure water would freeze.
Do all lakes turn over twice a year?
No. Lakes that freeze in winter and stratify in summer, like the model lake, usually mix twice, in autumn and spring. Warm lakes that never cool to 4 °C, and very deep or very shallow lakes, follow other patterns.
Terms
- Density maximum: the temperature at which fresh water is densest, 3.98 °C.
- Autumn overturn: the mixing of a lake from top to bottom when the surface cools to the temperature of the deep water.
- Inverse stratification: winter layering with colder, lighter water above water near 4 °C.
- Freezing degree-day: one day with the average air temperature one degree below 0 °C; added up to give the accumulated freezing degree-days (AFDD).
- Stefan equation: the relationship in which ice thickness grows with the square root of the accumulated cold.
- White ice (snow ice): opaque, bubbly ice formed when slush or wet snow freezes on top of the ice.
- Ice-out: the date a lake's ice has gone.
- Annual maximum ice cover (AMIC): the largest share of a lake's surface covered by ice in a season, as measured by GLERL.
- Frazil: small needle-like ice crystals that form first in turbulent or salty water.
- Winterkill: fish deaths caused by low oxygen under long-lasting snow and ice.
Sources
- M. Tanaka, G. Girard, R. Davis, A. Peuto, N. Bignell, Recommended table for the density of water between 0 °C and 40 °C based on recent experimental reports, Metrologia 38 (4), 301 to 309 (2001). https://doi.org/10.1088/0026-1394/38/4/3 (checked 2026-10-29)
- International Association for the Properties of Water and Steam, Revised Release on the Equation of State 2006 for H2O Ice Ih (R10-06). https://www.iapws.org/relguide/Ice-2009.html (checked 2026-10-29)
- U.S. Army Corps of Engineers, Engineering and Design: Ice Engineering, EM 1110-2-1612 (2002, with changes to 2006), Table 2-2. https://www.publications.usace.army.mil/Portals/76/Publications/EngineerManuals/EM_1110-2-1612.pdf (checked 2026-10-29)
- U.S. Army Engineer Research and Development Center, Cold Regions Research and Engineering Laboratory, technical note on estimating river ice thickness from freezing degree-days. https://erdc-library.erdc.dren.mil/server/api/core/bitstreams/81b728f8-711f-4ef8-e053-411ac80adeb3/content (checked 2026-10-29)
- Korea Meteorological Administration (Seoul Metropolitan Regional Office), press release 한파 속 이번 겨울 한강 첫 결빙, 3 January 2026, with the table of first freeze and last thaw dates since 1906. https://www.kma.go.kr/kma/news/press.jsp?bid=press&mode=view&num=1194585 (checked 2026-10-29)
- Korea Meteorological Administration, press release 한파 속 이번 겨울 한강 첫 결빙, 9 February 2025. https://www.weather.go.kr/kma/news/press.jsp?mode=view&num=1194461 (checked 2026-10-29)
- Korea Meteorological Administration, press release 한파 속 2023년 겨울 한강 첫 결빙, 26 January 2024 (five-day temperatures before each freeze, 2019 to 2023). https://www.kma.go.kr/kma/news/press.jsp?mode=view&num=1194326 (checked 2026-10-29)
- Wisconsin State Climatology Office, Madison Lake Ice. https://climatology.nelson.wisc.edu/first-order-station-climate-data/madison-climate/lake-ice/ (checked 2026-10-29)
- Wisconsin State Climatology Office, Madison Lake Ice Summary. https://climatology.nelson.wisc.edu/first-order-station-climate-data/madison-climate/lake-ice/madison-lake-ice-summary/ (checked 2026-10-29)
- Wisconsin State Climatology Office, History of Ice Freezing and Thawing on Lake Mendota. https://climatology.nelson.wisc.edu/first-order-station-climate-data/madison-climate/lake-ice/history-of-ice-freezing-and-thawing-on-lake-mendota/ (checked 2026-10-29)
- NOAA Great Lakes Environmental Research Laboratory, Ice Cover and the annual maximum ice cover tables. https://www.glerl.noaa.gov/data/ice/ and https://www.glerl.noaa.gov/data/ice/glicd/dates_AMIC.txt (checked 2026-10-29)
- Minnesota Department of Natural Resources, General ice thickness guidelines. https://www.dnr.state.mn.us/safety/ice/thickness.html (checked 2026-10-29)
- Canadian Red Cross (Manitoba), Health and safety tips on and around ice (PDF). https://cdn.redcross.ca/prodmedia/crc/documents/Where-We-Work/Canada/Manitoba/safety-tips-on-and-around-ice-2014.pdf (checked 2026-10-29)
- Canadian Centre for Occupational Health and Safety, Working on or near Ice Covered Water. https://www.ccohs.ca/oshanswers/hsprograms/work_ice.html (checked 2026-10-29)
- Health Canada, Winter sports and recreation safety. https://www.canada.ca/en/health-canada/services/injury-prevention/winter-sports-recreation-safety.html (checked 2026-10-29)
- Ministry of the Interior and Safety, National Disaster and Safety Portal, 장소별 행동요령: 얼음(물). https://old.safekorea.go.kr/idsiSFK/neo/sfk/cs/contents/prevent/SDIJK13928.html?cd1=28&cd2=999&pagecd=SDIJK139.28&menuSeq=128 (checked 2026-10-29)
- National Snow and Ice Data Center, The science of sea ice. https://nsidc.org/learn/parts-cryosphere/sea-ice/science-sea-ice (checked 2026-10-29)
- S. E. Hampton et al., Ecology under lake ice, Ecology Letters 20 (1), 98 to 111 (2017). https://doi.org/10.1111/ele.12699
- S. Sharma, J. J. Magnuson, R. D. Batt, L. A. Winslow, J. Korhonen, Y. Aono, Direct observations of ice seasonality reveal changes in climate over the past 320 to 570 years, Scientific Reports 6, 25061 (2016). https://doi.org/10.1038/srep25061 (checked 2026-10-29)
- J. J. Magnuson et al., Historical trends in lake and river ice cover in the Northern Hemisphere, Science 289 (5485), 1743 to 1746 (2000). https://doi.org/10.1126/science.289.5485.1743
- S. Sharma et al., Widespread loss of lake ice around the Northern Hemisphere in a warming world, Nature Climate Change 9, 227 to 231 (2019). https://doi.org/10.1038/s41558-018-0393-5 (checked 2026-10-29)
- B. Michel, Winter Regime of Rivers and Lakes, U.S. Army Cold Regions Research and Engineering Laboratory, Monograph III-B1a (1971).
Text and simulation: CC BY-NC-SA 4.0, except where noted.
More exhibits
Coral bleaching causes: why warmer water turns reefs white
Corals get most of their food from algae living in their tissue, and when the sea stays more than 1 °C above its usual summer high for weeks, they lose those algae and turn white.
Tides simulator: move the Moon and Sun, watch high tide
The Moon raises the sea on the side of the Earth facing it, so why is there a second high tide on the side facing away?
Swim to the bottom of the Mariana Trench in a 3D ocean
By 20 m down, almost all the red in sunlight has gone, and the Challenger Deep is another 10,900 m below that.

Snowflake growth simulator: grow your own crystal
A snow crystal grown at −15 °C sprouts six branching arms, while one grown at −5 °C becomes a needle 2 mm long.
Giants of the sea: megalodon and the blue whale
Swim beside 48 sea giants at their real size, from a 28 m blue whale to megalodon, Livyatan and Mosasaurus, in eight seas from today back to the Triassic.
Why do ships float?
A 1,900-tonne steel ship floats, yet the same 1,900 tonnes of steel pressed into a cube goes straight to the bottom.