FIG. 77How It Works
Heart beating: interactive model of the heart, step by step
Your heart pushes out about 70 mL of blood with each beat, and at a resting pace it does that about 108,000 times a day.
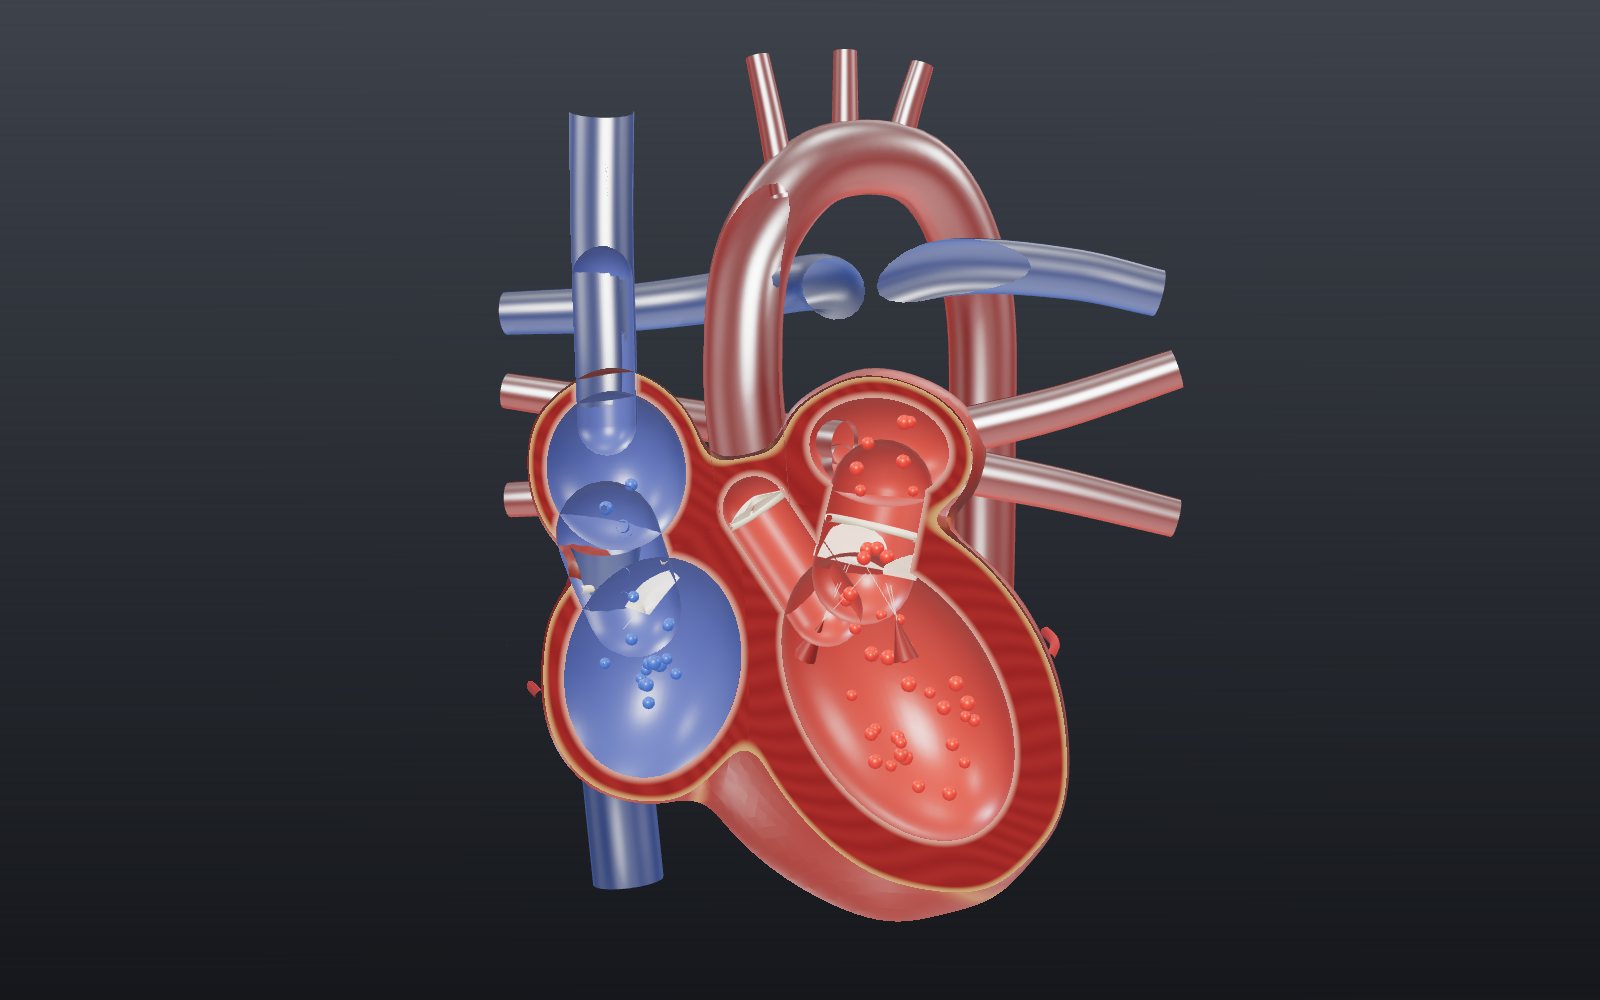
This device cannot show the 3D model. You can read the guide steps below as text.
1 / 8 A fist-sized pumpA typical adult heart is about 12 cm long and weighs 250 to 350 g. It beats here at 75 times a minute, and every beat the chambers shrink as they empty and swell as they refill.
Drag to turn. Scroll or pinch to zoom.
Put two fingers on your wrist
Press lightly on the inside of your wrist, below the thumb, and you can feel a small push about once a second. Each push is a wave of pressure from one contraction of your heart, which has just squeezed about 70 mL of blood into your arteries. At a resting pace of 75 beats a minute that happens about 108,000 times a day, and it never stops for more than a fraction of a second.
This exhibit takes the heart apart in the order the beat itself runs. First the plumbing: four chambers, four valves and the big vessels that join them. Then the electrical signal that sets each beat off, and the ECG trace that records it. Last, the arithmetic that turns beats into litres per minute.
This exhibit explains how a healthy heart works in general. It is not medical advice. If something about your heart or your pulse worries you, talk to a doctor.
Two pumps that share one beat
A typical adult heart is about 12 cm long, 8 cm wide and 6 cm thick, roughly the size of a fist. It weighs about 250 to 300 g in women and 300 to 350 g in men. It sits between the lungs, behind the breastbone, with its broad base at the top and the pointed apex tipped toward the left.
Inside, a wall of muscle divides it into a right half and a left half, and each half is a two-stage pump. The upper chamber, the atrium, is a thin-walled receiving room. The lower chamber, the ventricle, does the real pumping.
The right side handles blood that has been around the body and given up much of its oxygen. It arrives in the right atrium through the two venae cavae, the superior one from the head and arms and the inferior one from everything below. The right ventricle then pushes it up the pulmonary trunk to the lungs. That trip is short and the lungs are delicate, so little pressure is needed.
The left side takes blood back from the lungs, now carrying fresh oxygen. Four pulmonary veins deliver it to the left atrium, and the left ventricle sends it up the aorta to the whole body. Pushing blood through every organ needs far more pressure, and that is why the wall of the left ventricle is much thicker than the right. Switch on Cut in half and you can compare them: the thick ring of muscle around the red cavity on the right of the screen is the left ventricle's wall.
Both sides beat at the same moment and move the same volume each time. If the right ventricle sent even slightly more per beat than the left, blood would gradually pile up in the lungs.
Why the model uses blue and red
Textbooks colour the right side blue and the left side red, and the model does the same, but blood is never blue. Haemoglobin carrying a full load of oxygen is bright red. When it releases some of that oxygen in the tissues it turns a darker red. Veins can look bluish through the skin, but the blood inside them is dark red.
So in the model, blue means "oxygen-poor" and red means "oxygen-rich". The names of the vessels follow direction, not colour. Arteries carry blood away from the heart and veins carry it back. That is why the pulmonary arteries are drawn blue, since they are the only arteries after birth that carry oxygen-poor blood, and the pulmonary veins are drawn red.
Four valves that only open one way
A pump with no valves would just slosh blood back and forth. The heart has four, and each one opens only in the direction of flow.
Between each atrium and its ventricle sits an atrioventricular valve: the tricuspid valve on the right with three flaps, the mitral valve on the left with two. Their flaps are tied by thin cords, the chordae tendineae, to small papillary muscles on the ventricle wall. When the ventricle squeezes, blood tries to rush back into the atrium and slaps the flaps shut. The cords hold the edges so the flaps cannot blow inside out, a little like the guy ropes on a tent. In the section view, slow motion lets you watch the flaps swing down into the ventricle while it fills and snap up when it starts to contract.
At each exit there is a semilunar valve: the pulmonary valve at the start of the pulmonary trunk and the aortic valve at the start of the aorta. Each has three cup-shaped cusps. While the ventricle is pushing they lie back against the wall. When the push ends and blood starts to fall back, it fills the cusps like pockets and they meet in the middle.
The closing of the valves is what you hear through a stethoscope. The first heart sound, S1 or "lub", is the tricuspid and mitral valves shutting as the ventricles begin to contract. The second, S2 or "dub", is the pulmonary and aortic valves shutting as the ventricles relax. Switch on Valve sounds and the model plays a soft thump at each moment. It is a synthesised sound timed by the model, not a recording.
There is a short gap after S1 when every valve is shut. The ventricles are already squeezing, but the pressure inside is not yet higher than in the arteries, so nothing moves. The same thing happens in reverse just after S2, while the ventricles relax. These two moments, called isovolumic contraction and isovolumic relaxation, are named in the readout.
Where each beat starts
Heart muscle does not wait for a nerve to tell it to contract. A small patch of specialised cells in the wall of the right atrium, near where the superior vena cava enters, slowly lets positive charge leak in until it reaches a threshold and fires. This patch is the sinoatrial or SA node, and left to itself it would fire about 100 times a minute. Nerves from the brain mostly act as a brake, which is why a resting heart beats more slowly than that.
Other parts of the conduction system can also set a rhythm, but each is slower than the one before it. Without the SA node, the AV node would keep the heart going at 40 to 60 beats a minute. The bundle of His would manage 30 to 40, and the Purkinje fibres only 15 to 20. The fastest cell sets the pace, and in a healthy heart that is the SA node.
Switch on Electrical signal and Slow motion to follow it. A pulse leaves the SA node and spreads across both atria, which glow yellow as each part is triggered. The signal reaches the AV node about 50 ms after it starts. A separate band, Bachmann's bundle, carries it straight across to the left atrium. The atria start to contract about 25 ms after the signal begins to spread, and their squeeze lasts about 100 ms.
Why the signal waits at the AV node
Between the atria and the ventricles lies a ring of tough connective tissue that does not conduct electricity. The only way through is the atrioventricular or AV node, at the bottom of the right atrium. Its cells are small and pass the signal on slowly, so it takes about 100 ms to cross. In the model you can see the AV node flicker while it holds the signal.
The delay matters. It gives the atria time to finish pushing their last share of blood into the ventricles before the ventricles start to contract. At rest, 70 to 80 percent of the ventricle fills on its own while the AV valves are open. The atrial squeeze, sometimes called the atrial kick, adds the remaining 20 to 30 percent.
After the pause, the signal moves fast. It runs down the bundle of His into the wall between the ventricles, splits into a left and a right bundle branch and reaches the apex in about 25 ms. From the apex the Purkinje fibres carry it up the inside of the ventricle walls, and all the ventricular muscle has been triggered about 75 ms later. Because the signal starts at the apex, the squeeze also starts there and moves toward the valves at the top, a bit like squeezing a tube of toothpaste from the closed end.
Reading the ECG against the model
An electrocardiogram records the tiny voltages that this wave of electrical activity makes on the skin. The trace in the readout is drawn from the same timing as the model, so each bump lines up with something you can see on the heart.
- The small P wave is the atria being triggered.
- The flat stretch after it is the pause in the AV node. The time from the start of P to the start of QRS, the PR interval, is normally 120 to 200 ms. In the model it is 175 ms at 75 beats a minute.
- The tall, narrow QRS complex is the ventricles being triggered. It normally lasts under 120 ms, usually 60 to 100. The atria reset during this time, and their signal is hidden under the QRS.
- The rounded T wave is the ventricles resetting, ready for the next beat.
The marks S1 and S2 under the trace show the heart sounds. S1 comes just after the R peak, when the ventricles start to squeeze. S2 comes as the T wave fades. Try Slow motion with Electrical signal on and watch the yellow glow, the trace and the valves together.
The time from the start of QRS to the end of T, the QT interval, gets shorter as the heart speeds up. At 75 beats a minute the model's QT is 362 ms, inside the usual range of under 400 to 440 ms.
Working out cardiac output
Cardiac output is the volume each ventricle pumps in a minute:
cardiac output = heart rate × stroke volume
Stroke volume is what one ventricle ejects in a single beat, the difference between how full it is at the end of filling (end-diastolic volume) and what is left at the end of the squeeze (end-systolic volume). In the model the ventricle keeps 55 mL after each beat, so with a stroke volume of 70 mL it holds 125 mL when full.
At rest: 75 beats × 70 mL = 5,250 mL, or 5.25 L a minute. The normal resting range is about 4 to 8 L a minute. The fraction ejected each beat, 70 out of 125 mL, is 56 percent, inside the usual range of 55 to 70 percent. Over a day, 5.25 L a minute comes to about 7,560 L from each ventricle.
In hard exercise a healthy young adult's heart rate may reach about 150, and the stroke volume can rise to about 130 mL because each contraction is stronger. Set both sliders to the top and the readout shows 150 × 130 mL = 19.5 L a minute.
There is a limit to how far a faster rate helps. The model shortens each part of the beat as the rate rises, but not equally. Going from 75 to 150 beats a minute, ventricular systole shrinks from 270 to 191 ms, while the time from S2 to the next contraction falls from 530 to 209 ms. The relaxed phase loses most, and that is the time the ventricles have to fill. In real hearts stroke volume starts to drop at high rates for this reason. Cardiac output rises up to about 120 beats a minute, stays about level between 120 and 160, and falls above that.
The textbook numbers can look different from the model's at first. OpenStax splits a 0.8 s beat into about 100 ms of atrial systole, 270 ms of ventricular systole and 430 ms of ventricular diastole. The model's 530 ms of relaxation includes the 100 ms atrial squeeze, which happens while the ventricles are still relaxed.
Twenty situations to try
The bar along the bottom of the model holds twenty situations. Each one sets the heart rate, the stroke volume and the place where the beat starts, and the line under the bar says where the numbers come from. They fall into three groups.
The first group stays inside the normal resting ranges and shows how the two factors trade off. A heart beating 60 times a minute with 67 mL a beat puts out about 4.0 L a minute, the bottom of the normal resting range. One beating 100 times with 80 mL a beat reaches 8.0 L, the top of it. The same 5 L or so can come from a slow heart with a big stroke or a fast heart with a small one.
The second group comes from the names doctors give to resting rates. Above 100 beats a minute at rest is tachycardia, and below 60 is bradycardia. Most people still have no symptoms above about 50, and some trained endurance athletes rest at 30 to 40. OpenStax quotes 28 a minute for the cyclist Miguel Indurain. These sources give only a rate, so the model keeps the stroke volume at 70 mL, marked with an asterisk below. A trained athlete's heart can be considerably larger than average, so for the athlete the real output is not as low as the model shows.
The third group switches off the top of the conduction system one step at a time. With the SA node blocked, the AV node takes over at 40 to 60 beats a minute. Turn on Electrical signal and you will see the SA node stay dark and the P wave disappear from the ECG, because the atria are no longer triggered first from the top. Below the AV node the rates fall to 30 to 40 for the bundle of His, 20 to 30 for the bundle branches and 15 to 20 for the Purkinje fibres. At those rates the output drops below 2 L a minute, and a heart that slow cannot keep the body supplied for long.
| Situation | Beats a minute | Stroke volume, mL | Output, L/min |
|---|---|---|---|
| Resting adult (average) | 75 | 70 | 5.25 |
| Resting, low end of normal | 60 | 70 | 4.20 |
| Resting, high end of normal | 100 | 70 | 7.00 |
| Stroke volume, low end of normal | 75 | 55 | 4.12 |
| Stroke volume, high end of normal | 75 | 100 | 7.50 |
| Resting output, low end | 60 | 67 | 4.02 |
| Resting output, high end | 100 | 80 | 8.00 |
| Hard exercise, healthy young adult | 150 | 130 | 19.50 |
| Start of the exercise target zone | 120 | 70* | 8.40 |
| SA node with no nerve signals | 100 | 70* | 7.00 |
| SA node, low end of its own range | 80 | 70* | 5.60 |
| Tachycardia (above 100 at rest) | 110 | 70* | 7.70 |
| Bradycardia (below 60 at rest) | 55 | 70* | 3.85 |
| Most people still without symptoms | 50 | 70* | 3.50 |
| Trained endurance athlete at rest | 40 | 70* | 2.80 |
| Lowest rate quoted (Miguel Indurain) | 28 | 70* | 1.96 |
| AV node sets the pace | 50 | 70* | 3.50 |
| Bundle of His sets the pace | 35 | 70* | 2.45 |
| Bundle branches set the pace | 25 | 70* | 1.75 |
| Purkinje fibres set the pace | 18 | 70* | 1.26 |
* The source gives only the heart rate; the stroke volume stays at 70 mL.
A worked example with round numbers
The model starts at 75 beats a minute and 70 mL a beat. Round numbers are easier to follow, so set Heart rate to 70 and Stroke volume to 70 and check the arithmetic against the readout.
- Per minute: 70 beats × 70 mL = 4,900 mL, or 4.9 L. This is the cardiac output the readout shows.
- Per hour: 4.9 L × 60 = 294 L.
- Per day: 4.9 L × 1,440 minutes = 7,056 L from each ventricle, in 70 × 1,440 = 100,800 beats.
- Per year: 100,800 × 365 is about 36.8 million beats.
- Over 80 years: about 2.9 billion beats and about 206 million L (7,056 × 365 × 80 = 206,035,200), ignoring leap days.
These are averages built on one assumption, a steady 70 a minute. Sleep, effort and mood all move the real rate, so the figures say what the order of magnitude is, not what your own heart did.
A product does not say how it was reached. 98 beats × 50 mL and 49 beats × 100 mL are also 4.9 L a minute. Try both: the output stays the same, but the first heart pumps in quick small pulses and the second in slow large ones.
In hard exercise the same arithmetic gives 150 beats × 130 mL = 19,500 mL, or 19.5 L a minute, about four times the resting 4.9 L. Neither factor has to double to get there. The rate rises a little over twofold and the stroke volume nearly twofold, and the two increases multiply.
What the blood pressure numbers mean
The model draws flow, not pressure, but pressure is what each beat produces, and the two numbers on a cuff come straight from the cycle you can watch. A reading such as 120/80 is read "120 over 80". The first number, the systolic pressure, is the highest pressure in the large arteries, reached while the ventricles are pushing blood out. The second, the diastolic pressure, is the lowest, just before the next beat, while the ventricles relax and the aortic valve is shut.
The unit, mm Hg, is millimetres of mercury: the pressure that holds up a column of mercury that many millimetres high. One mm Hg is about 133 pascals, so 120 mm Hg is about 16 kPa. The difference between the two numbers is the pulse pressure, 120 − 80 = 40 mm Hg here. An average pressure over the whole beat, the mean arterial pressure, can be approximated as the diastolic pressure plus one third of the pulse pressure: 80 + 40 ÷ 3, or about 93 mm Hg.
Pressure depends on two things together: how much blood the heart sends each minute and how strongly the vessels resist it. That is why the left ventricle, which faces the resistance of the whole body, has the thick wall.
| Category (NHLBI, United States) | Systolic, mm Hg | Diastolic, mm Hg | |
|---|---|---|---|
| Normal | below 120 | and | below 80 |
| Elevated | 120 to 129 | and | below 80 |
| High blood pressure, stage 1 | 130 to 139 | or | 80 to 89 |
| High blood pressure, stage 2 | 140 or higher | or | 90 or higher |
| Hypertensive crisis | above 180 | or | above 120 |
Guidelines do not all draw the lines in the same place. The Korean Society of Hypertension, in its 2022 guideline, puts hypertension at 140/90 mm Hg or higher measured in the clinic and calls 130 to 139 over 80 to 89 prehypertension. The same reading can therefore carry two different names in two countries. A diagnosis rests on repeated measurements, not on one number, and deciding what a number means for a particular person is for a doctor.
From ECG paper squares to beats per minute
An ECG is usually printed on a grid and run at 25 mm a second. One small square, 1 mm wide, then stands for 0.04 s (40 ms), and one large square, 5 mm or five small ones, for 0.2 s (200 ms). Five large squares make one second.
With that grid the model's trace becomes easy to measure. At 75 beats a minute the time from one R peak to the next is 60 ÷ 75 = 0.8 s, which is 800 ms, 20 small squares or 4 large ones. For a regular rhythm, the rate is 300 divided by the number of large squares between two R peaks: 300 ÷ 4 = 75. At 100 beats a minute there are 3 large squares, and at 60 there are 5.
The intervals fit the same grid. The model's PR interval of 175 ms is about 4.4 small squares, inside the usual 120 to 200 ms, which is 3 to 5 small squares. A normal QRS is under 120 ms, less than 3 small squares. The model's QT of 362 ms at 75 beats a minute is about 9 small squares. These conversions describe real paper. The model draws its trace on its own scale, so use the milliseconds in the readout, not a ruler held to the screen.
The order in which the wave travels is the order the trace is drawn: SA node, both atria (the P wave), the AV node (the flat PR stretch), the bundle of His and its branches, the apex, then the Purkinje fibres up the ventricle walls (the QRS). Turn on Electrical signal and Slow motion and follow it from the node to the last glowing patch of muscle.
Heart disease in numbers, and chest compressions
The World Health Organization lists cardiovascular diseases as the leading cause of death worldwide. It estimates 19.8 million deaths from them in 2022, about 32% of all deaths, and 85% of those were due to heart attack and stroke.
Statistics Korea reported 352,511 deaths in Korea in 2023. Cancer ranked first at 166.7 deaths per 100,000 people, and heart disease ranked second at 64.8, ahead of pneumonia at 57.5. Cerebrovascular disease, which is counted separately in the Korean ranking and which WHO includes in its cardiovascular total, added another 47.3. When two sources give different totals, check what each one counts.
Two terms are often mixed up. In a heart attack, blood flow to part of the heart muscle is blocked, so that part is short of oxygen. In cardiac arrest, the heart suddenly stops pumping because of an electrical fault, which is the conduction system in this exhibit going wrong. The National Heart, Lung, and Blood Institute notes that a heart attack can lead to cardiac arrest, but they are not the same thing.
When the heart has stopped, chest compressions do the pumping from outside until emergency help arrives. MedlinePlus and the American Red Cross both give the pace for adults as 100 to 120 compressions a minute, pressing about 2 inches (5 cm) deep and letting the chest rise fully between presses. Set Heart rate to 110 and switch on Valve sounds to hear that tempo, one beat about every 0.55 s. This is not a CPR lesson. MedlinePlus is clear that reading about CPR is not the same as hands-on training, and an accredited course is the way to learn it. In an emergency, call the local emergency number first (119 in Korea, 911 in the United States).
Common mix-ups
- "The heart is on the left." It sits in the middle of the chest between the lungs. Only the apex tips toward the left, and that is where the beat is easiest to feel.
- "A slow resting heart means a weak heart." Output is rate × stroke volume. A trained athlete with a rate of 40 can still move a useful amount of blood if each beat is larger than 70 mL, which is why the athlete situation in the model carries an asterisk.
- "Blood pressure and heart rate are the same thing." Rate counts beats a minute. Pressure is the force of the blood on the artery wall. A fast heart can have a low pressure and a slow one a high pressure.
- "The ECG shows how well the heart pumps." The trace shows when the muscle is triggered. It has no number for stroke volume, so it cannot give cardiac output on its own.
Try it on the screen
- Set Heart rate to 70 and Stroke volume to 70. Compare the cardiac output in the readout with the 4.9 L a minute worked out above.
- Try 98 beats with 50 mL, then 49 beats with 100 mL. The output stays at 4.9 L a minute while the look of the beat changes.
- Set both sliders to the top, 150 and 130, and read 19.5 L a minute.
- Switch on Electrical signal and Slow motion. Watch the AV node hold the signal while the ECG stays flat between the P wave and the QRS.
- Pick the 50 and 100 beat rates one after the other and count the large squares between R peaks: 6 and 3.
- Set Heart rate to 110 with Valve sounds on and tap along. It is the pace compressions are taught at.
What the model leaves out
- The layout is flattened. In a real chest the right ventricle sits in front of the left, the left atrium sits at the back, and the pulmonary trunk crosses in front of the aorta. The model keeps the chambers closer to one plane so that one cut can show all four chambers, the AV valves and the aortic valve. The pulmonary valve still lies in front of the cut; use See inside to find it.
- Colours are a convention. Blue and red stand for oxygen-poor and oxygen-rich blood. Real blood is dark red or bright red.
- The shapes are smooth. Real ventricles are lined with muscular ridges, the right ventricle wraps around the left like a crescent, and the walls thicken as they contract. The model shrinks each chamber evenly around its centre.
- The ECG is a drawn curve. It is built from smooth bumps placed at textbook intervals, as one lead would show it. It is not a recording, and real traces vary from person to person.
- The timing is stretched by a rule. The QT interval is adjusted for rate with the Fridericia formula, and the mechanical phases with a square-root rule. Both are approximations.
- The conduction paths are simplified. The three internodal paths, Bachmann's bundle and the Purkinje network are drawn as a few lines. The real Purkinje network is a dense mesh under the inner lining of the ventricles.
- Escape rhythms keep a normal QRS. When a lower part of the conduction system sets the pace, real QRS complexes can look different and the atria may be triggered from below. The model only drops the P wave, lights the system from that point down and keeps the rest of the beat the same.
- The sounds are synthesised. They mark the moments when the valves close but do not reproduce what a stethoscope picks up.
A short history
The parts of the conduction system were found one at a time. In 1839 Jan Evangelista Purkinje described a net of gelatinous fibres under the inner lining of the heart, without knowing what it was for. In 1893 Wilhelm His Jr. found a bundle of muscle crossing from the atria to the ventricles. In 1906 Sunao Tawara, working in Ludwig Aschoff's laboratory in Marburg, described the AV node and showed that it continues through the bundle and its branches to Purkinje's fibres.
That summer a medical student, Martin Flack, was looking at slices of a mole's heart for Arthur Keith at a rented cottage in Kent. He found a small structure where the superior vena cava meets the right atrium. Keith and Flack published it in 1907 as the place where the heart's rhythm begins: the SA node.
In 1902 Willem Einthoven recorded the heart's electrical activity from the surface of the body with an instrument of his own design. He received the Nobel Prize in Physiology or Medicine in 1924 for discovering the mechanism of the electrocardiogram.
Questions
Why is the left ventricle's wall so much thicker than the right?
Both ventricles pump the same volume, but the left one has to push it through every artery in the body, which resists flow far more than the short loop through the lungs. More pressure needs more muscle.
Why does my heart beat faster when I exercise?
Working muscles need more oxygen. Signals from the nervous system and hormones such as adrenaline speed up the SA node and make each contraction stronger, so both the heart rate and the stroke volume rise. In the model you can watch the cardiac output climb as you move both sliders.
What makes the lub-dub sound?
Valves closing. "Lub" is the tricuspid and mitral valves shutting at the start of each contraction, and "dub" is the pulmonary and aortic valves shutting at its end. The blood flowing through open valves is almost silent in a healthy heart.
Is the blood in my veins blue?
No. Blood low in oxygen is dark red, and blood rich in oxygen is bright red. Veins can look blue through the skin, but that is not the colour of the blood. The blue in the model, as in most diagrams, is only a colour code.
What happens if the SA node stops working?
The next part of the conduction system takes over at its own slower rate. The AV node alone keeps the heart beating at about 40 to 60 times a minute, which is usually enough to stay conscious. Doctors can also fit an artificial pacemaker.
Does the heart ever rest?
Each beat includes its own rest. At 75 beats a minute the ventricles spend about 270 ms contracting and the remaining 530 ms relaxed and filling. The muscle is also refractory for about 250 ms after each signal, so it cannot be triggered again too soon.
How fast can a heart beat?
Maximum rates are usually 200 to 220 beats a minute and fall with age. A rough estimate is 220 minus your age. The AV node itself can pass signals at up to about 220 a minute.
What is a normal resting heart rate?
For an adult, 60 to 100 beats a minute, with about 75 as a typical value. Fitness, age, temperature and stress all move it. Newborns rest at about 120. Take a resting rate only after you have recovered from any exercise.
What do the two blood pressure numbers mean?
The first, systolic, is the highest pressure in the arteries while the ventricles push blood out. The second, diastolic, is the lowest, between beats. Both are in mm Hg. What a reading means for you is a question for a doctor, since guidelines differ and one reading proves little.
Is a heart attack the same as cardiac arrest?
No. In a heart attack the blood supply to part of the heart muscle is blocked. In cardiac arrest an electrical fault makes the heart stop pumping suddenly. A heart attack can lead to cardiac arrest, but most heart attacks do not.
How fast are chest compressions given?
For adults, MedlinePlus and the American Red Cross give 100 to 120 a minute, about 2 inches (5 cm) deep, with the chest allowed to rise fully between presses. Both advise taking an accredited course instead of learning from a page.
How many times does a heart beat in a lifetime?
At a steady 70 beats a minute, about 100,800 a day and 36.8 million a year, so roughly 2.9 billion over 80 years. Real hearts speed up and slow down, so this is only an order of magnitude.
Terms
- Atrium: an upper chamber that receives blood from veins.
- Ventricle: a lower chamber that pumps blood into an artery.
- Atrioventricular (AV) valves: the tricuspid and mitral valves between each atrium and ventricle.
- Semilunar valves: the pulmonary and aortic valves at the exits of the ventricles.
- Chordae tendineae: cords that tie the AV valve flaps to the papillary muscles.
- Systole and diastole: the contracting phase of a chamber and its relaxed, filling phase.
- SA node: the pacemaker in the right atrium that starts each beat.
- AV node: the only electrical link from the atria to the ventricles. It delays the signal about 100 ms.
- Bundle of His and bundle branches: the fast path down the wall between the ventricles.
- Purkinje fibres: the fast network that spreads the signal through the ventricle walls.
- Stroke volume: blood ejected by one ventricle in one beat.
- Cardiac output: blood pumped by one ventricle per minute, heart rate × stroke volume.
- Ejection fraction: stroke volume divided by the volume at the end of filling.
- ECG: electrocardiogram, a record of the heart's electrical activity measured on the skin.
Sources
All addresses checked on 2026-10-17.
- OpenStax, Anatomy and Physiology 2e, 19.1 Heart Anatomy (size and weight, chambers, valves, chordae tendineae, wall thickness, pulmonary vessels, beats per day). https://openstax.org/books/anatomy-and-physiology-2e/pages/19-1-heart-anatomy
- OpenStax, Anatomy and Physiology 2e, 19.2 Cardiac Muscle and Electrical Activity (conduction system and its timing, intrinsic rates, ECG waves, refractory period). https://openstax.org/books/anatomy-and-physiology-2e/pages/19-2-cardiac-muscle-and-electrical-activity
- OpenStax, Anatomy and Physiology 2e, 19.3 Cardiac Cycle (phases and durations, atrial kick, heart sounds). https://openstax.org/books/anatomy-and-physiology-2e/pages/19-3-cardiac-cycle
- OpenStax, Anatomy and Physiology 2e, 19.4 Cardiac Physiology (cardiac output, stroke volume and heart rate ranges, ejection fraction, exercise, maximum heart rate). https://openstax.org/books/anatomy-and-physiology-2e/pages/19-4-cardiac-physiology
- OpenStax, Anatomy and Physiology 2e, 18.3 Erythrocytes (colour of oxygenated and deoxygenated haemoglobin). https://openstax.org/books/anatomy-and-physiology-2e/pages/18-3-erythrocytes
- OpenStax, Biology 2e, 39.4 Transport of Gases in Human Bodily Fluids (arterial blood bright red, venous blood darker red). https://openstax.org/books/biology-2e/pages/39-4-transport-of-gases-in-human-bodily-fluids
- National Library of Medicine, StatPearls, Electrocardiogram (PR, QRS and QT intervals, Einthoven). https://www.ncbi.nlm.nih.gov/books/NBK549803/
- National Heart, Lung, and Blood Institute, How the Heart Works: What the Heart Looks Like. https://www.nhlbi.nih.gov/health/heart/anatomy
- National Heart, Lung, and Blood Institute, How the Heart Works: How Blood Flows through the Heart. https://www.nhlbi.nih.gov/health/heart/blood-flow
- National Heart, Lung, and Blood Institute, How the Heart Works: How the Heart Beats. https://www.nhlbi.nih.gov/health/heart/heart-beats
- Silverman and Hollman, Discovery of the sinus node by Keith and Flack: on the centennial of their 1907 publication, Heart (PubMed Central). https://pmc.ncbi.nlm.nih.gov/articles/PMC2000948/
- The Nobel Prize, The Nobel Prize in Physiology or Medicine 1924. https://www.nobelprize.org/prizes/medicine/1924/summary/
- World Health Organization, Cardiovascular diseases (CVDs), fact sheet (deaths in 2022, share due to heart attack and stroke). https://www.who.int/news-room/fact-sheets/detail/cardiovascular-diseases-(cvds) (checked 2026-10-23)
- National Heart, Lung, and Blood Institute, High Blood Pressure: Diagnosis (systolic and diastolic pressure, mm Hg, categories). https://www.nhlbi.nih.gov/health/high-blood-pressure/diagnosis (checked 2026-10-23)
- Kim et al., The 2022 focused update of the 2018 Korean Hypertension Society Guidelines for the management of hypertension, Clinical Hypertension (PubMed Central; office threshold 140/90, 130 to 139/80 to 89). https://pmc.ncbi.nlm.nih.gov/articles/PMC9930285 (checked 2026-10-23)
- OpenStax, Anatomy and Physiology 2e, 20.2 Blood Flow, Blood Pressure, and Resistance (systolic, diastolic, pulse and mean arterial pressure). https://openstax.org/books/anatomy-and-physiology-2e/pages/20-2-blood-flow-blood-pressure-and-resistance (checked 2026-10-23)
- Life in the Fast Lane, ECG Rate Interpretation (paper speed 25 mm/s, small and large squares, rate from large squares). https://litfl.com/ecg-rate-interpretation/ (checked 2026-10-23)
- Statistics Korea (via Korea Policy Briefing), 2023 Cause of Death Statistics (deaths, heart disease 64.8 per 100,000, cerebrovascular disease 47.3). https://www.korea.kr/briefing/policyBriefingView.do?newsId=156653541 (checked 2026-10-23)
- National Heart, Lung, and Blood Institute, Heart Attack (a heart attack is not the same as cardiac arrest). https://www.nhlbi.nih.gov/health/heart-attack (checked 2026-10-23)
- National Heart, Lung, and Blood Institute, Cardiac Arrest (sudden stop of pumping caused by arrhythmia). https://www.nhlbi.nih.gov/health/cardiac-arrest (checked 2026-10-23)
- National Library of Medicine, MedlinePlus, CPR (100 to 120 pushes a minute, about 2 inches, hands-on training). https://medlineplus.gov/cpr.html (checked 2026-10-23)
- American Red Cross, CPR Steps (100 to 120 compressions a minute, at least 2 inches). https://www.redcross.org/take-a-class/cpr/performing-cpr/cpr-steps (checked 2026-10-23)
More exhibits
How nerve signals travel
A nerve cell sits at about −70 mV, and when a stimulus lifts it to about −55 mV it fires a spike that is always the same size.
How CRISPR-Cas9 gene editing works
A guide RNA reads just 20 letters of DNA, and that is usually enough to pick out one spot among the 3 billion base pairs of a human genome.
How ATP synthase works
In mitochondria the rotor of ATP synthase turns about 100 times a second, and every full turn releases three molecules of ATP.
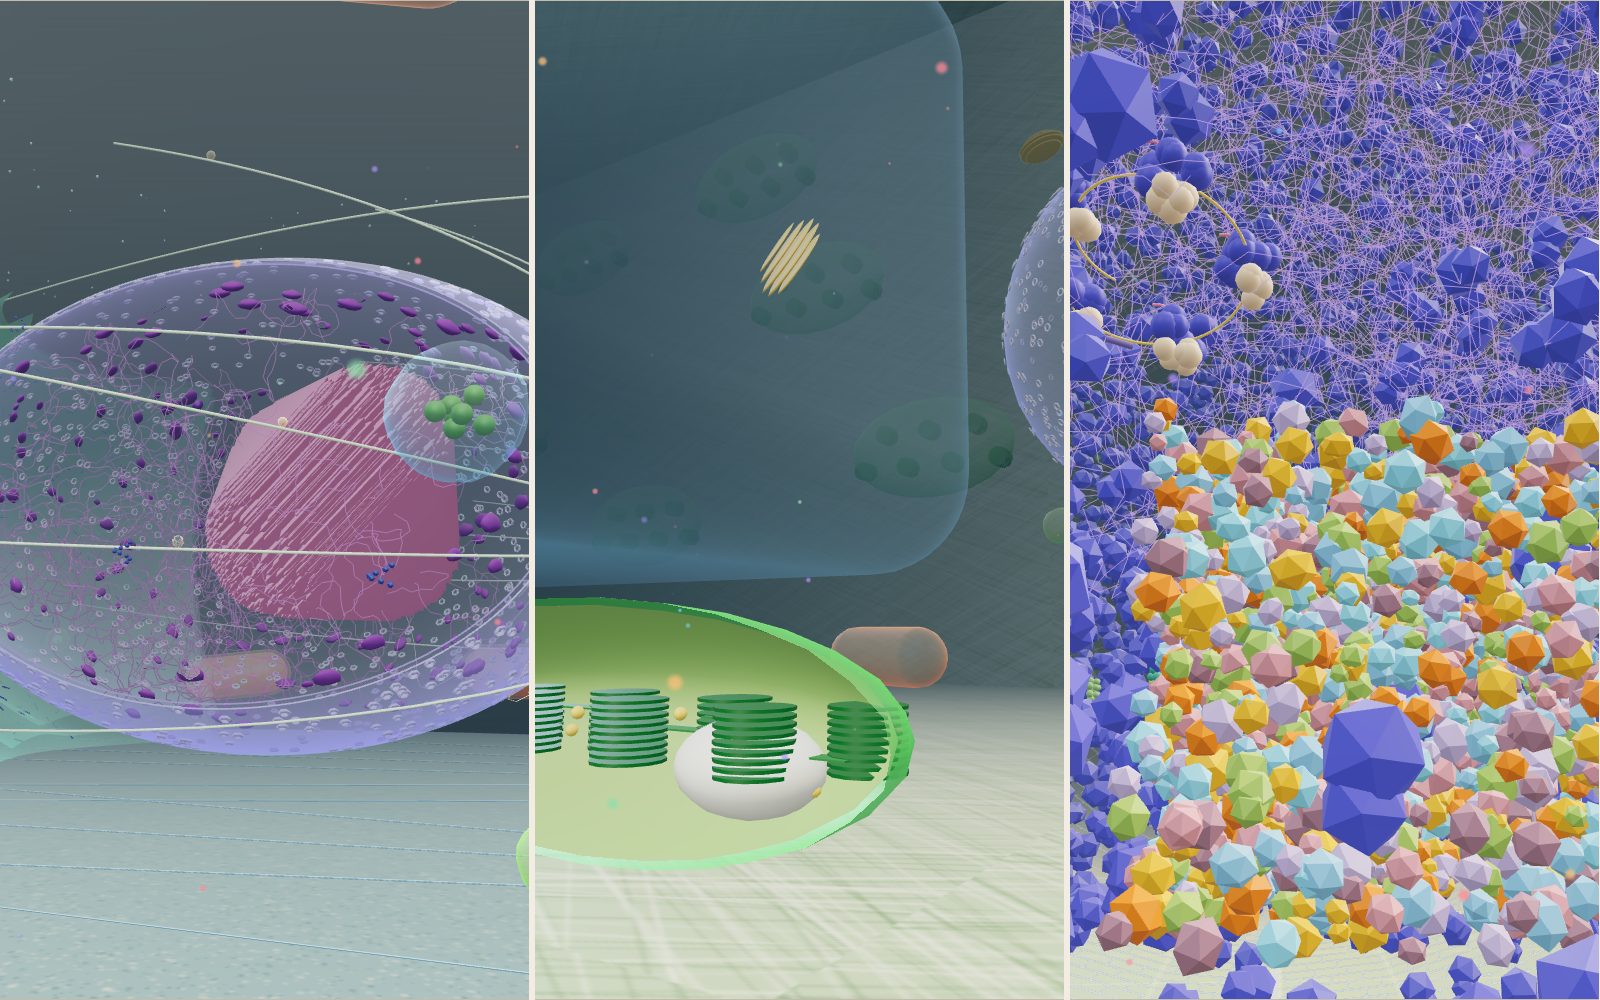
Walk inside a cell: animal, plant and bacterium
Grown a million times, a mitochondrion is about the size of a sofa, a whole E. coli is 2 m long, and the kinesin towing a vesicle past you walks at 0.8 metres per second.
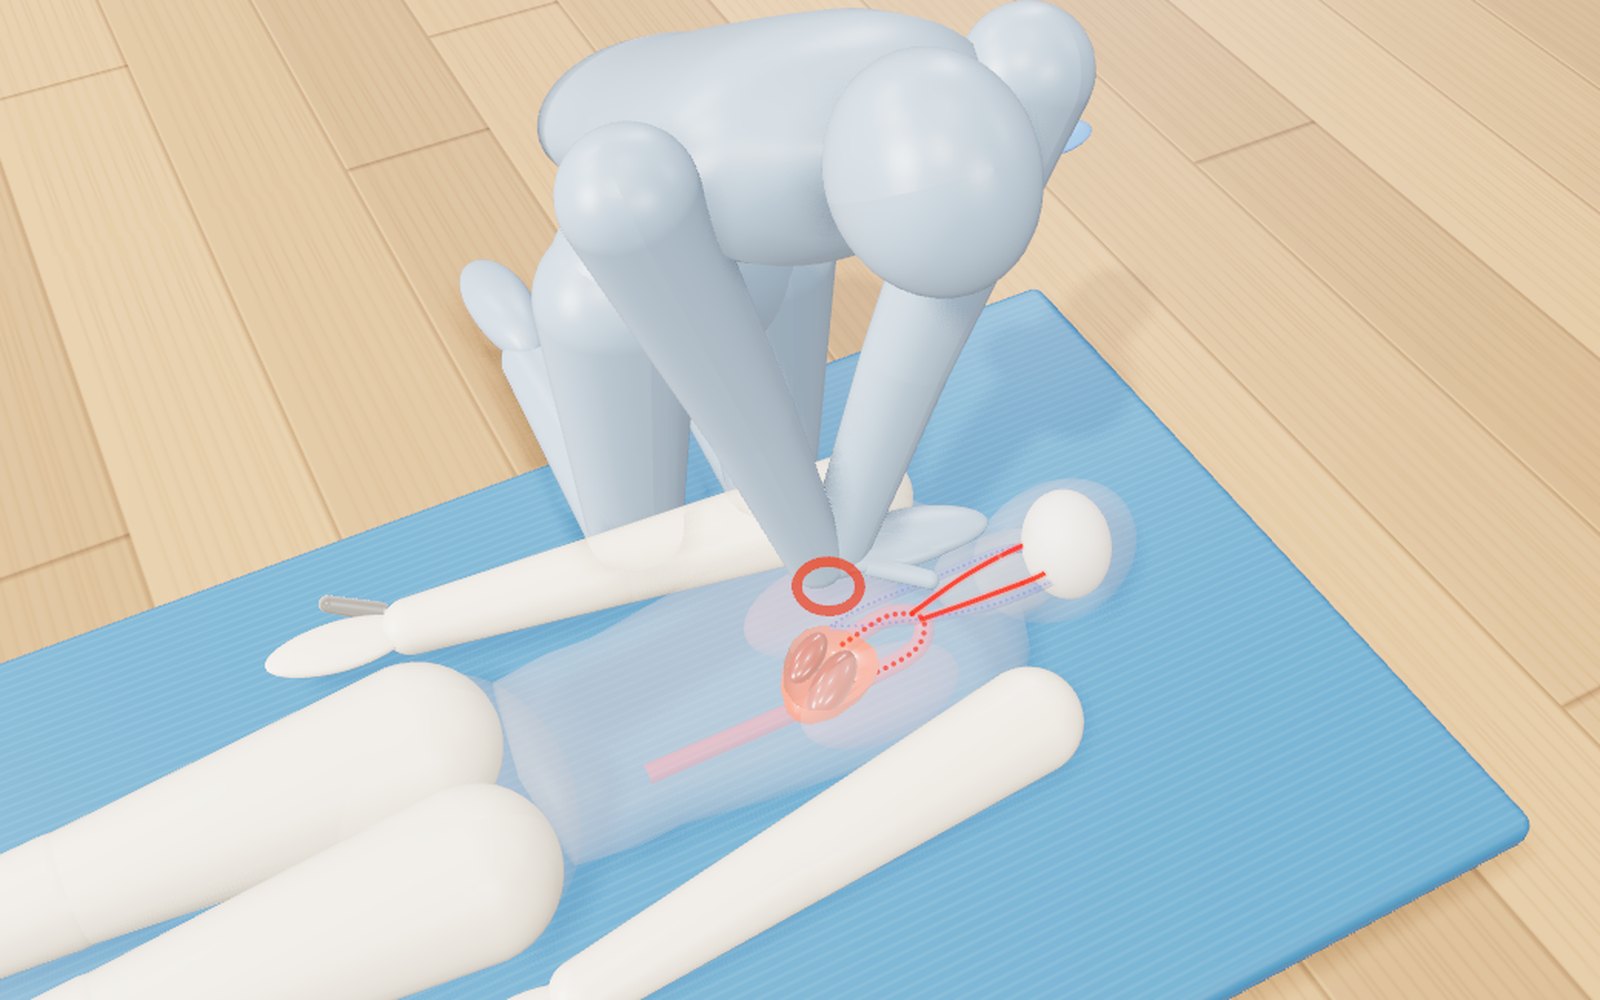
How to do CPR, use an AED, help someone choking and use a fire extinguisher
Push 100 to 120 times a minute, about 5 cm deep: with a bystander doing that, survival in Korea in 2024 was 2.36 times higher.
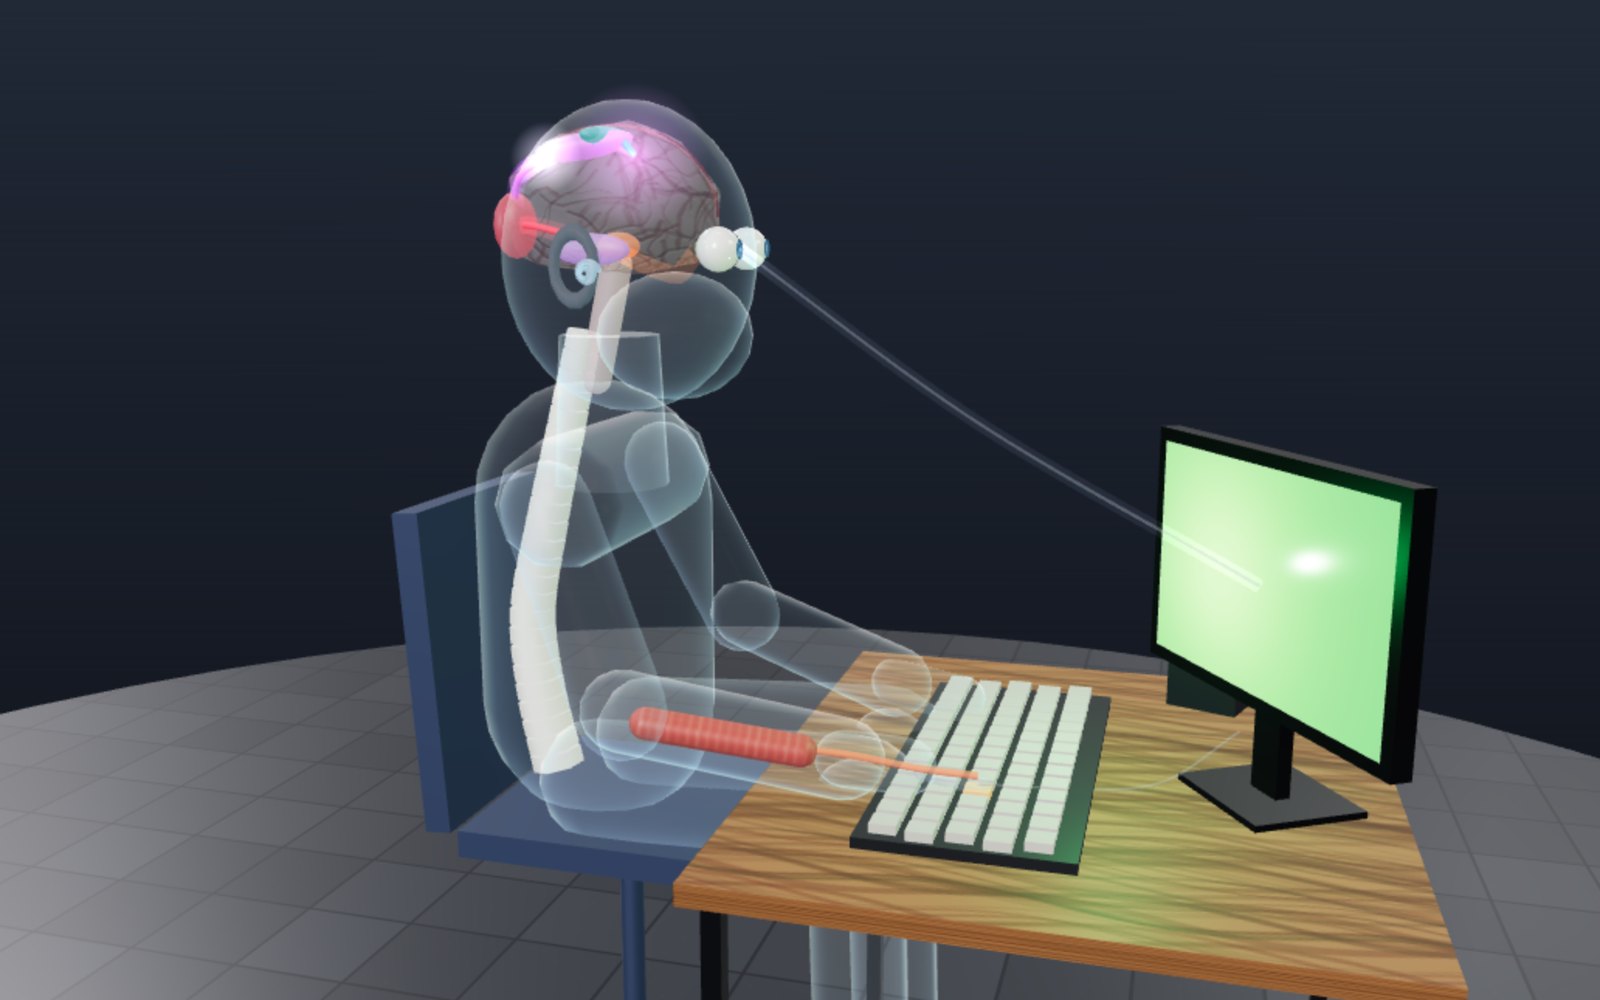
Reaction time test: how many milliseconds do you take?
Light from the screen reaches your eye almost at once, yet your finger moves about a fifth of a second later. Most of that time passes inside your head.